

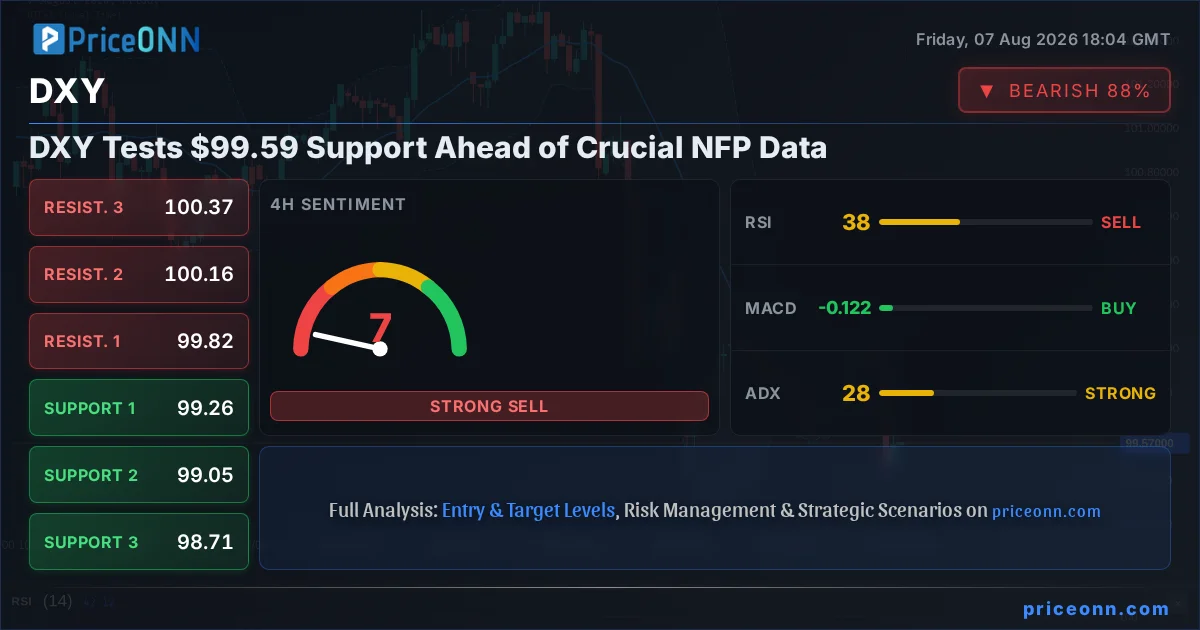
The Dollar Index (DXY) is currently navigating a critical juncture, trading at precisely $99.59 as the market holds its breath for the pivotal July Non-Farm Payrolls (NFP) report. This key economic data release, due imminently, carries the potential to dramatically reshape currency markets and inject much-needed direction into the DXY's recent consolidation. With traders meticulously dissecting every tick and indicator, the question on everyone's mind is whether the dollar can find footing above key support levels or if the upcoming jobs data will trigger a significant downturn, exacerbating the existing downtrend momentum observed across multiple timeframes.
- The DXY is trading at $99.59, testing support levels around $99.48.
- ADX at 28.46 indicates a strong downtrend on the 4-hour chart, while the daily chart shows a more pronounced bearish trend.
- RSI(14) readings are mixed across timeframes: 36.46 (1H), 37.39 (4H), and 35.12 (1D), all indicating bearish momentum.
- The upcoming July Non-Farm Payrolls report is a critical catalyst that could break the current consolidation and significantly impact the DXY's trajectory.
The DXY's price action over the past several weeks has been characterized by a persistent struggle to maintain upward momentum, often finding itself retreating from resistance levels. This indecision highlights a market caught between conflicting macroeconomic narratives and awaiting a definitive catalyst. The current price of $99.59 represents a significant psychological level, and its proximity to the 4-hour support at $99.48 underscores the immediate battleground for bulls and bears. A decisive break below this threshold could unlock further downside, potentially targeting the next support at $99.26, as indicated by our technical data. Conversely, a strong NFP print could provide the impetus for a dollar rebound, challenging the overhead resistance levels that have capped recent rallies.
Navigating the Technical Landscape: Indicators Signal Caution
On the 1-hour chart, the DXY presents a complex picture. The trend is technically neutral with a power of 50%, yet the ADX at 36.48 suggests a strong trend is in play, albeit with a bearish lean according to the 1H signal. RSI(14) sits at 36.46, firmly in neutral territory but pointing towards bearish momentum, a sentiment echoed by the MACD, which is currently below its signal line, printing negative momentum. Stochastic signals are also mixed, with %K at 46.53 and %D at 49.39, indicating a potential downturn. While the overall signal leans towards 'SELL' (0 Buy, 8 Sell, 0 Neutral), the immediate price action around $99.59 suggests a temporary pause. The Bollinger Bands are trading below the middle band, reinforcing the bearish inclination on this shorter timeframe.
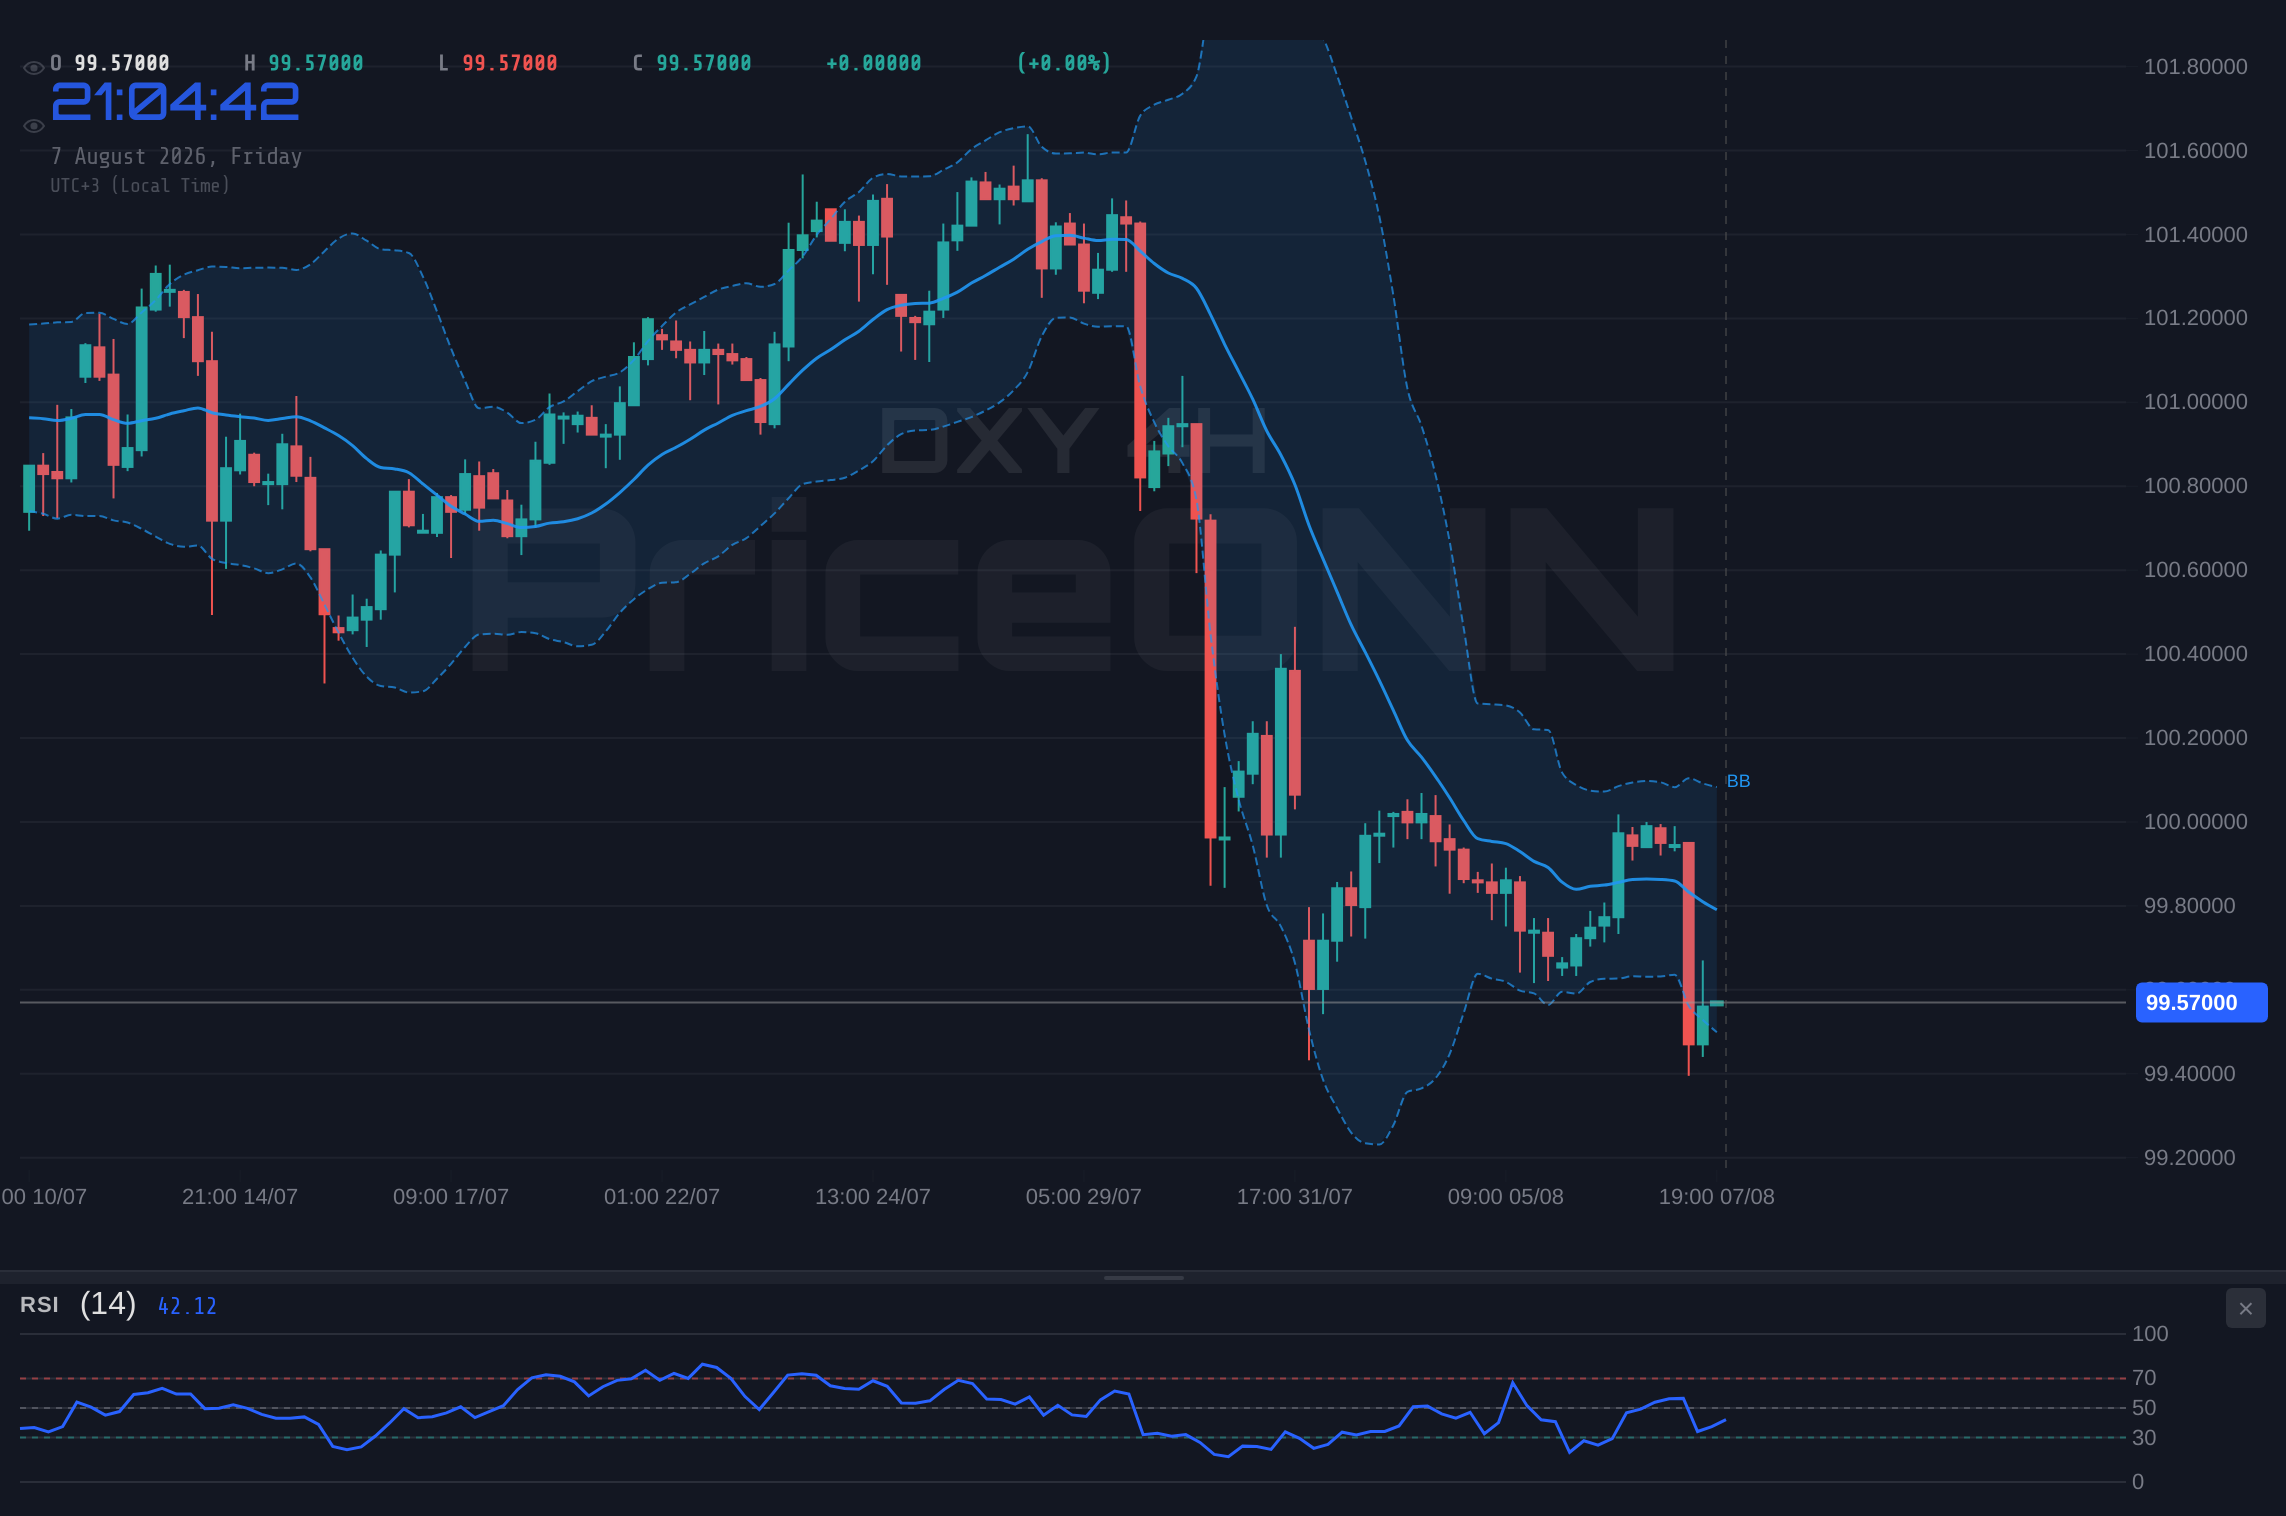
Shifting to the 4-hour timeframe, the technical indicators paint a more consistent, albeit still cautious, picture. The trend remains neutral with a power of 50%, but the ADX at 28.46 confirms a strong downtrend is actively developing. The RSI(14) is at 37.39, continuing the bearish narrative, and the MACD is showing positive momentum, but crucially, it remains below its signal line, indicating ongoing selling pressure. Stochastic oscillators are showing %K at 41.41 and %D at 72.38, a clear 'SELL' signal that reinforces the bearish outlook. The overall signal for this timeframe is a strong 'SELL' (1 Buy, 7 Sell, 0 Neutral), suggesting that any upward price action might be short-lived unless fundamental catalysts intervene. The Bollinger Bands continue to hug the middle band, indicating a potential for consolidation within this downtrend, but the persistent bearish signals from RSI and Stochastic cannot be ignored.
The daily timeframe provides the broadest perspective, and here, the bearish sentiment is even more pronounced. The trend is classified as neutral with a power of 50%, yet the ADX at 27.49 firmly establishes a strong downtrend. RSI(14) is deeply entrenched in bearish territory at 35.12, suggesting significant selling pressure has been in play. The MACD, while showing negative momentum, is positioned below its signal line, confirming the bearish bias. Stochastic readings are particularly telling: %K at 14.36 and %D at 15.31 are deep in oversold territory. While this can sometimes signal a potential reversal, in the context of a strong downtrend, it often indicates that bears are firmly in control and the selling pressure is intense. The overall signal for the daily chart is a resounding 'SELL' (2 Buy, 6 Sell, 0 Neutral). This confluence of bearish indicators across multiple timeframes suggests that the DXY is fundamentally vulnerable, and any upward moves may be viewed as opportunities for further short-selling by seasoned traders.
Correlation Analysis: DXY's Impact on Global Markets
The Dollar Index (DXY) is not just a measure of the greenback's strength against a basket of major currencies; it's a critical barometer influencing global financial markets. Historically, a strengthening DXY, especially when it breaks key resistance levels, tends to put pressure on gold (XAUUSD) and silver (XAGUSD) prices. Conversely, a weakening dollar often correlates with rising precious metal prices, as they become more attractive to international buyers. Currently, with the DXY showing bearish signals and trading near $99.59, we observe gold rallying significantly to $4341, up 2.37%. This inverse correlation is playing out as expected, with the dollar's weakness providing a tailwind for gold. The recent news highlighting gold's surge above $4,300 following weaker-than-expected US jobs data further solidifies this relationship.
Furthermore, the DXY's movements have a direct impact on major currency pairs. A sustained downturn in the DXY typically supports pairs like EURUSD and GBPUSD, pushing them higher as the dollar loses purchasing power. We see this reflected in the data: EURUSD is trading at 1.15599, up 0.32%, and GBPUSD is at 1.34941, also showing gains. Conversely, USDJPY often moves in tandem with the DXY, and its current price of 157.501, down 0.54%, aligns with the dollar's weakness. The correlation analysis underscores the DXY's systemic importance. As traders anticipate the NFP report, the ripple effects across forex, metals, and even equities are significant. The market sentiment, often gauged by risk appetite shown in indices like the S&P 500, also plays a role. With the S&P 500 showing a 0.74% gain, suggesting some risk appetite, the dollar's weakness might be more policy-driven than a pure flight to safety.
The energy markets, particularly Brent and WTI crude oil, also exhibit a complex relationship with the DXY. While a stronger dollar can sometimes curb demand for dollar-denominated commodities, making them more expensive for holders of other currencies, the current geopolitical landscape adds another layer of complexity. The news regarding the Hormuz crisis and ongoing tensions in the Middle East, as reported by Reuters and Bloomberg, are significant drivers for oil prices, often overshadowing the DXY's influence. Brent crude is trading at $82.42, showing a slight uptick, while WTI is at $79.20, nearly flat. This suggests that while the DXY's bearish trend might normally support oil prices, geopolitical risk premiums are currently playing a dominant role in energy market dynamics. The market's reaction to these varied factors highlights the intricate web of correlations that analysts must navigate.
Geopolitical Undercurrents and Macroeconomic Drivers
The current market environment is heavily influenced by a complex interplay of macroeconomic data and persistent geopolitical risks. The recent news about the closure of the Strait of Hormuz, as reported by Bloomberg, has injected a significant geopolitical risk premium into oil prices and global trade sentiment. This development, coupled with ongoing US-China tensions, creates an environment where safe-haven assets like gold tend to benefit. The fact that gold has surged above $4,300, as noted in recent reports, is a direct consequence of these elevated geopolitical concerns, providing a counterbalance to the DXY's bearish technical signals. Investors are seeking stability amidst global uncertainty, and the dollar, despite its current technical weakness, remains a primary safe-haven currency, though its effectiveness is being tested.
From a macroeconomic perspective, the upcoming July Non-Farm Payrolls (NFP) report is the most significant event on the horizon. Projections, as per recent financial news, anticipated an increase of around 83,000 jobs, but a shocking headline figure of a 23,000 job loss in July, as reported by forex news outlets, has sent ripples through the market. This unexpected decline in employment significantly reduces the probability of a September Fed rate hike, a key driver for dollar strength. The market's immediate reaction, with the dollar weakening and gold prices surging, confirms that this data print is a game-changer. The implications for Fed policy are profound; a weaker labor market could force the Federal Reserve to reconsider its hawkish stance, potentially leading to a pause or even a pivot in monetary policy sooner than anticipated. This shift in expectations is a powerful catalyst that could drive the DXY lower.
Central bank policy remains a dominant theme. While the Federal Reserve has signaled a commitment to taming inflation, data points like the negative NFP reading challenge this narrative. The market is now pricing in a lower probability of further rate hikes, which directly impacts the DXY. The yield curve, a key indicator of economic health and future monetary policy, also plays a crucial role. While specific yield data isn't provided in the market context, a significant inversion or flattening of the yield curve, often preceding a recession, would further pressure the Fed to adopt a more accommodative stance, thereby weakening the dollar. Understanding these interconnected macroeconomic factors is crucial for interpreting the DXY's price action and anticipating its future direction, especially in the wake of such surprising employment data.
Trade Scenarios and Strategic Outlook
Given the current technical setup and the looming NFP data, a multi-scenario approach is essential for navigating the DXY. The prevailing bearish trend on the daily chart, reinforced by RSI and MACD readings, suggests that downside risk remains elevated. However, the mixed signals on shorter timeframes and the critical support level at $99.48 introduce an element of uncertainty. The market is clearly waiting for confirmation, and the NFP report is poised to provide it.
Bearish Scenario: Dollar Breakdown Below $99.48
65% ProbabilityNeutral Scenario: Consolidation Around $99.59
25% ProbabilityBullish Scenario: NFP Fuels Dollar Rally
10% ProbabilityThe bearish scenario appears most probable given the current technical indicators and the surprising negative NFP figure. A break below $99.48 could trigger a rapid decline, especially if market participants interpret the jobs data as a sign of a weakening US economy that will force the Fed's hand. The targets at $99.26 and $99.05 represent logical extensions of this bearish move. However, the market is never entirely predictable. A surprisingly strong NFP report, or a sudden escalation in geopolitical tensions, could flip the script, driving the DXY higher towards $99.82 and potentially $100.16. Traders must remain vigilant, closely monitoring price action around the key support and resistance levels, and be prepared to adjust their positions based on the incoming economic data and evolving market sentiment. The ADX at 28.46 on the 4-hour chart confirms that a strong trend is indeed developing, making the direction of the next breakout crucial.
Key Levels and What to Watch Next
The immediate price action for the DXY is centered around the $99.59 mark. Key support levels to monitor are situated at $99.51, $99.46, and more critically, $99.43 on the 1-hour chart. On the 4-hour chart, these levels shift slightly to $99.26, $99.05, and $98.71. Resistance is currently faced at $99.59 (current price), $99.62, and $99.67 on the 1H chart, with 4-hour resistance levels at $99.82, $100.16, and $100.37. These levels will act as critical decision points for traders evaluating short-term and medium-term directional bets.
The upcoming NFP report is the single most important factor that will dictate the DXY's trajectory in the short term. A reading significantly below expectations, as suggested by the surprising -23,000 job loss figure, would likely reinforce the bearish trend, potentially pushing the DXY towards the $99.05 support. Conversely, an unexpectedly strong report could spark a dollar rally, challenging the $99.82 resistance and possibly aiming for higher levels. Traders should also pay close attention to the commentary accompanying the NFP release and any subsequent statements from Federal Reserve officials, as these will provide crucial insights into future monetary policy expectations. The current ADX of 27.49 on the daily chart signals a strong trend, making the direction of the next breakout particularly significant for market participants.
The prevailing sentiment, supported by the daily chart's bearish trend and oversold Stochastic readings, leans towards further weakness in the dollar. However, the market's reaction to the NFP data will be the ultimate arbiter. Given the current $99.59 price point and the proximity to support, caution is advised. Risk management remains paramount; traders should look for clear confirmation of a trend continuation before committing to large positions. The interplay between macroeconomic surprises, geopolitical tensions, and central bank policy will continue to shape the DXY's path. As we await the resolution of this critical data point, maintaining a disciplined approach and respecting the key levels identified will be crucial for navigating the volatility ahead.
Frequently Asked Questions: DXY Analysis
What happens if DXY breaks below the $99.48 support level after the NFP report?
A break below $99.48, especially on strong volume following a weak NFP print, would likely trigger further selling pressure. The next key targets would be $99.26 and potentially $99.05, as the market prices in a more dovish Fed outlook and increased economic headwinds.
Should I trade DXY at current levels of $99.59 given the mixed signals and upcoming NFP data?
Trading at current levels of $99.59 is highly speculative due to conflicting signals and the impending NFP report. A high-probability setup would involve waiting for confirmation: either a clear break below $99.48 for a bearish position or a decisive move above $99.82 for a bullish one, ideally after the NFP data provides clarity.
Is the RSI at 35.12 on the daily chart a buy signal for DXY?
While an RSI of 35.12 suggests oversold conditions, it is not a buy signal in isolation, especially within a strong downtrend indicated by the ADX at 27.49. This reading primarily confirms bearish momentum and suggests that bears are in control; a reversal would require additional bullish confirmation like a MACD crossover or a sustained price increase above key resistance.
How will the negative NFP jobs report impact the DXY's trajectory this week?
A significantly negative NFP report, like the reported loss of 23,000 jobs, typically weakens the dollar by reducing expectations for Federal Reserve rate hikes. This could accelerate the DXY's downtrend, pushing it towards lower support levels as market participants reassess the economic outlook and Fed policy path.
| Indicator | Value | Signal | Interpretation |
|---|---|---|---|
| RSI (14) | 35.12 | Bearish | Deeply bearish territory on daily chart |
| MACD Histogram | -0.25 | Bearish | Negative momentum confirmed below signal line |
| Stochastic | 14.36 / 15.31 | Oversold | Deep oversold but within strong downtrend |
| ADX | 27.49 | Strong Trend | Confirms strong downtrend on daily chart |
| Bollinger | Middle Band | Watch | Price trading below middle band, bearish bias |
Track markets in real-time
AI-powered analysis, technical indicators and real-time price data.
Join Our Telegram Channel
Breaking market news, AI analysis and trading signals instantly.
Join Channel