

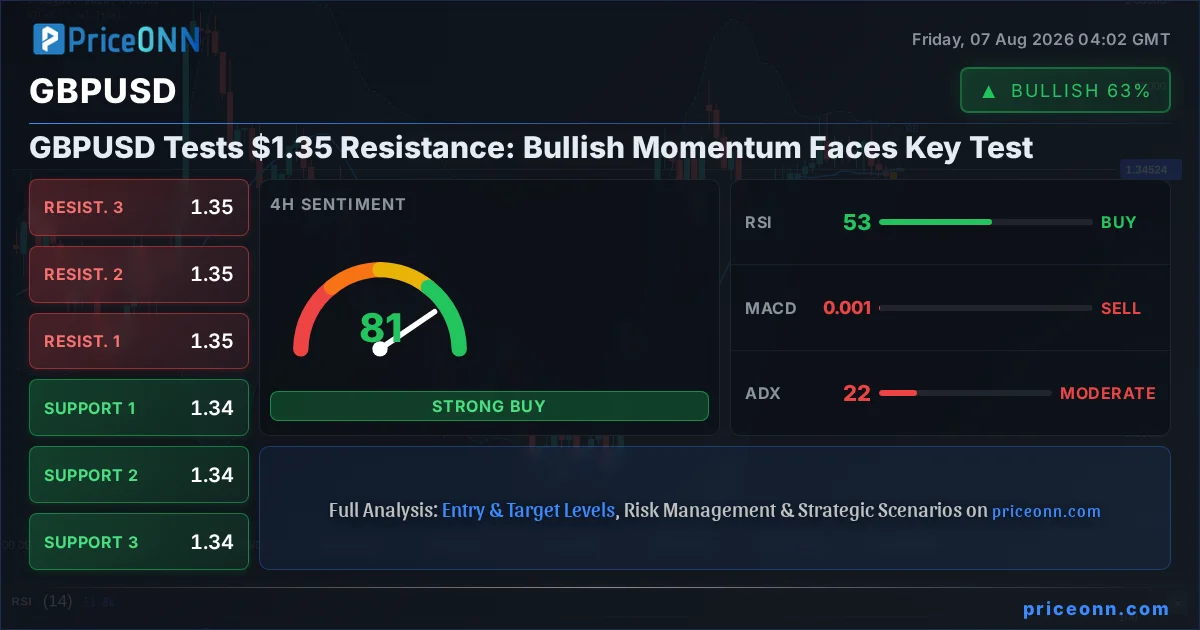
GBPUSD: Bull vs Bear Debate at the $1.35 Threshold
The currency pair GBPUSD is currently locked in a critical battleground, hovering around the $1.35 mark. This pivotal level is not just a psychological barrier but a confluence of technical resistance and the culmination of recent bullish momentum. As traders and analysts dissect the charts and macro undercurrents, a clear divergence in sentiment is emerging. Are the bulls poised to push through this key resistance, or will the bears reassert control and send the pair lower? This analysis delves into the competing narratives, examining the technical indicators, fundamental drivers, and market sentiment that will likely dictate GBPUSD's next significant move.
- GBPUSD trades near $1.35, testing resistance with a 4H ADX of 22.14 indicating a moderate trend.
- The 1D RSI at 55.84 suggests a slight upward bias, but Stochastic K=79.17, D=79.64 hints at potential overbought conditions.
- The US Dollar Index (DXY) is at 99.98, showing a slight upward trend, which typically pressures GBPUSD.
- Geopolitical tensions in the Strait of Hormuz are creating underlying market caution, impacting risk sentiment.
The Bullish Case: Riding the Momentum Wave
On the bullish side, the GBPUSD has demonstrated resilience, carving out a steady upward trend on the daily timeframe. The overall trend strength is rated at 85%, a significant indicator of underlying buying pressure. The daily RSI, currently at 55.84, sits comfortably in neutral territory with an upward eğilim, suggesting there's still room for price appreciation before the pair becomes overbought. This momentum is further supported by the MACD, which is showing positive momentum and is above its signal line on the daily chart, indicating that bullish forces are currently in command. The ADX on the 4-hour chart, while moderate at 22.14, shows a trend that is establishing itself, not yet exhausted. This suggests that the current upward move has legs, and a decisive break above the immediate resistance could trigger further upside. The fact that the price is trading above the middle Bollinger Band on multiple timeframes, particularly the daily chart, reinforces the bullish sentiment, showing that buyers are dictating terms within the current trading range.
Furthermore, the Stochastic Oscillator on the daily chart, with K=79.17 and D=79.64, is approaching overbought territory but hasn't crossed into extreme levels yet. While this signals caution for short-term traders, it also indicates strong buying interest. The 1D General Signal for GBPUSD is AL (Buy: 7, Sell: 1, Neutral: 0), which is a strong endorsement from the technical indicators across multiple timeframes. This aggregate signal strength suggests that, from a purely technical standpoint, the path of least resistance for GBPUSD appears to be upwards. The recent price action, characterized by higher lows and higher highs on the daily chart, paints a picture of a market that is gradually absorbing selling pressure and building towards a potential breakout. The $1.35 level, while a resistance, could act as a launchpad if broken convincingly, especially if accompanied by increasing trading volume.
The Bearish Counterpoint: Resistance and Macro Headwinds
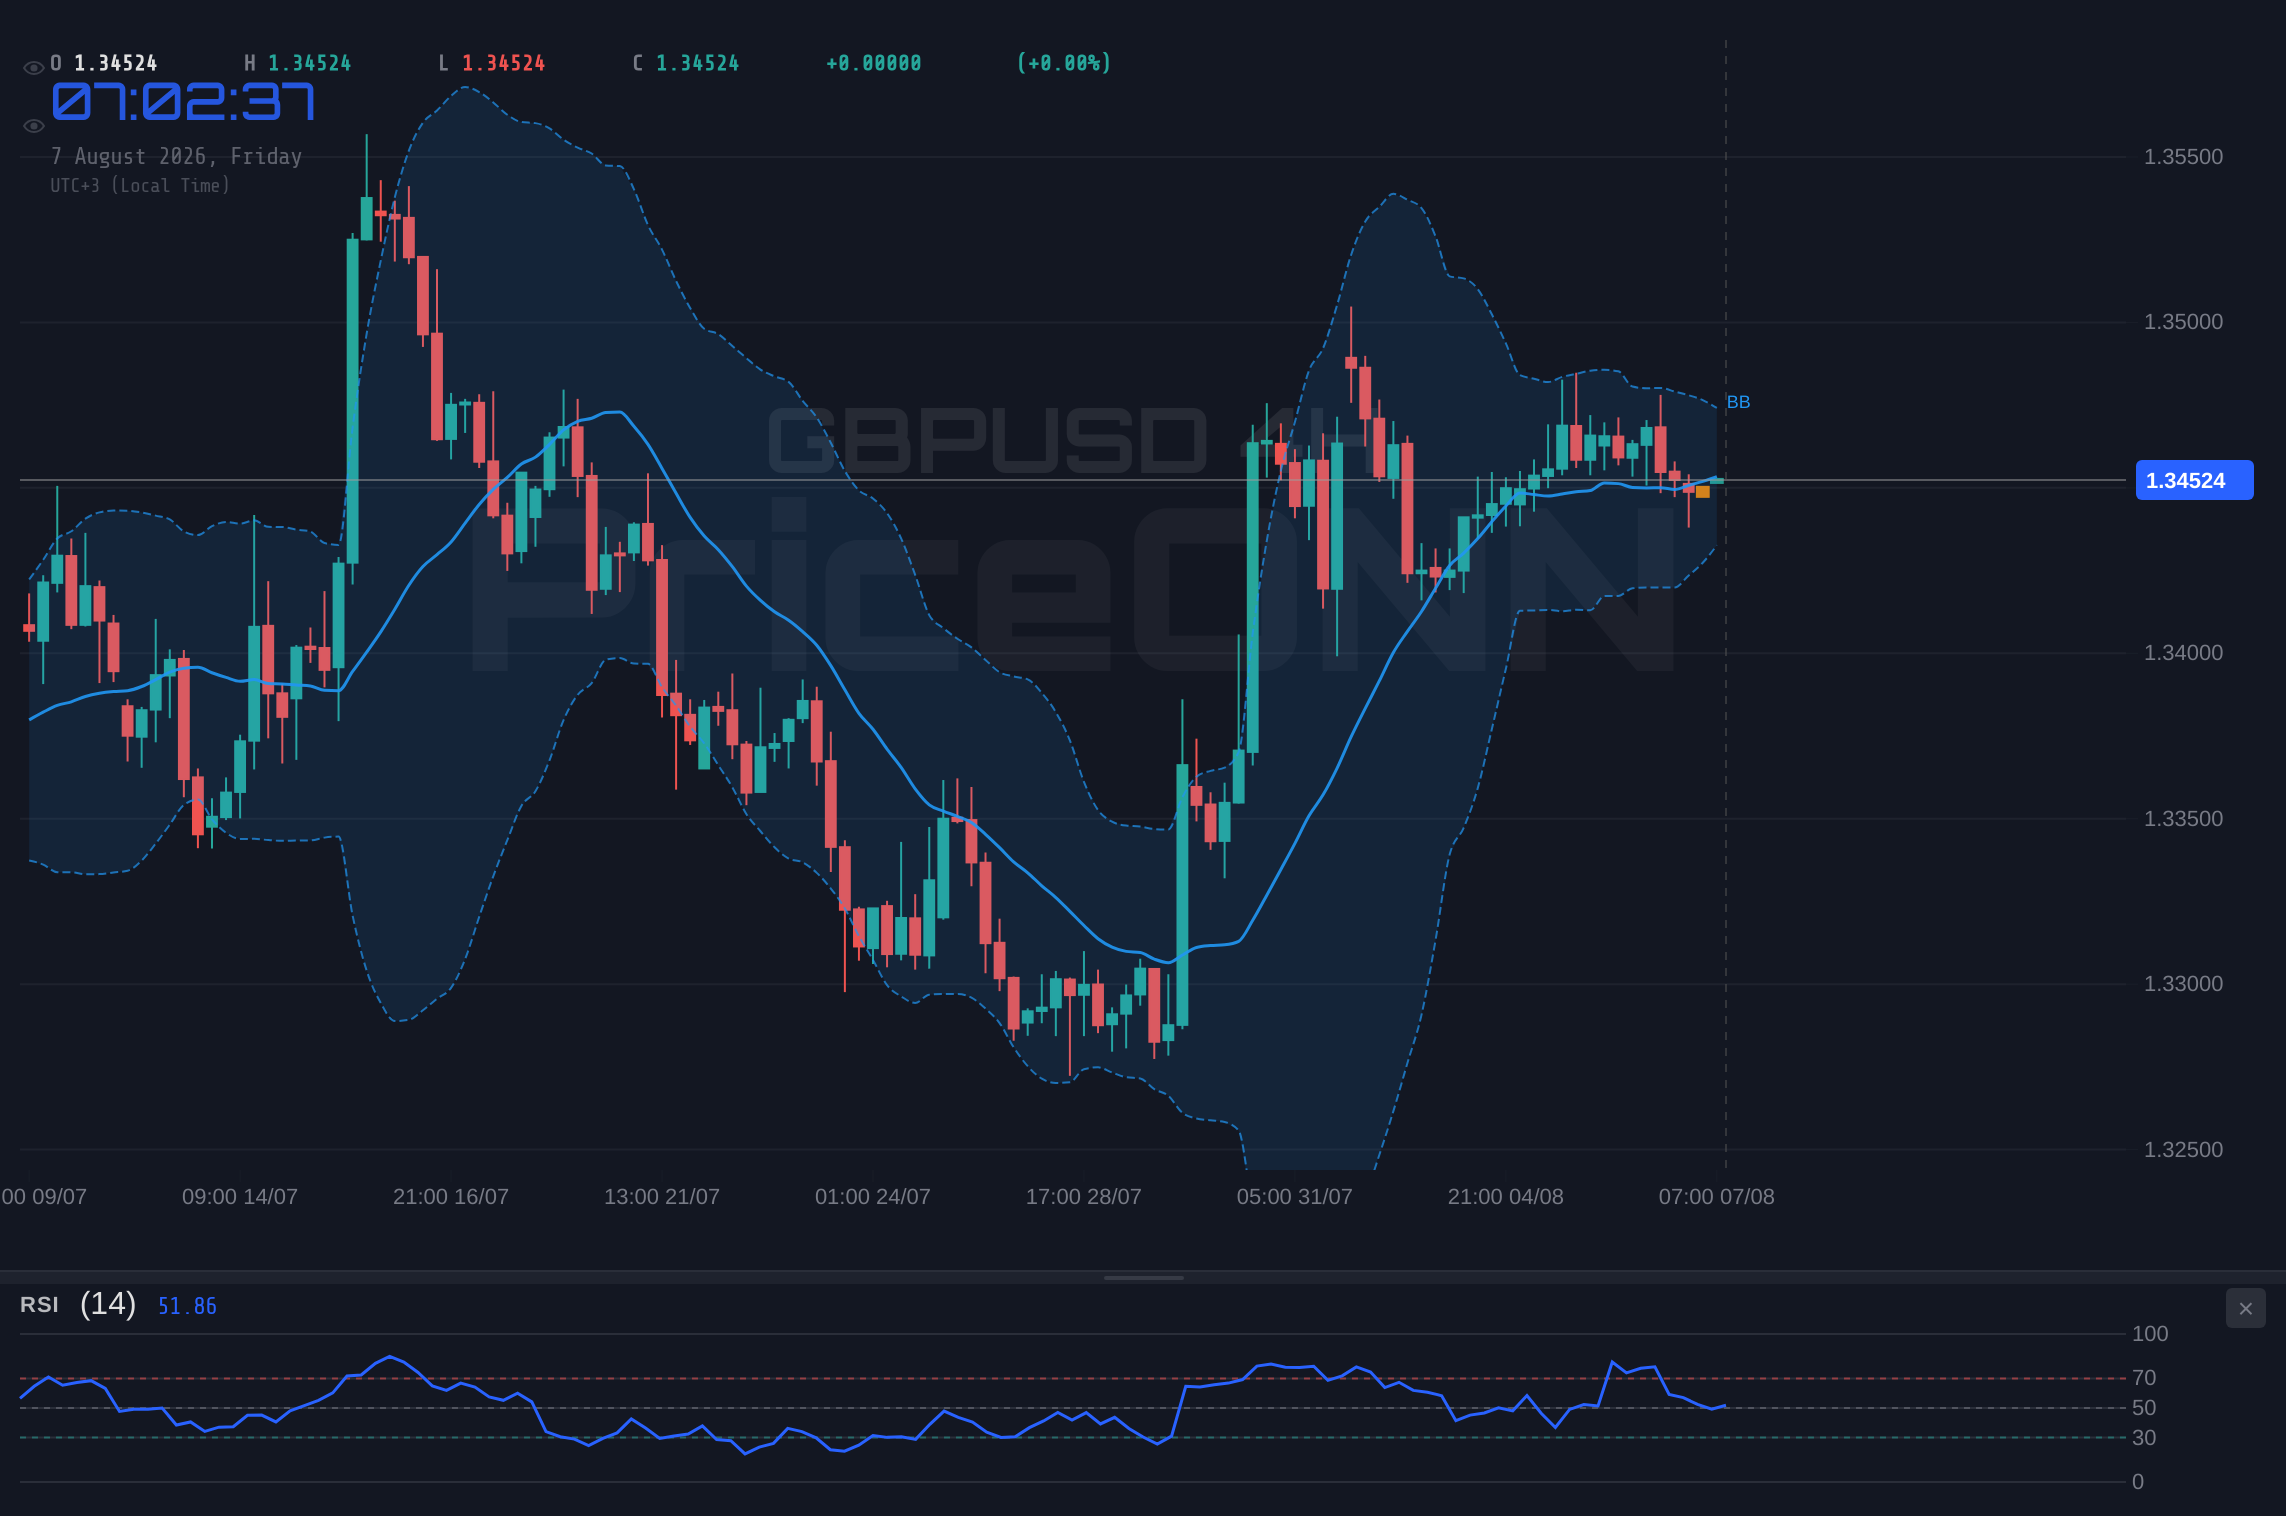
However, the bullish narrative faces significant headwinds. The most immediate obstacle is the $1.35 resistance level itself. On the 1-hour and 4-hour charts, the Stochastic indicators are showing a potential divergence or are in overbought territory, with K values high and D values lagging, suggesting that the recent rally might be losing steam. The 1-hour Stochastic shows K=67.33 and D=50.49, a clear upward signal, but the 1D Stochastic with K=79.17 and D=79.64 is teetering on the edge of extreme overbought conditions, which historically can precede a pullback. The ADX on the 1-hour chart is at 20.28, indicating a trend that is not yet strongly established, and the overall 'General Signal' on the 1-hour timeframe leans towards SELL (Al: 2, Sat: 6, Nötr: 0), signaling potential weakness in the immediate term. This suggests that while the daily trend might be bullish, shorter timeframes are showing signs of exhaustion.
Beyond the immediate technicals, broader market conditions present a challenge. The US Dollar Index (DXY) is currently trading at 99.98, showing a slight upward trend and strength on the 1-hour and 4-hour charts. A stronger dollar typically exerts downward pressure on GBPUSD, as it makes the British pound relatively more expensive for dollar-based buyers. Furthermore, geopolitical events, such as the ongoing crisis in the Strait of Hormuz, are contributing to a cautious risk sentiment. While oil prices have seen some volatility, the underlying geopolitical tension can lead to a flight to safety, often benefiting the US dollar at the expense of riskier currencies or those sensitive to global trade, like the pound. The fact that the 1D MACD is positive but the histogram might be narrowing, combined with the Stochastic nearing overbought on the daily, indicates that the upward momentum may be peaking. Bears are likely watching these signs closely, anticipating a reversal or at least a significant consolidation around the $1.35 level.
Weighing the Evidence: Technicals and Macro Factors
When we weigh the technical evidence, a nuanced picture emerges. The daily timeframe strongly favors the bulls, with a powerful trend and positive MACD momentum. The ADX at 26.43 on the daily chart confirms a strong upward trend, suggesting that the current price action is not just noise but part of a larger move. However, the shorter timeframes, particularly the 1-hour chart, present a more cautious outlook. The RSI is below 50, and the MACD is showing negative momentum, with the general signal leaning towards a sell. This conflict between daily and intraday signals highlights a market in transition, where the prevailing trend is being tested by immediate selling pressure or profit-taking. The Stochastic on the daily chart is a key indicator here; while it's high, it has not yet given a definitive bearish crossover. A sustained move above $1.35, coupled with a bullish signal from the intraday Stochastics or a clearing of overbought conditions without a sharp decline, would strongly favor the bulls.
The correlation with the DXY is paramount. With DXY at 99.98 and showing upward momentum on intraday charts, any sustained strength in the dollar will act as a significant headwind for GBPUSD. The current DXY trend strength on the 1-hour chart is 27.79, indicating a solid upward trend. This means that even if GBPUSD manages to break higher, the gains might be capped if the dollar continues to appreciate. The geopolitical situation in the Hormuz strait, as reported by various news outlets, adds another layer of complexity. This uncertainty can lead to sudden shifts in risk appetite, potentially causing sharp reversals. For instance, a sudden escalation of Middle East tensions could trigger a flight to safe havens, strengthening the dollar and pressuring GBPUSD, regardless of its technical setup. Conversely, any de-escalation or positive resolution would likely boost risk sentiment, potentially benefiting GBPUSD.
Trading Scenarios: Navigating the $1.35 Crossroads
Given the conflicting signals and the critical resistance at $1.35, multiple scenarios are plausible. The market is clearly at a decision point, and traders must be prepared for various outcomes. The ADX value of 22.14 on the 4-hour chart suggests a trend that is present but not overwhelmingly strong, meaning a breakout could be sharp but also that consolidation or a reversal is a significant possibility. The key lies in observing how price action behaves around the $1.35 level and what confirmation the indicators provide.
Bearish Reversal: Bears Reclaim Control Below $1.35
60% ProbabilityConsolidation: Range-Bound Trading Around $1.35
25% ProbabilityBullish Breakout: Bulls Push Through Resistance
15% ProbabilityThe Verdict: Caution Advised, But Bulls Have the Edge
The prevailing technical setup for GBPUSD presents a classic bull vs. bear tug-of-war at a significant resistance level. While the daily chart indicators, particularly the RSI and MACD, offer a bullish bias, the shorter timeframes and the approaching overbought conditions on the daily Stochastic warrant caution. The ADX on the 4-hour chart at 22.14 suggests a trend is in play, but it's not yet a runaway train, leaving room for reversals or consolidation. The DXY's current strength at 99.98 and the lingering geopolitical uncertainties in the Middle East add macro headwinds that cannot be ignored. These factors suggest that a clean, sustained breakout above $1.35 might be challenging in the immediate term.
However, the overall trend strength on the daily chart (85%) and the strong 'AL' signal across multiple timeframes cannot be dismissed. If bulls can manage to push the price decisively above $1.3550, especially with supportive volume and a favorable shift in risk sentiment or dollar weakness, the targets at $1.3590 and potentially $1.3650 become achievable. The bearish scenario, with a trigger below $1.3450, seems more probable in the short term if intraday momentum fades completely, aiming for $1.3440 and $1.3400. Yet, the underlying strength on the daily chart suggests that significant selling pressure would be needed to negate the bullish trend entirely. Therefore, while caution is advised, and risk management should be paramount, the current technical structure on the daily timeframe gives the bulls a slight edge. Traders should look for confirmation: a close above $1.3550 on the daily chart, coupled with a DXY pullback, would be a strong bullish signal. Conversely, a failure to break higher and a slip below $1.3450 would invite bears to take control.
Frequently Asked Questions: GBPUSD Analysis
What happens if GBPUSD breaks decisively above the $1.3550 resistance level?
A sustained break above $1.3550, especially with strong volume and a weakening DXY, would likely trigger further bullish momentum. The next key targets would be $1.3590 (R1 on daily) and potentially $1.3650 (R2 on daily), as the bullish trend strength of 85% on the daily chart would be reconfirmed.
Should I consider selling GBPUSD at current levels near $1.35 given the Stochastic is approaching overbought on the daily chart?
Selling at current levels carries significant risk due to the strong daily bullish trend (85%). While the daily Stochastic at 79.17/79.64 suggests potential overbought conditions, it hasn't given a clear sell signal yet. A more prudent bearish strategy would involve waiting for a confirmed break below the $1.3450 support level, invalidating the current bullish structure.
Is the RSI at 55.84 on the daily chart a strong bullish signal for GBPUSD?
An RSI of 55.84 is considered neutral with a slight upward tendency, indicating that the market is not yet overbought or oversold. While it supports the ongoing bullish trend, it's not an extreme signal on its own. Confirmation from other indicators like MACD and price action breaking key resistance levels would strengthen the bullish case significantly.
How might the DXY's current strength at 99.98 affect GBPUSD's outlook this week?
The DXY's upward trend on intraday charts, currently at 99.98, presents a headwind for GBPUSD. A stronger dollar generally correlates with a weaker GBPUSD, potentially capping upside moves or contributing to a bearish reversal if the dollar continues to climb. Traders should monitor DXY's movement closely as a key driver for GBPUSD's direction.
Track markets in real-time
AI-powered analysis, technical indicators and real-time price data.
Join Our Telegram Channel
Breaking market news, AI analysis and trading signals instantly.
Join Channel