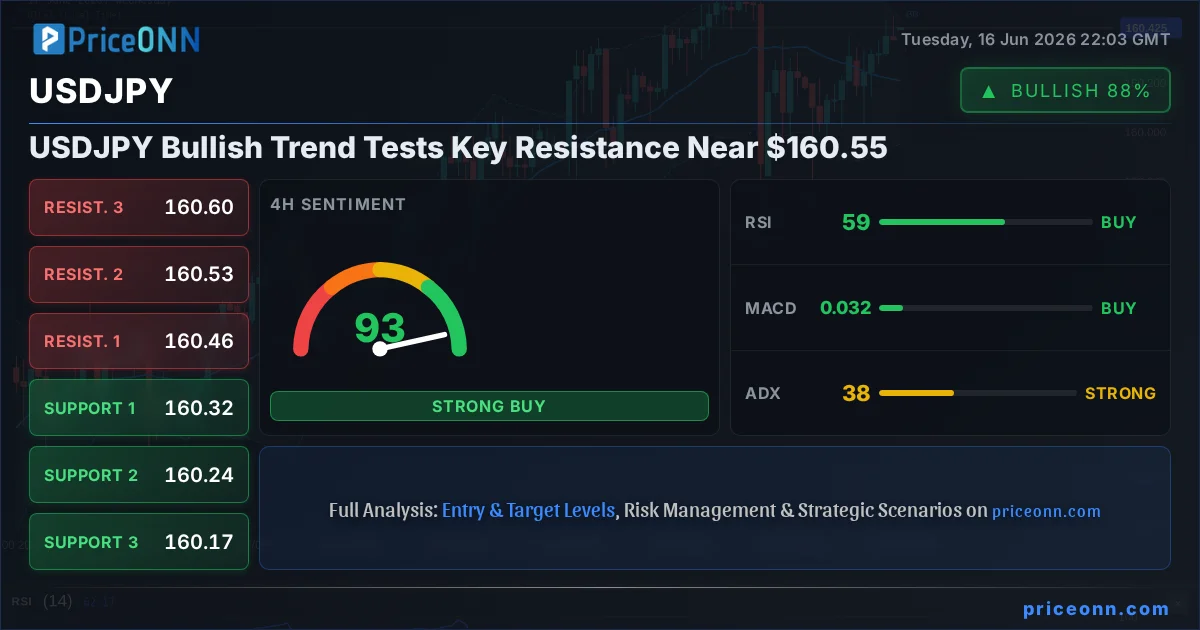
Having tracked USDJPY through the significant volatility of the past year, it's clear that the current upward momentum is building towards a pivotal juncture. The pair is currently trading at $160.44, and the technical indicators are flashing a compelling, albeit mixed, picture. While the daily chart shows a strong uptrend with an ADX reading of 37.85, suggesting robust directional strength, the shorter timeframes reveal a market grappling with resistance. This isn't just another price level; $160.55 has emerged as a critical battleground where bulls and bears are set to clash. Understanding the nuances of this standoff is crucial for navigating the immediate future of this key forex pair.
- USDJPY's daily RSI at 61.73 indicates a neutral-to-bullish sentiment, but short-term indicators suggest caution.
- The critical resistance level to watch is $160.55; a sustained break above this could ignite further upside.
- The ADX at 37.85 on the daily chart confirms a strong trend, but conflicting signals on shorter timeframes demand careful risk management.
- Correlation with the DXY, currently at 99.6, adds another layer of complexity, as dollar strength often pressures USDJPY.
Navigating the Bullish Momentum: USDJPY's Ascent
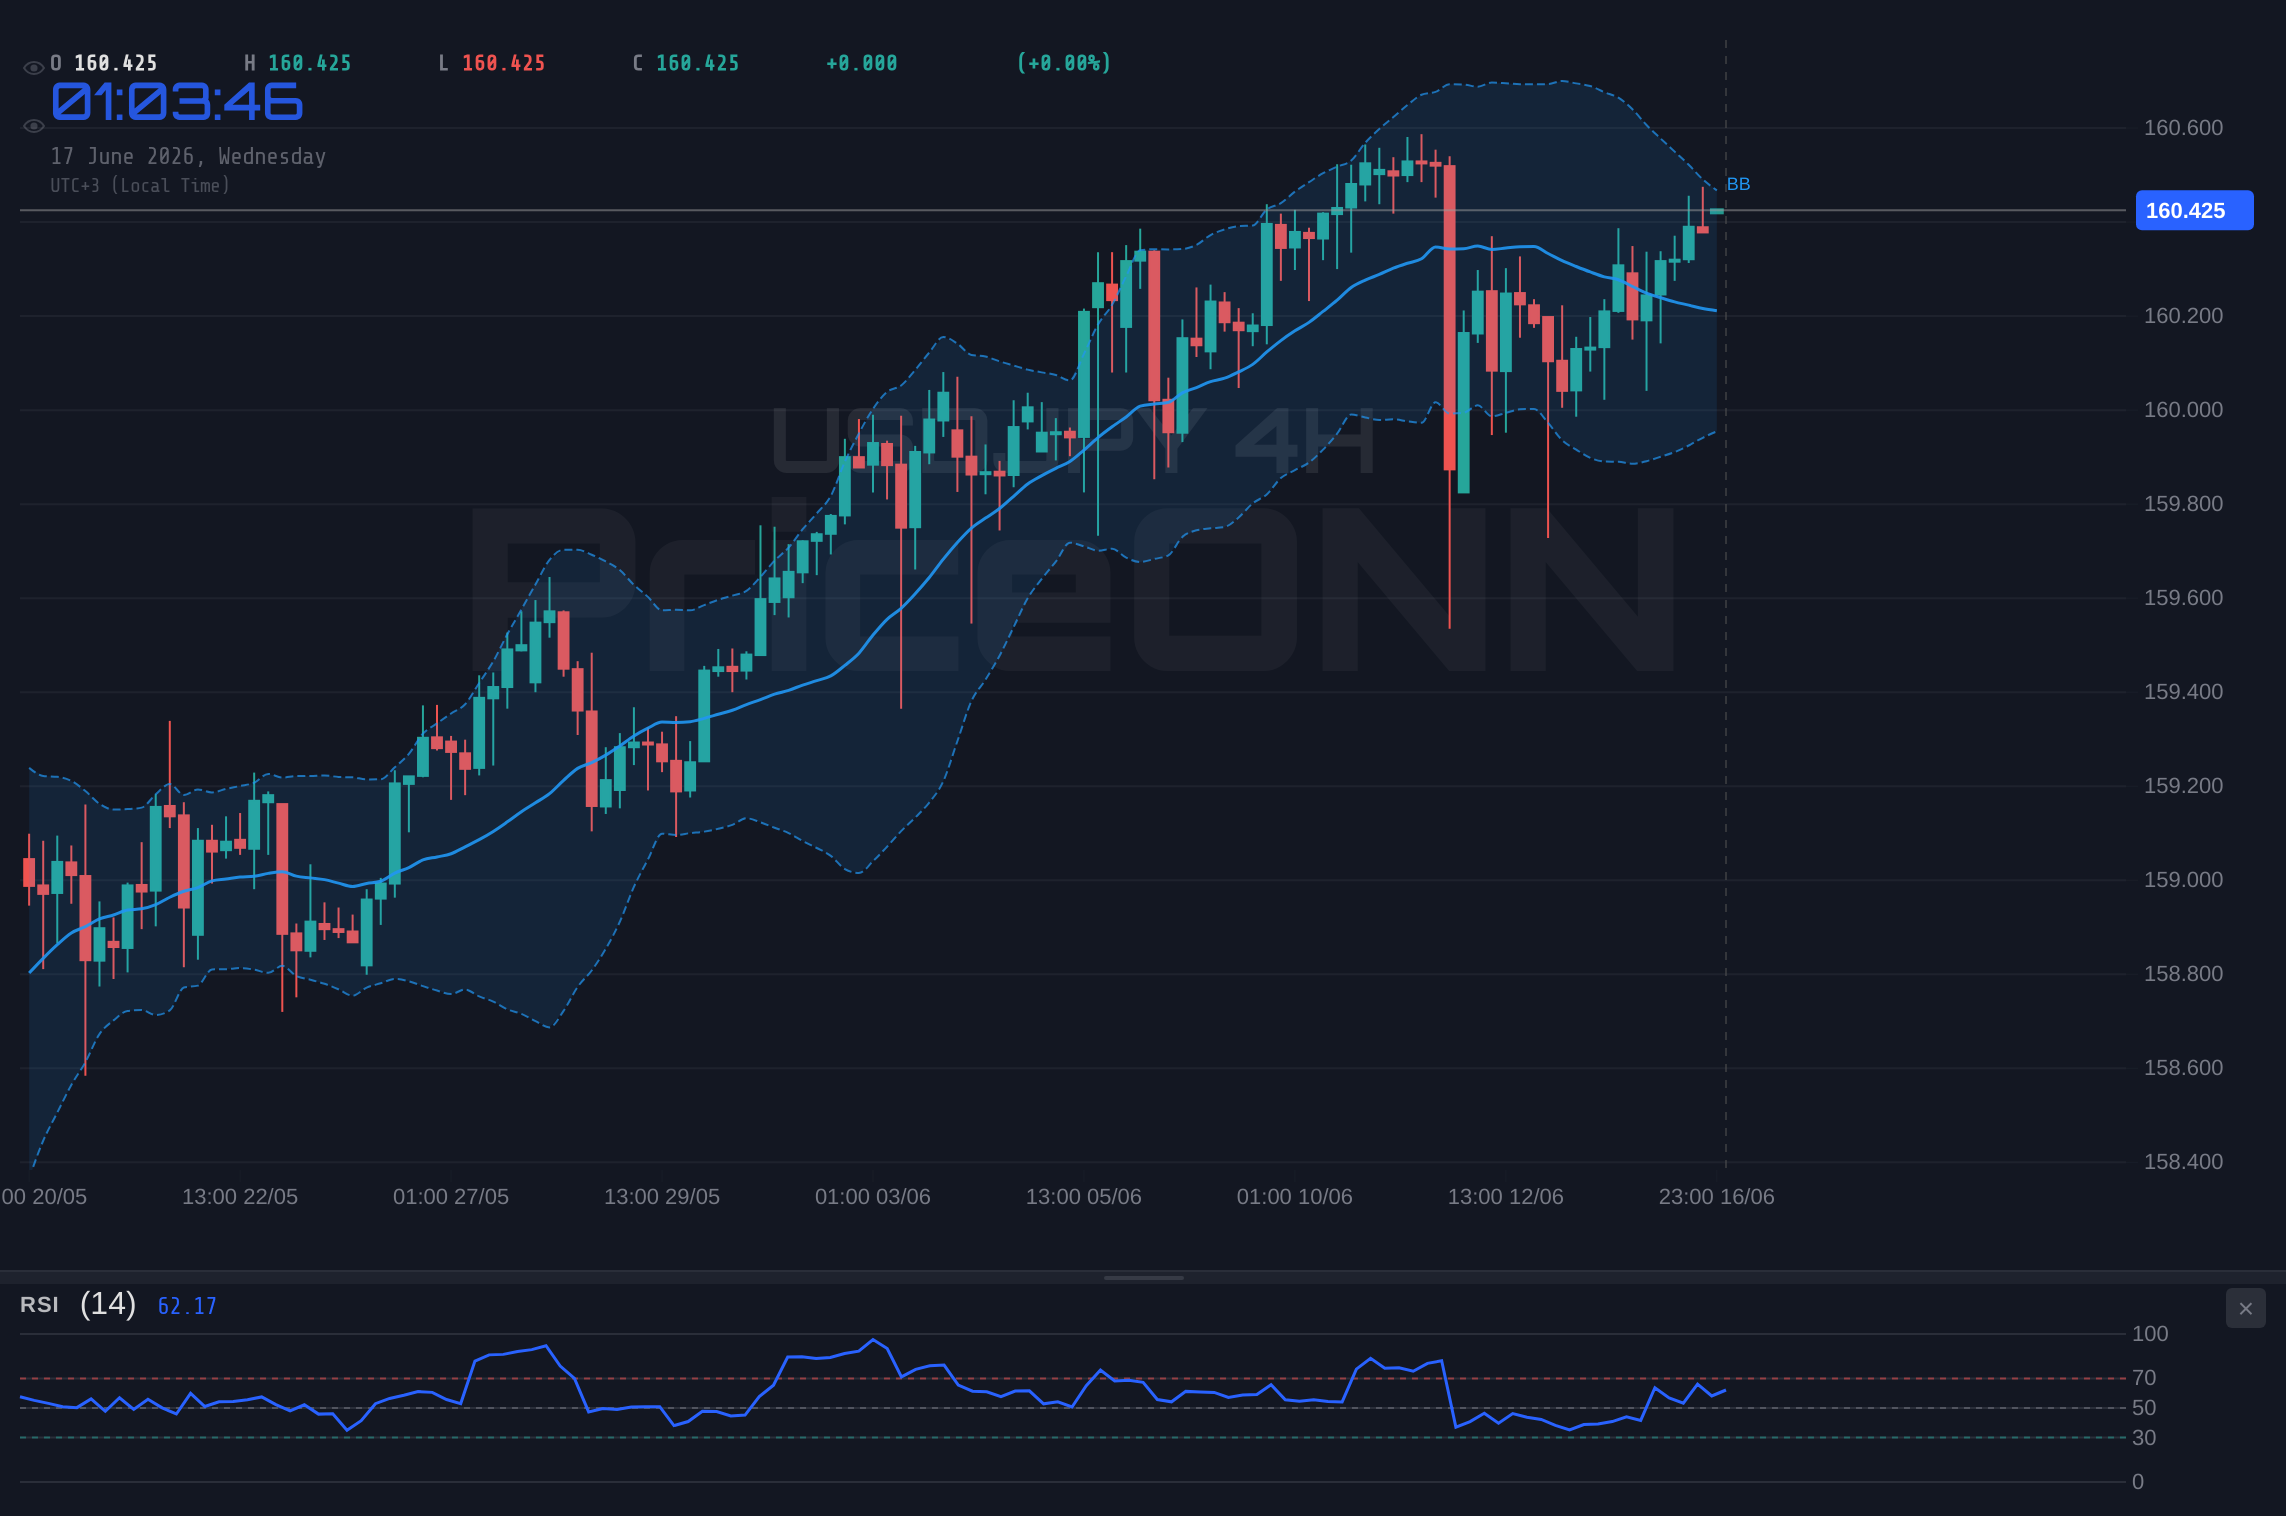
The daily chart for USDJPY paints a picture of persistent bullishness. With the price currently hovering around $160.44, the pair has been on an upward trajectory, driven by a confluence of factors that have bolstered the yen's counterparty, the US dollar. The ADX (Average Directional Index) on the daily timeframe stands at a robust 37.85, signaling a strong and established trend. This isn't a fleeting move; it's a trend with conviction, suggesting that the underlying forces pushing USDJPY higher are significant. This strong trend-following indicator implies that any pullbacks might be temporary, with the potential for the trend to resume once minor corrections are absorbed. For traders looking at the bigger picture, this daily trend strength is a primary signal to consider, suggesting that the path of least resistance is currently to the upside.
However, the narrative becomes more intricate when we zoom out to examine the shorter timeframes. While the daily trend is clear, the 1-hour and 4-hour charts present a more cautious outlook. The RSI (Relative Strength Index) on the 1-hour chart sits at 60.03, indicating a healthy upward bias but not yet in overbought territory. Similarly, the 4-hour RSI is at 59, reinforcing this neutral-to-bullish sentiment. Yet, the Stochastic oscillator on the 1-hour chart shows K=72.07 and D=77.95, hinting at a potential pullback or consolidation phase as it crosses downwards. This divergence between the strong daily trend and the more cautious short-term indicators highlights a key area of tension. It suggests that while the overall direction is up, the immediate path may involve consolidation or minor retracements as the market digests recent gains and approaches significant resistance.
The Crucial Role of Resistance at $160.55
The price level around $160.55 is not just an arbitrary number; it represents a significant psychological and technical barrier for USDJPY. On the 1-hour chart, $160.54 is listed as a resistance level, and $160.507 as another. This confluence of resistance points makes it a critical area to monitor. A sustained move above $160.55 would not only break through immediate selling pressure but also signal a potential acceleration of the bullish trend, opening the door for further upside. Conversely, failure to breach this level could lead to a period of consolidation or even a short-term reversal, as sellers step in to take profits or initiate new short positions. The interplay between the current price of $160.44 and this key resistance zone is where the immediate market direction will likely be determined.
The ADX on the 1-hour chart is a relatively low 10.28, indicating a weak trend on this timeframe, which aligns with the idea that the price action is currently more range-bound or consolidating as it approaches resistance. This lack of strong directional momentum on the intraday charts, despite the daily trend's strength, means that a breakout above $160.55 needs to be confirmed by increased volume and sustained price action. Without such confirmation, the move could be a false breakout, leading to a swift reversal back into a range. Traders will be looking for clear signs of commitment from buyers to overcome this barrier, perhaps signaled by a decisive close above $160.55 on the 1-hour chart, followed by a successful retest of this level as support.
Divergent Signals: What the Indicators Are Saying
Examining the technical indicators across different timeframes provides a complex but informative outlook. On the daily chart, the MACD (Moving Average Convergence Divergence) histogram is positive and the MACD line is above the signal line, reinforcing the bullish momentum. The Bollinger Bands on the daily chart are also showing the price trading above the middle band, indicating an upward bias. However, the Stochastic oscillator on the daily chart shows K=76.73 and D=78.19, which is in overbought territory and crossing downwards, suggesting a potential for a pullback or at least a pause in the rally. This is a classic example of conflicting signals, where the overall trend indicators are bullish, but momentum oscillators are flashing warnings.
On the 4-hour timeframe, the picture is similarly nuanced. The RSI is at 59, suggesting room for further upside, and the MACD histogram is positive, indicating ongoing bullish momentum. However, the Stochastic oscillator here is K=87.1 and D=82.2, firmly in overbought territory and showing a downward cross, which strongly suggests a potential reversal or consolidation is imminent on this timeframe. The ADX on the 4-hour chart is 37.85, confirming a strong trend, but this higher ADX value is often associated with extended moves that can be prone to sharp corrections. This conflicting information across timeframes underscores the importance of a multi-faceted approach, where traders don't rely on a single indicator but rather look for confluence and confirmation.
The Role of Correlated Assets: DXY and Equities
The US Dollar Index (DXY), a key barometer for the dollar's strength against a basket of major currencies, is currently trading at 99.6. The data shows a slight daily decrease of -0.08%, moving in a narrow range. Historically, a strengthening DXY often puts pressure on pairs like USDJPY, implying that a weaker dollar would typically support this pair. However, the relationship isn't always inverse, especially when factors like interest rate differentials or safe-haven flows come into play. Given the current price action, a DXY move below 99.47 (support) could potentially provide further fuel for USDJPY's ascent, while a break above 99.81 (resistance) might signal a dollar recovery, leading to increased pressure on USDJPY.
The performance of major equity indices also offers context. The S&P 500 is currently showing strength, trading at 6572.87 with a 0.74% daily gain, while the Nasdaq 100 is down 1.59% at 30023.99. This divergence, with the tech-heavy Nasdaq showing weakness while the broader S&P 500 advances, suggests a mixed risk appetite in the market. Typically, a strong risk-on environment supports pairs like USDJPY, as investors seek higher yields. However, the weakness in the Nasdaq could signal underlying concerns about growth or specific sectors, which might temper bullish sentiment. The fact that the S&P 500 is holding its ground or advancing implies that overall market sentiment isn't severely risk-off, which is generally supportive for USDJPY, but the Nasdaq's decline warrants attention, especially if it broadens.
Trade Scenarios for USDJPY: Navigating the Uncertainty
Given the conflicting signals and the critical resistance level at $160.55, several scenarios are plausible for USDJPY. The primary focus remains on the daily trend's strength, but the short-term indicators and the psychological resistance demand a careful approach to risk management. Traders must be prepared for potential volatility as the pair approaches and potentially tests this key level. The decision to enter a trade should be based on clear triggers and defined invalidation points, ensuring that risk is controlled regardless of the outcome.
Bearish Scenario: Resistance Holds Firm
35% ProbabilityNeutral Scenario: Consolidation Around Resistance
40% ProbabilityBullish Scenario: Resistance Breakout
25% ProbabilityWhat This Means for Different Trader Types
For scalpers, the immediate action around $160.55 presents opportunities for quick, small gains if they can capture the initial breakout or a short-term bounce from support levels like $160.313. However, the low ADX on the 1-hour chart suggests that these moves might be choppy and require tight stop-losses. Swing traders, on the other hand, will likely wait for a clearer signal. They might prefer to see a confirmed break above $160.55, aiming for the $161.213 daily resistance, or a decisive rejection from $160.55 targeting lower support levels. For longer-term positional traders, the daily trend strength remains paramount. They might view any significant pullback towards the $160.20s as a potential accumulation zone, provided the overall macro environment continues to support a stronger dollar relative to the yen.
The recent news regarding a tentative US-Iran agreement, potentially easing oil prices and impacting global risk sentiment, adds another layer to the analysis. While the immediate impact on USDJPY might be indirect, a significant shift in global risk appetite could influence its trajectory. If the agreement leads to a broad 'risk-on' sentiment, it could support USDJPY, especially if it coincides with continued dollar strength. Conversely, any unexpected escalation or uncertainty stemming from the region could trigger safe-haven flows, potentially benefiting the yen and pressuring USDJPY, although this seems less likely given the current price action and the pair's strong bullish undertone.
The Path Forward: Key Levels to Watch
As USDJPY approaches the critical $160.55 resistance, the market is at a crossroads. The strength indicated by the daily ADX suggests that underlying momentum is bullish, but the short-term oscillators and the psychological significance of the resistance level necessitate caution. Traders should be prepared for a potential breakout scenario, but also for a period of consolidation or even a short-term reversal if the resistance holds firm.
The key takeaway is that while the daily trend favors further appreciation, the immediate price action around $160.55 is where the real battle will be fought. Confirmation of a break above this resistance, ideally on higher volume and followed by a successful retest, would be a strong bullish signal. Conversely, a failure to break through and a subsequent drop below $160.40 could signal a short-term reversal. The DXY's movement and broader market sentiment will also play a crucial role in the coming sessions. Patience and adherence to risk management principles will be paramount for traders looking to capitalize on the next move in USDJPY.
Frequently Asked Questions: USDJPY Analysis
What happens if USDJPY breaks decisively above the $160.55 resistance level?
A confirmed break above $160.55, especially on the 1-hour or 4-hour charts with increased volume, could trigger further bullish momentum. This might lead to price targets near $160.90 and potentially the daily resistance level at $161.213. Such a move would indicate that the bulls have taken control and are pushing towards new highs.
Should I consider a short position if USDJPY fails to break above $160.55, given RSI is at 60.03?
While RSI at 60.03 isn't definitively overbought, a failure to break resistance combined with short-term bearish signals from oscillators like Stochastic could present a shorting opportunity. A confirmed bearish trigger, such as a close below $160.40 on the 1-hour chart, could initiate a move towards support levels like $160.313 or $160.249. Risk management, with a stop-loss above the failed resistance, would be essential.
Is the ADX of 37.85 on the daily chart a reliable indicator for USDJPY's trend right now?
Yes, an ADX of 37.85 on the daily timeframe is a strong signal of a well-established trend, currently bullish for USDJPY. It suggests that the directional move has significant underlying strength. However, it's important to note that high ADX values can sometimes precede sharp reversals, so it should be used in conjunction with other indicators and price action analysis, especially on shorter timeframes where signals are mixed.
How might the current DXY level of 99.6 and the tentative US-Iran deal affect USDJPY this week?
The DXY at 99.6 is near a support level; a further dip could support USDJPY. Conversely, a DXY rebound might pressure the pair. The US-Iran deal's impact is indirect, potentially easing oil prices and influencing global risk sentiment. If it fosters a 'risk-on' environment, it could indirectly support USDJPY, especially if the dollar remains strong. However, any geopolitical uncertainty could trigger safe-haven flows, potentially benefiting the yen.
Track markets in real-time
AI-powered analysis, technical indicators and real-time price data.
Join Our Telegram Channel
Breaking market news, AI analysis and trading signals instantly.
Join Channel