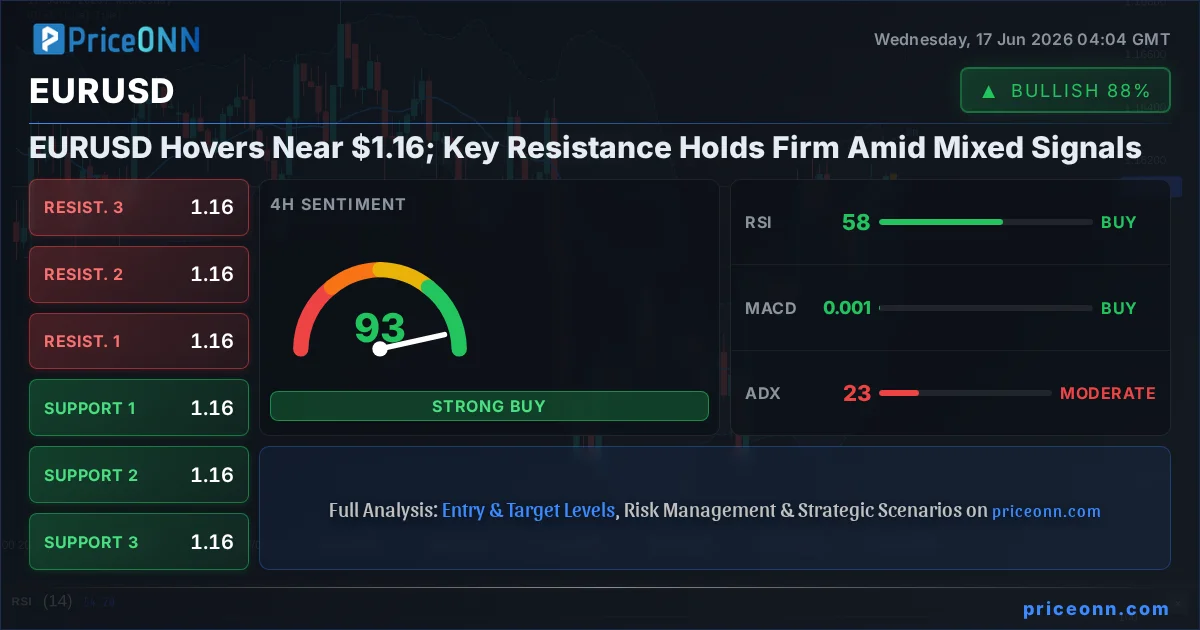
EURUSD is caught in a delicate balancing act, currently trading around the crucial $1.16 psychological level. While the 4-hour chart hints at bullish momentum with an RSI of 58.65 and MACD above its signal line, the daily timeframe paints a more cautious picture, showing a neutral trend with a 50% strength rating and an RSI lingering at 49.61. This divergence suggests that while short-term traders might see opportunities, the broader market sentiment and a lack of clear directional conviction are keeping the pair in a tight range, particularly as it approaches the significant resistance zone just above $1.1612.
- EURUSD is trading around $1.16, approaching key resistance at $1.1612.
- Mixed signals from 1-hour and daily timeframes indicate a neutral to cautious market sentiment.
- DXY strength at 99.58 adds pressure, while a lack of strong trend signals across multiple indicators suggests consolidation.
- The upcoming economic calendar, particularly any major US or EU data releases, will be critical in breaking the current deadlock.
The Tightrope Walk: EURUSD Navigates Choppy Waters
The recent price action in EURUSD, hovering stubbornly around the $1.16 mark, tells a story of indecision in the forex market. Traders are grappling with conflicting signals from various timeframes and a complex global economic backdrop. On one hand, the 4-hour chart, often a bellwether for short-to-medium term trends, shows a degree of bullishness. An RSI reading of 58.65 suggests buyers are still in the game, and the MACD indicator being above its signal line points to positive momentum. However, this optimism is tempered by the daily chart's neutral stance (50% trend strength) and a RSI at 49.61, indicating a lack of sustained directional conviction. This technical tug-of-war means that any significant move will likely require a catalyst to break the current equilibrium.
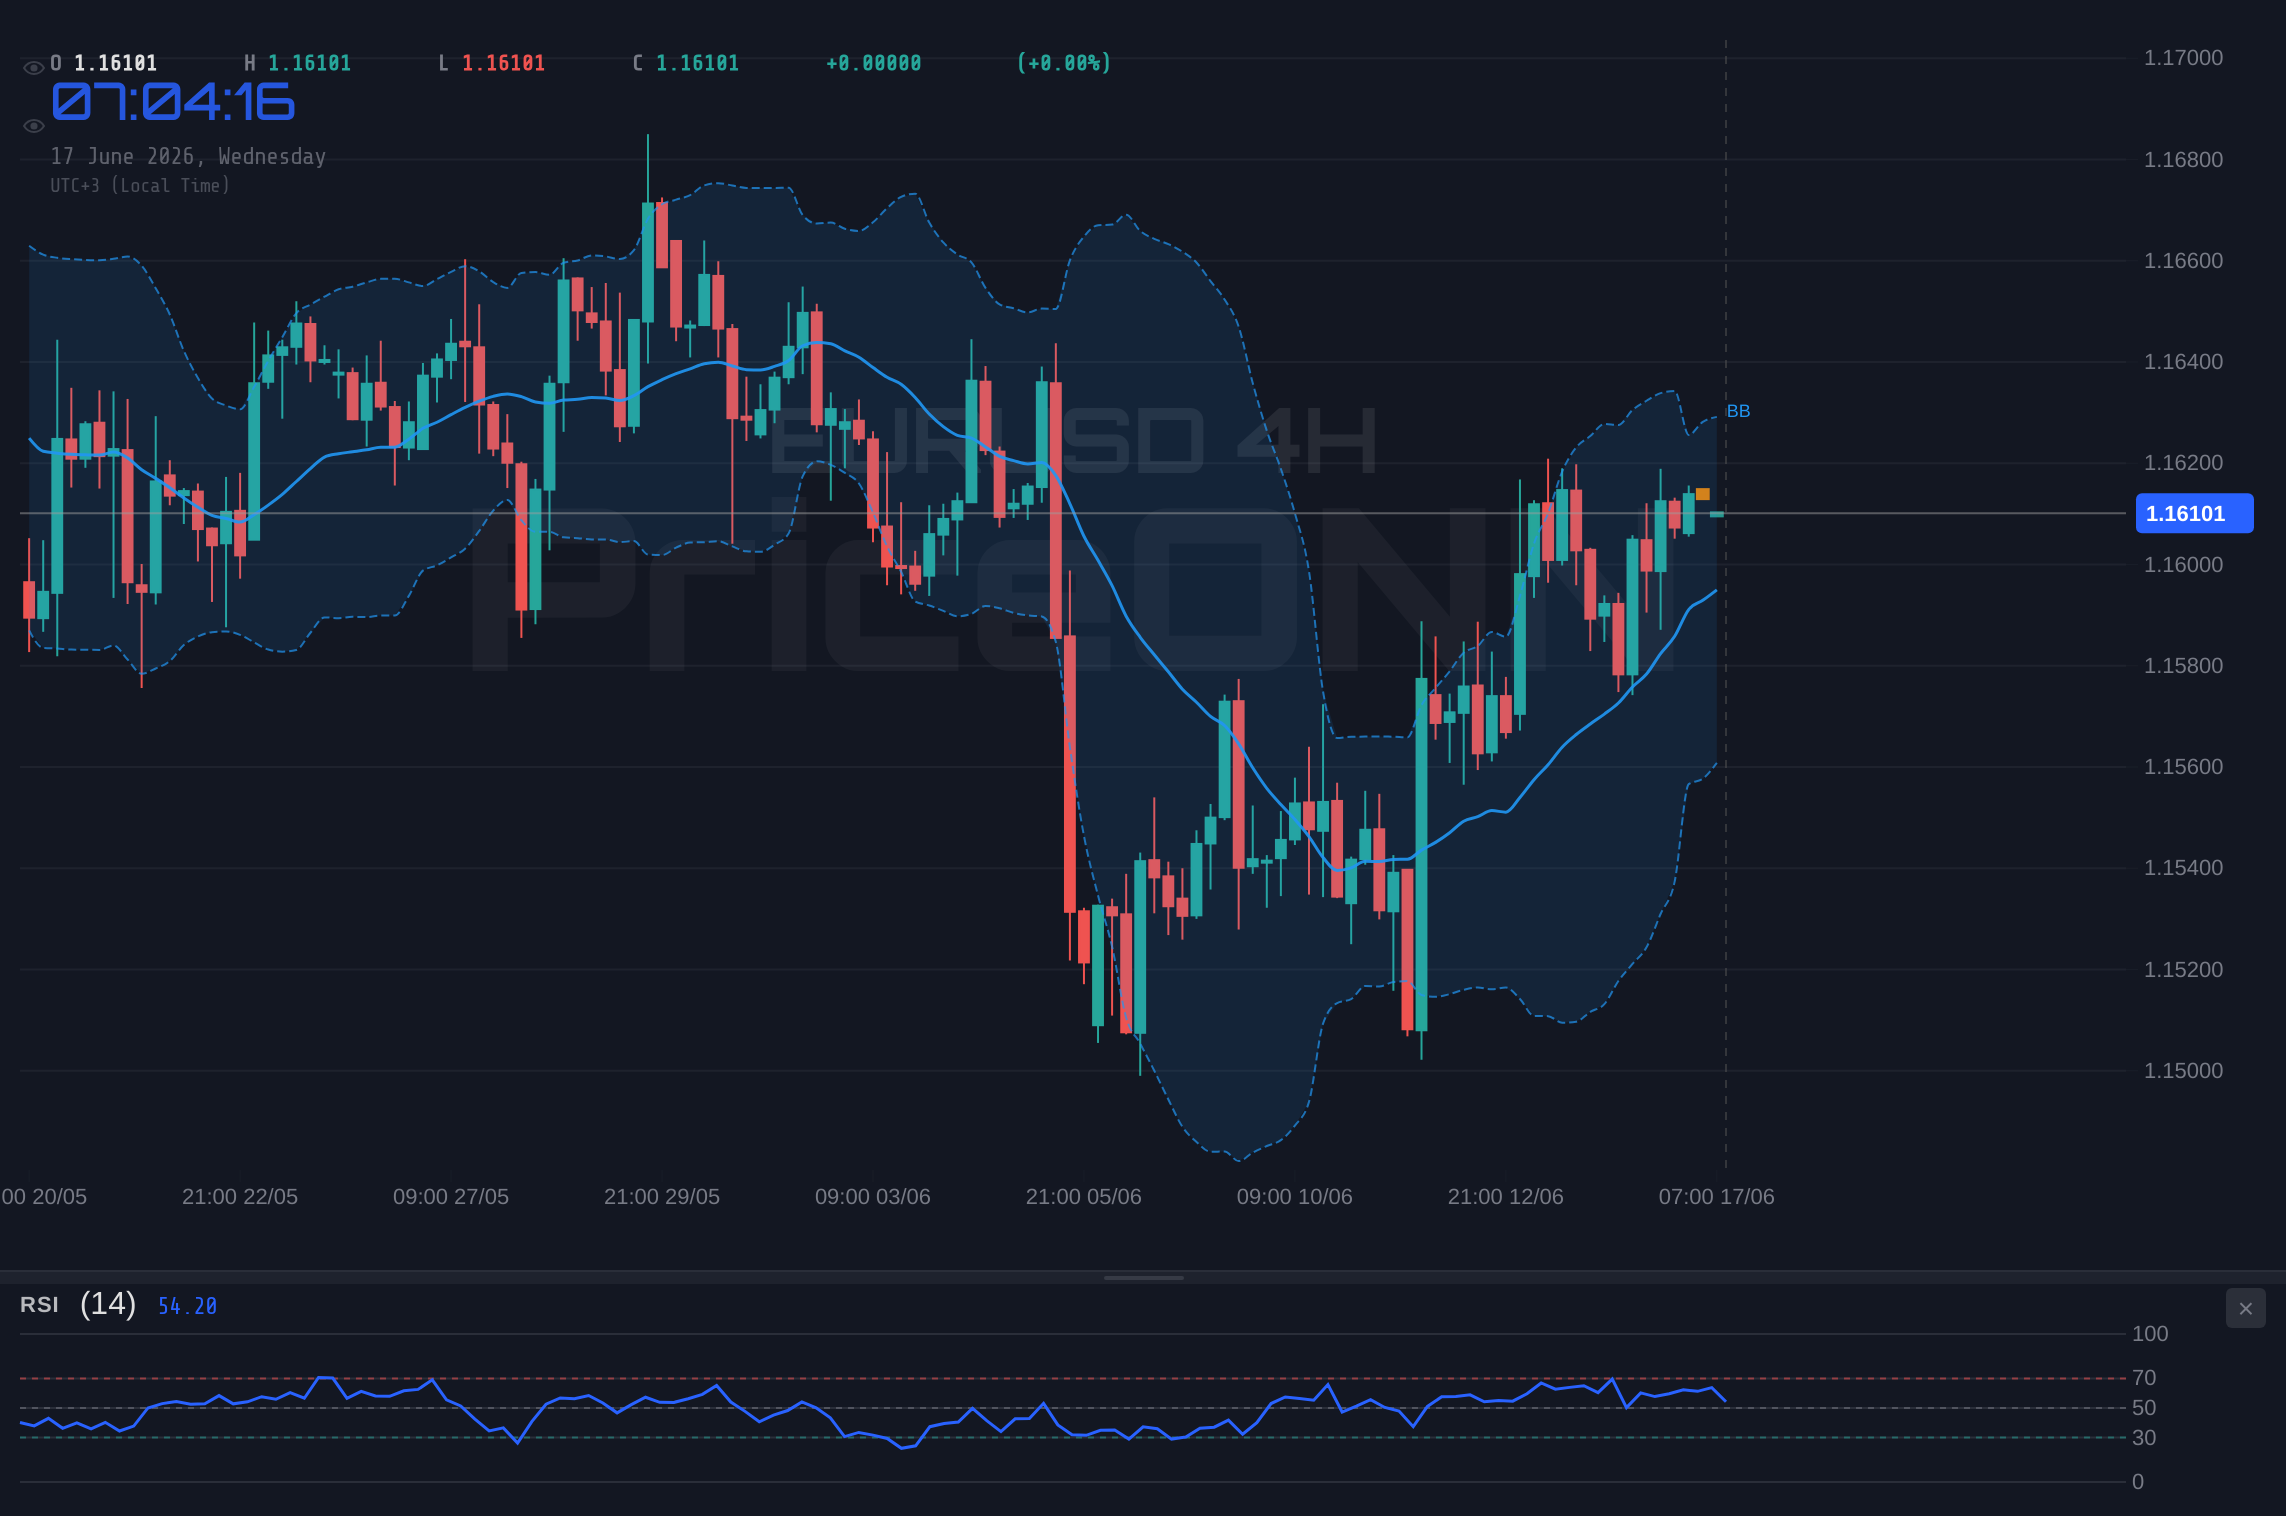
The current trading range is defined by immediate support around $1.16067 and a stubborn resistance level near $1.16124. A decisive break above this resistance could open the door for further upside, but the prevailing market conditions suggest such a move might be short-lived without broader confirmation. Conversely, a failure to hold the support levels, particularly the 1-hour support at $1.16067, could invite sellers to test lower ground. The ADX indicator, reading 24.02 on the 1-hour chart and 23.13 on the 4-hour chart, confirms this lack of a strong, committed trend, suggesting a period of consolidation is more likely than a sharp directional move in the immediate term.
Global Currents: DXY, Equities, and the Search for Direction
To truly understand EURUSD's predicament, we must look beyond the immediate price action and consider the broader market correlations. The US Dollar Index (DXY) is currently trading at 99.58, showing a slight upward bias. Historically, a strengthening dollar often puts pressure on major currency pairs like EURUSD, as it makes Euro-denominated assets relatively more expensive for dollar holders. This dynamic is a significant headwind for any sustained bullish push in EURUSD. The DXY's own technical picture is mixed, with a neutral 1-hour trend and a generally neutral daily outlook, but its current level is acting as a subtle brake on the Euro.
Equities also play a crucial role in risk appetite, which directly influences currency markets. The S&P 500 is showing a strong upward trend on the 1-hour chart (100% strength) at 6572.87, but its daily trend is bearish with a 100% strength rating. This suggests underlying volatility and potential for shifts in sentiment. A risk-on environment, often signaled by rising stock markets, typically supports currencies like the Euro. However, the conflicting signals between the short-term bullishness and the longer-term bearish outlook in equities create uncertainty. If risk appetite falters, we could see a flight to safety, which would likely benefit the dollar and weigh on EURUSD.
The recent news flow, particularly the tentative US-Iran interim agreement mentioned in market reports, initially triggered a risk-on rally that briefly lifted Nasdaq futures. However, the subsequent price action suggests this sentiment may be fading or at least being cautiously reassessed by the market. The narrative around falling oil prices, a potential tailwind for global stock markets according to some analysts, also adds another layer of complexity. Lower oil prices can ease inflationary pressures, potentially influencing central bank policy expectations, which in turn impacts currency valuations. For EURUSD, this complex interplay means that a clear directional bias is difficult to establish without more concrete economic data or geopolitical clarity.
The Technical Crossroads: Indicators Paint a Mixed Picture
Diving deeper into the technical indicators for EURUSD reveals the extent of the current market indecision. On the 1-hour chart, the Stochastic Oscillator is showing a potential dip, with its %K line at 46.03 falling below the %D line at 58.51, suggesting a possible short-term pullback. This aligns with the RSI sitting in neutral territory at 54.98, not yet indicating extreme conditions but showing a slight loss of upward momentum. The Bollinger Bands are trading above the middle band, hinting at some upward pressure, but the overall ADX of 24.02 on this timeframe points to a moderate, not strong, trend.
The 4-hour timeframe offers a slightly more optimistic view, with an RSI of 58.48 and MACD showing positive momentum. The Stochastic %K line at 45.81 is below the %D line at 67.27, which is a bearish signal on this timeframe, creating a conflict with the RSI and MACD. This indicator conflict is a classic sign of consolidation. The ADX at 23.13 reinforces the idea of a moderate trend, not a strong one. This is where traders often find themselves looking for confirmation: a sustained move above the 4-hour resistance at $1.1612, coupled with stronger volume and perhaps a bullish crossover on the Stochastic, would be needed to confirm a genuine upward move.
On the daily chart, the picture becomes even more neutral. The RSI is at 49.61, almost perfectly balanced between bullish and bearish territory. The MACD is positive but showing signs of flattening momentum. The Stochastic oscillator, with %K at 71.05 and %D at 44.78, is in bullish territory but showing a divergence that could suggest a reversal is possible if the price fails to advance. The ADX at 20.14 indicates a weak trend, reinforcing the notion that the longer-term picture is one of equilibrium rather than a clear direction. This daily chart neutrality is a significant factor capping any aggressive upside attempts.
Scenario Planning: Navigating the $1.16 Stalemate
The Bullish Case: Breaking the Chains
15% ProbabilityThe Sideways Shuffle: Consolidation Continues
65% ProbabilityThe Bearish Reversal: Testing Lower Ground
20% ProbabilityWhat's Most Likely? The Waiting Game
Given the current technical landscape, the most probable scenario for EURUSD in the short to medium term is continued consolidation. The confluence of mixed signals across timeframes, a neutral daily trend, and the proximity to key resistance levels at $1.1612 suggests that neither the bulls nor the bears have a clear upper hand right now. The ADX values hovering around 20-24 on the 1-hour and 4-hour charts further support the idea of a market in search of direction, rather than one committed to a strong trend. The DXY's current positioning around 99.58 also acts as a dampener on significant Euro gains. Therefore, the 65% probability assigned to the neutral scenario reflects the current equilibrium, where price is likely to oscillate within a defined range.
However, this doesn't mean the pair is destined to remain range-bound indefinitely. The conditions are ripe for a potential breakout, driven by either a strong economic data release or a significant geopolitical event. The bullish scenario, while carrying a lower probability (15%), is contingent on a decisive break above $1.1612, supported by increasing volume and positive divergences across indicators. Conversely, the bearish scenario (20% probability) becomes more likely if key support levels around $1.1600-$1.16039 falter, especially if accompanied by a drop in global risk appetite or a stronger-than-expected dollar.
What I'm Watching: Key Catalysts for EURUSD
For traders and investors monitoring EURUSD, the next few days will be critical. The primary focus will be on the ability of the price to decisively break through the $1.1612 resistance. A sustained move above this level, confirmed by higher trading volumes and supportive technical signals on the daily chart, could signal the start of a new upward trend targeting $1.16261 and beyond. Conversely, a failure to overcome this resistance, coupled with a close below $1.1600, would likely signal a continuation of the bearish pressure, with $1.15958 and potentially $1.15554 coming into play.
Economic data releases will be the key drivers that could force a resolution to this current stalemate. Any significant deviations in upcoming US Non-Farm Payrolls (NFP) data, inflation figures (CPI), or manufacturing indices (PMI) could significantly sway market sentiment and provide the catalyst for a directional move. Similarly, any major developments from the European Central Bank (ECB) or Federal Reserve (Fed) regarding future monetary policy will be closely watched. Traders should pay particular attention to any shifts in the DXY's trajectory, as its movement often dictates the broader risk sentiment impacting EURUSD. The market is currently poised for a move, but it awaits a clear signal.
Frequently Asked Questions: EURUSD Analysis
What happens if EURUSD breaks above the $1.1612 resistance level?
A sustained break above $1.1612, confirmed by increased volume, would invalidate the current consolidation phase and could target the next resistance levels at $1.16261 and potentially $1.16448. This would signal a shift towards a more bullish short-term outlook for the pair.
Should I trade EURUSD at current levels around $1.16 given the mixed signals?
Trading EURUSD at $1.16 requires caution due to conflicting signals. A high-probability trade setup would involve waiting for a clear break of either the $1.1612 resistance or the $1.1600 support, with confirmation from other indicators like RSI or MACD divergence.
Is the RSI at 49.61 on the daily chart a sell signal for EURUSD?
An RSI of 49.61 on the daily chart is considered neutral territory, not a direct sell signal. It indicates a lack of strong momentum in either direction. However, a move below 50 would lean towards bearish sentiment, especially if confirmed by price action breaking key support levels.
How will upcoming US economic data affect EURUSD this week?
Stronger-than-expected US data, such as Non-Farm Payrolls or inflation reports, could boost the dollar and pressure EURUSD downwards, potentially testing support at $1.15958. Conversely, weaker data might weaken the dollar and allow EURUSD to target resistance near $1.1612 or higher.
Technical Outlook Summary
| Indicator | Value | Signal | Interpretation |
|---|---|---|---|
| RSI (14) | 49.61 | Neutral | Balanced momentum, slight bearish lean on daily. |
| MACD Histogram | 0.00002 | Neutral | Flat momentum, indicating consolidation. |
| Stochastic | K=71.05, D=44.78 | Bullish | Bullish crossover, but in overbought territory for %K. |
| ADX | 20.14 | Neutral | Weak trend strength, indicating range-bound conditions. |
| Bollinger Bands | Middle Band | Watch | Price hovering around the middle band, awaiting direction. |
Key Levels
Support Levels
Resistance Levels
Track markets in real-time
AI-powered analysis, technical indicators and real-time price data.
Join Our Telegram Channel
Breaking market news, AI analysis and trading signals instantly.
Join Channel