The global energy landscape is in constant flux, and Brent crude oil, a key benchmark, is currently navigating a period of significant pressure. Trading at $80.26, the commodity has recently tested critical support levels, notably approaching the $83.4 mark. This movement is not occurring in a vacuum; it's deeply intertwined with broader macroeconomic shifts, including a strengthening US Dollar (DXY) and a palpable dip in global risk appetite. Understanding these cross-market dynamics is crucial for deciphering Brent’s immediate trajectory and its implications for inflation and industrial activity worldwide.
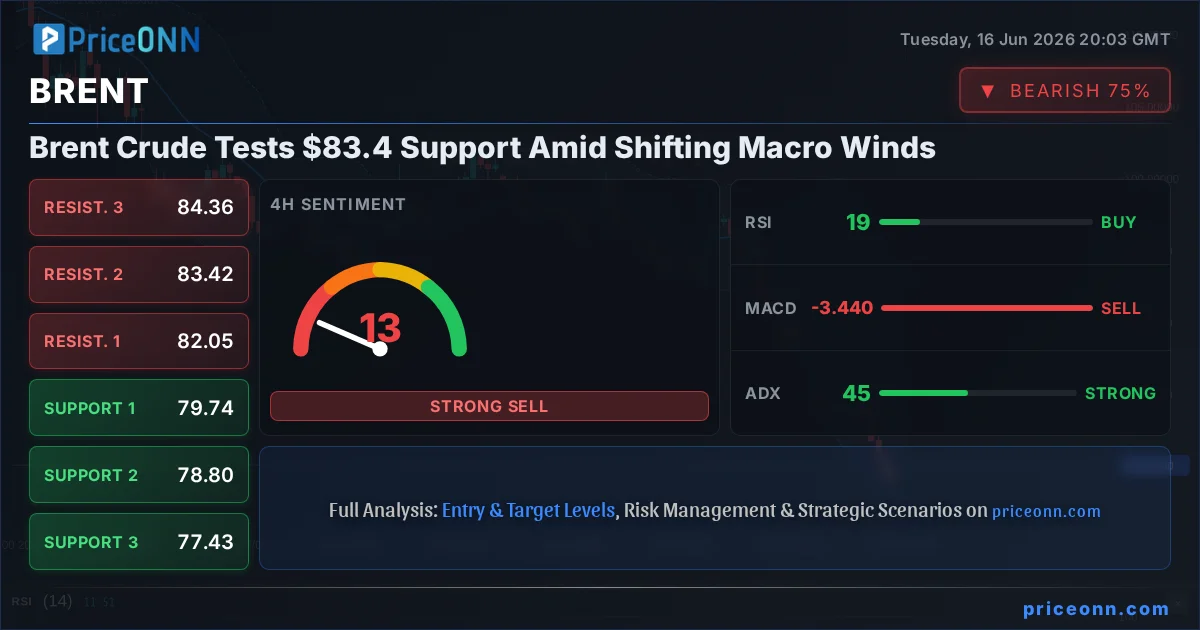
- Brent Crude is trading at $80.26, having tested support at $83.4.
- The US Dollar Index (DXY) is currently at 99.6, influencing commodity prices.
- Technical indicators show a strong downtrend on the daily chart, with RSI at 28.21 indicating oversold conditions.
- Geopolitical developments and shifting central bank expectations are key drivers impacting Brent's correlation with risk assets.
The recent price action in Brent crude oil, falling to $80.26 and challenging the $83.4 support, underscores a complex interplay of factors. On the 1-day timeframe, Brent exhibits a strong downtrend with an ADX of 20.92, indicating a robust trend is in play. However, the RSI(14) stands at a mere 28.21, firmly within oversold territory. This divergence between a strong trend and an oversold condition presents a critical juncture for traders and analysts. Historically, such readings can precede sharp reversals, but only if accompanied by a shift in underlying fundamentals or a change in market sentiment. The current environment, marked by a firmer DXY and a general retreat from riskier assets, is not typically conducive to a commodities rally, suggesting that the pressure on Brent may persist unless significant catalysts emerge.
Macroeconomic Currents Shaping Energy Markets
The Dollar's Dominance and Risk Sentiment
The US Dollar Index (DXY), currently hovering around 99.6, plays a pivotal role in the pricing of commodities like Brent crude. When the dollar strengthens, as it has been doing recently, dollar-denominated assets, including oil, tend to become more expensive for holders of other currencies. This can dampen demand and put downward pressure on prices. The DXY's current reading of 99.6 on the 1D timeframe, despite showing a generally neutral trend (ADX: 27.05), is demonstrating upward momentum. This is often seen as a risk-off signal, where investors flock to the perceived safety of the US dollar, pulling capital away from more volatile markets such as commodities and equities. The S&P 500, trading at 6572.87 and showing a strong 1-hour uptrend (ADX: 49.72) but a daily downtrend (ADX: 47.51), reflects this mixed risk appetite. A sustained dip in major equity indices like the S&P 500 and Nasdaq 100 would typically reinforce the bearish sentiment for oil, as it signals a potential slowdown in economic activity and thus, reduced energy demand.
Central Bank Watch and Inflationary Pressures
The Federal Reserve's monetary policy stance remains a significant overhang for all risk assets, including oil. While the immediate focus is on the current price action, the market is keenly awaiting signals regarding future interest rate decisions. Any indication of a more hawkish tone from the Fed could further strengthen the dollar and increase the cost of borrowing, potentially acting as a drag on economic growth and oil demand. Conversely, signs of a dovish pivot or a pause in rate hikes could offer some respite. The relationship between oil prices and inflation is symbiotic. A sharp decline in oil prices, as we've seen recently with Brent falling significantly, can help alleviate inflationary pressures, giving central banks more room to maneuver. However, the rapid decline itself can also signal concerns about global demand, creating a complex feedback loop. The fact that Brent has fallen so sharply, impacting India's trade deficit according to recent reports, highlights how sensitive energy prices are to these global economic undercurrents. The falling oil prices could ease pressure on India's trade deficit, a positive development for its economy, but it also points to weakening global demand.
Technical Breakdown: Brent Crude's Pressure Points
1-Hour and 4-Hour Chart Signals
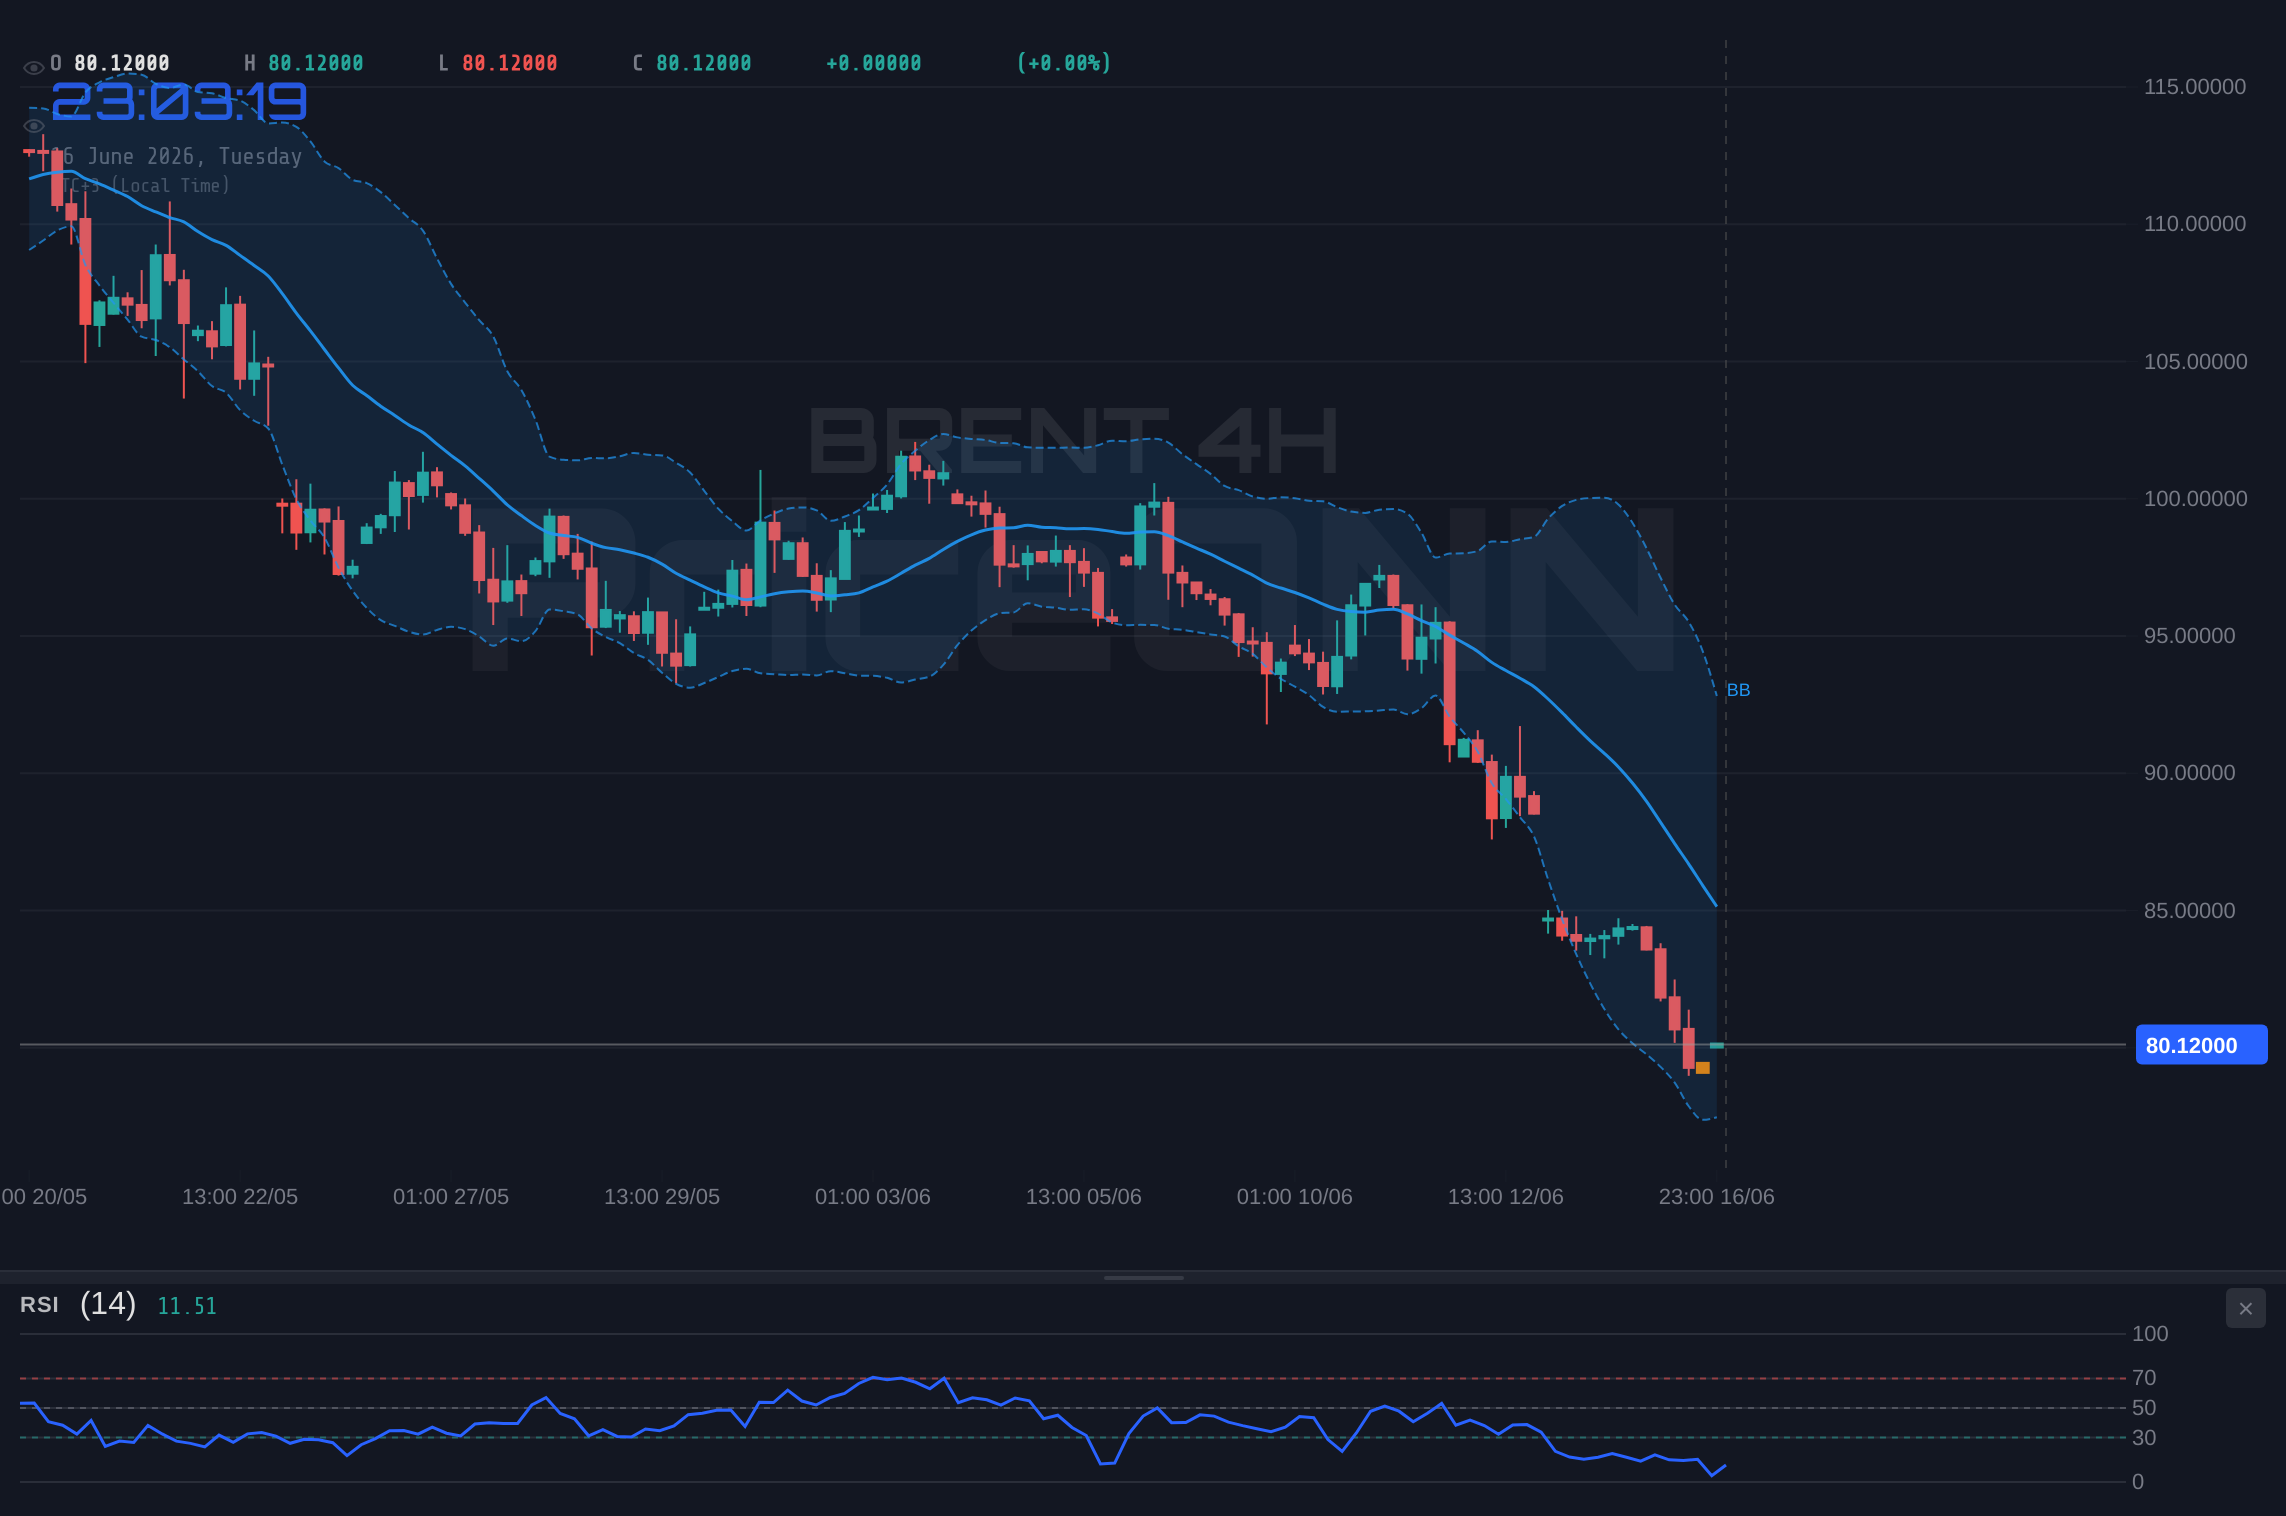
Zooming into the shorter timeframes, the 1-hour chart for Brent crude presents a strong downtrend (Trend Strength: 100%, ADX: 54.24). Despite the strong trend, the RSI(14) is at 32.1, suggesting oversold conditions are developing, while the Stochastic (%K=27.28, %D=15.16) signals a potential upward move with %K crossing above %D. The MACD is in negative territory, below its signal line, confirming the bearish momentum. The Bollinger Bands are trading below the middle band, reinforcing the downtrend. The overall signal on this timeframe is SAT (Sell: 7, Buy: 1, Neutral: 0), reflecting the dominant bearish sentiment. On the 4-hour chart, the trend remains firmly bearish (Trend Strength: 100%, ADX: 45.21), albeit with a slightly less extreme ADX value. Here, the RSI(14) plunges to 19.16, indicating extreme oversold conditions. The Stochastic is also in oversold territory (%K=12.11, %D=9.78), showing a potential for a bounce. The MACD remains negative. The overall signal here is also SAT (Sell: 6, Buy: 2, Neutral: 0). These shorter timeframes paint a picture of a market under significant selling pressure, with oversold indicators hinting at a potential short-term relief rally, but not yet a sustainable trend reversal.
Daily Chart Perspective: The Big Picture
The daily chart provides the overarching trend for Brent crude. It confirms a strong downtrend (Trend Strength: 95%, ADX: 20.92), but crucially, the RSI(14) is at 28.21. This level is historically significant, often acting as a floor before a potential reversal. The Stochastic oscillator is also deeply oversold, with K=6.06 and D=20.51, showing a bearish signal as %K
Geopolitical Crosscurrents and Market Sentiment
The Impact of Middle East Tensions and Agreements
Recent news flow has been dominated by developments in the Middle East, which directly impact oil prices. Reports of a tentative U.S.-Iran interim agreement, even if temporary, have injected a degree of easing in geopolitical risk premiums. The successful passage of the first LNG tanker through the Strait of Hormuz after the announcement of this deal is a significant event. This suggests a potential, albeit fragile, de-escalation in regional tensions. Historically, heightened tensions in the Strait of Hormuz have led to sharp spikes in oil prices due to fears of supply disruptions. The current easing, however, is contributing to the downward pressure on Brent. While this might be a tailwind for global stock markets, as JP Morgan noted, providing a broader equity rally, it simultaneously removes a key bullish driver for oil prices. The market seems to be pricing in a reduced risk of immediate supply shocks, allowing other bearish factors, such as demand concerns, to take center stage.
Production Dynamics and OPEC+'s Role
Beyond immediate geopolitical events, the fundamental supply picture remains critical. While the market is reacting to perceived geopolitical easing, the underlying production dynamics set by OPEC+ and other major producers continue to influence supply levels. Any indication of increased production from these blocs could further exacerbate the downward pressure on prices, especially if global demand remains sluggish. Conversely, any signs of renewed supply discipline or unexpected production outages would be crucial for supporting prices. The market’s reaction to falling oil prices, such as easing pressure on India’s trade deficit, also hints at a global economy that might be slowing down, which would naturally curb demand for energy. This makes OPEC+'s upcoming decisions on production quotas even more consequential. The cartel’s ability to manage supply in response to weakening demand will be a key factor in determining whether the current downtrend in Brent is merely a correction or the start of a more prolonged bear market.
Trade Scenarios and Risk Management
Navigating the Current Volatility
The current technical and fundamental picture for Brent crude presents a challenging but potentially rewarding environment for traders. The strong downtrend on daily charts, coupled with extreme oversold conditions on shorter timeframes, suggests that a bounce is technically plausible. However, the overarching macroeconomic backdrop, characterized by a strong dollar and potential demand concerns, acts as a significant headwind. Therefore, a multi-faceted approach is warranted, focusing on risk management and waiting for clear confirmation signals.
Bearish Scenario: Continued Downtrend
65% ProbabilityConsolidation Scenario: Sideways Action
25% ProbabilityBullish Scenario: Short-Term Bounce
10% ProbabilityRisk Management is Paramount
Given the conflicting signals - a strong daily downtrend versus oversold oscillators on shorter timeframes, and geopolitical easing versus potential demand concerns - caution is paramount. Traders should consider the risk/reward ratio of any trade. For those looking to capitalize on a potential bounce, tight stop-losses below the $80.18 support would be essential. A break below this level could trigger further downside, potentially targeting $79.03 (S2) and then $78.21 (S3). For a bullish reversal scenario to gain traction, Brent would need to decisively break above the $83.4 resistance, ideally followed by a close above $85.16. The current market environment, with ADX at 20.92 on the daily chart indicating a strong trend, suggests that any bounce might be a retracement within a larger downtrend, rather than the start of a new bull cycle. Therefore, patience and a disciplined approach to risk management are crucial. The market always offers second chances, and waiting for clearer signals or more favorable risk/reward setups is often the wisest strategy.
Frequently Asked Questions: BRENT Analysis
What happens if BRENT breaks below the $80.18 support level?
If Brent crude closes decisively below the $80.18 support, it would confirm the continuation of the strong daily downtrend. This could lead to further selling pressure, with the next key levels to watch being $79.03 (Daily S2) and potentially $78.21 (Daily S3), as indicated by the daily support structure.
Is the RSI at 28.21 a buy signal for BRENT right now?
An RSI reading of 28.21 on the daily chart signifies oversold conditions, historically suggesting a potential for a bounce. However, it is not a standalone buy signal, especially with the ADX at 20.92 confirming a strong existing trend. Confirmation from price action, such as holding above $83.4 or breaking key resistance, would be needed for a more reliable bullish signal.
How might the U.S.-Iran agreement impact BRENT prices this week?
The tentative U.S.-Iran agreement has eased geopolitical risk premiums, contributing to the downward pressure on Brent by reducing fears of immediate supply disruptions. This easing could allow bearish demand-side factors to dominate, potentially keeping prices lower unless other supply-side issues emerge or central bank policy shifts significantly.
Should I consider buying BRENT at current levels around $80.26 given the oversold indicators?
While oversold indicators suggest a potential bounce, the strong daily downtrend and macroeconomic headwinds warrant caution. A high-risk strategy might involve a small long position with a very tight stop-loss below $80.18, targeting a move towards $83.4. However, a more prudent approach would be to wait for confirmation of a trend reversal or a more favorable risk/reward setup, possibly above $85.16 resistance.
The Road Ahead: Monitoring Key Catalysts
Looking forward, several factors will be critical in shaping Brent crude's trajectory. The ongoing geopolitical situation in the Middle East, despite recent de-escalation signs, remains a volatile element that could quickly shift market sentiment and supply expectations. Investors will also be closely watching OPEC+'s future production decisions; any deviation from current supply management could have significant price implications. Furthermore, the global macroeconomic outlook, particularly concerning demand growth and central bank policies, will continue to exert influence. The correlation between oil prices and risk assets like equities, as well as the trajectory of the US Dollar, will provide ongoing clues about market sentiment. For traders, monitoring the $80.18 support and the $83.4 resistance levels on Brent will be paramount. A decisive break below $80.18 could signal further downside, while a sustained hold above $83.4, coupled with a break of higher resistance levels, might indicate the beginning of a recovery. The market is at a critical juncture, and disciplined analysis of both technical signals and fundamental drivers will be key to navigating the coming weeks.
Track markets in real-time
AI-powered analysis, technical indicators and real-time price data.
Join Our Telegram Channel
Breaking market news, AI analysis and trading signals instantly.
Join Channel