The energy markets are in flux, and crude oil, specifically West Texas Intermediate (WTI), is currently presenting a complex picture around the $81.09 mark. This price point is not just a random figure; it represents a critical juncture where recent price action, technical indicators, and broader market correlations are converging. As traders and analysts eye this level, the question isn't just whether support will hold, but what the underlying signals are telling us about the potential direction of oil prices in the short to medium term. My analysis today focuses on dissecting these signals, moving beyond the headline price to understand the mechanics driving WTI's current behavior.
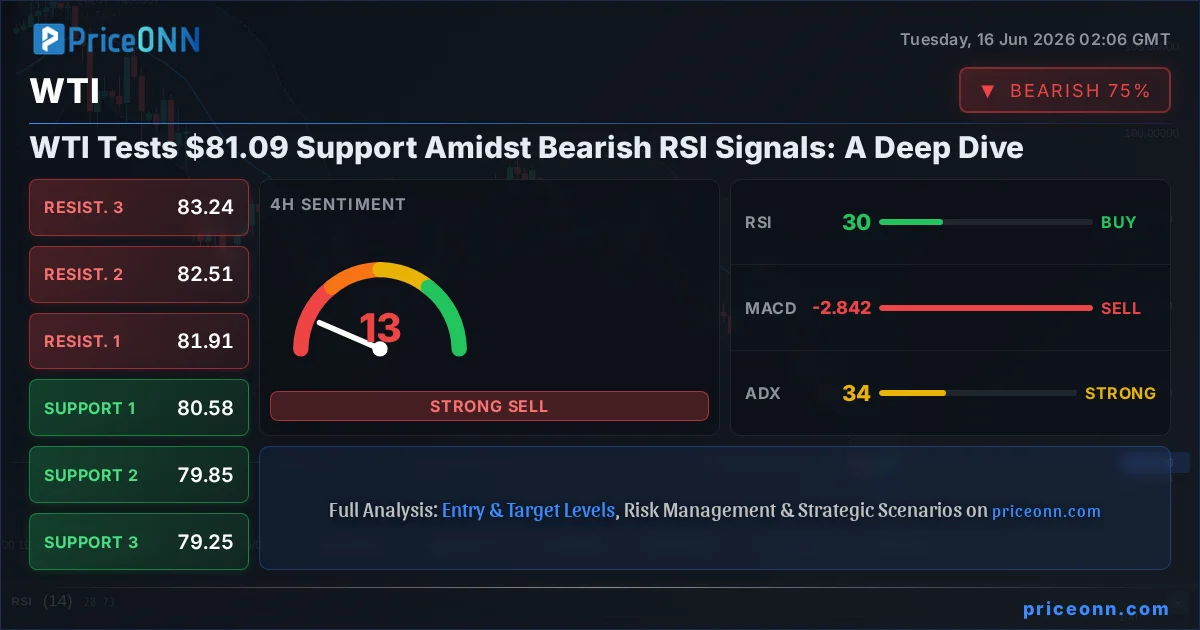
- WTI crude oil is currently trading at $81.09, a critical support level.
- The 1-hour RSI at 41.61 suggests downward momentum, while the 4-hour RSI at 29.59 indicates oversold conditions, creating divergence.
- The ADX on the 1-hour chart is 32.8, showing a strong downtrend, while the 4-hour ADX at 33.66 confirms this trend strength.
- Recent news about a U.S.-Iran deal impacting Hormuz Strait transit and oil prices adds a geopolitical layer to the analysis.
The juxtaposition of technical signals on WTI is particularly noteworthy. On the 1-hour chart, the Relative Strength Index (RSI) at 41.61 suggests that momentum is leaning towards the downside, but it's not yet in deeply oversold territory. However, zooming out to the 4-hour timeframe, the RSI plummets to 29.59, firmly within the oversold zone. This divergence between timeframes is where the real trading challenge lies - are we seeing exhaustion of sellers on the shorter timeframe, or is the larger trend simply continuing its downward path? The presence of a strong Average Directional Index (ADX) on both the 1-hour (32.8) and 4-hour (33.66) charts indicates that a robust trend is indeed in play. This suggests that while the 4-hour RSI may be oversold, the trend itself remains strong, demanding caution before calling for a sharp reversal.
This technical picture is further complicated by external market forces. The Dollar Index (DXY), currently trading around 99.75, has been showing a mixed but generally stable-to-slightly-upward bias on the 1-hour and 4-hour charts, which typically exerts downward pressure on commodities priced in dollars, like WTI. Conversely, the broader risk sentiment, as indicated by the S&P 500 (6572.87) and Nasdaq 100 (30457.58) trading higher, suggests a degree of risk appetite in the market. This risk-on environment could, in theory, provide some support for oil prices, as it often correlates with increased industrial demand. However, the sharp daily drop in WTI (-4.33%) and Brent (-4.94%) prices yesterday, coupled with the news of a potential U.S.-Iran deal reopening the Strait of Hormuz, points towards supply-side factors overriding general risk sentiment for now. This geopolitical development, reported by sources like ForexLive, could be the dominant driver, injecting significant bearish pressure irrespective of broader market trends.
Navigating the Technical Landscape: Indicators in Focus
The RSI Conundrum: Oversold or Overextended?
The RSI is a critical tool for gauging momentum, and its readings for WTI at $81.09 present a classic dilemma. On the 1-hour chart, the RSI at 41.61 is hovering in neutral territory, leaning towards bearish but far from indicating panic selling. This suggests that intraday traders might be observing a slight pullback rather than a collapse. However, the 4-hour RSI reading of 29.59 is a stark contrast. An RSI below 30 is traditionally considered oversold, often signaling a potential bounce or reversal as the asset becomes cheaper relative to its recent trading range. This discrepancy is key: the short-term outlook might show continued weakness, but the medium-term view suggests that prices have fallen perhaps too far, too fast. Traders often look for confirmation, such as a break of a short-term trendline or a subsequent bullish candle pattern, before acting on such oversold signals, especially when a strong trend is present on higher timeframes.
MACD and Stochastic: Confirming the Downtrend
Complementing the RSI, the Moving Average Convergence Divergence (MACD) and Stochastic Oscillator provide further clues. On the 1-hour chart, the MACD histogram is negative, indicating bearish momentum, and it sits below the signal line, reinforcing the short-term downtrend. The Stochastic Oscillator, with %K at 72.89 and %D at 81.36, is in the overbought zone but showing a bearish crossover (%K %D). This again highlights the conflict: short-term bearish momentum is clear, but the longer-term oscillator is flashing an oversold signal. The strength of the trend, as indicated by the ADX, becomes paramount in resolving such conflicts.
ADX and Bollinger Bands: Trend Strength and Volatility
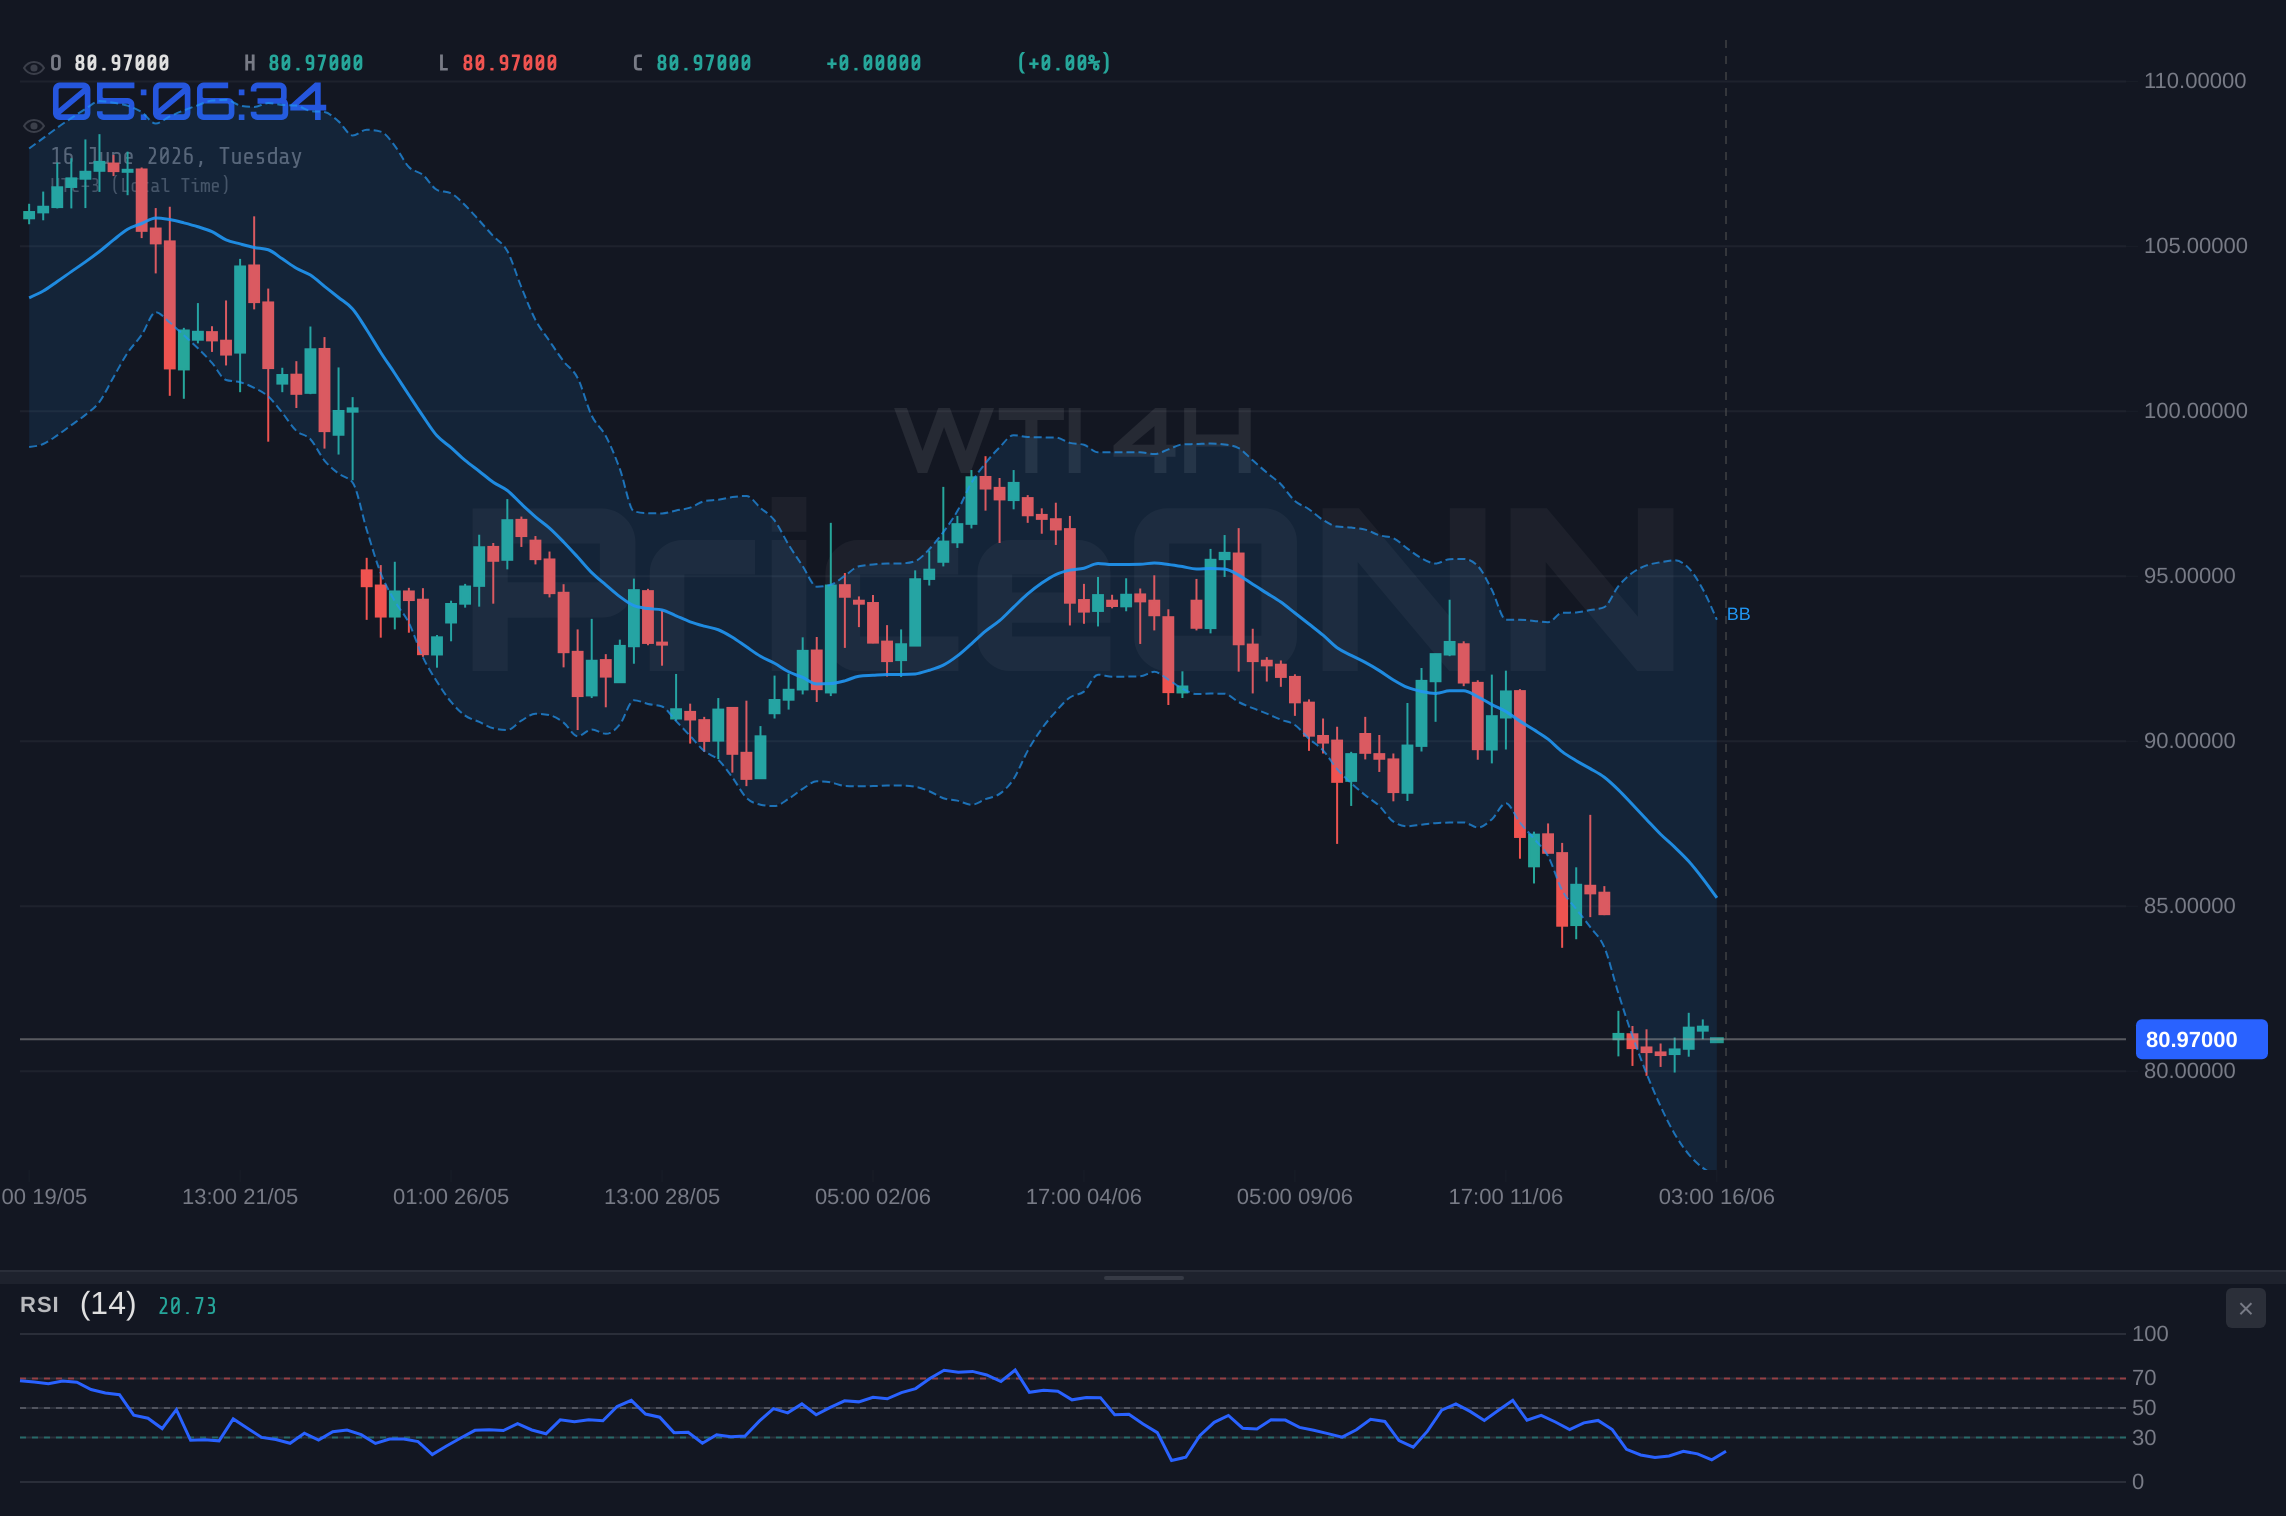
The ADX provides a measure of trend strength, irrespective of direction. With readings of 32.8 on the 1-hour and 33.66 on the 4-hour chart, it's clear that WTI is not trading in a choppy, directionless market. An ADX above 25 generally signifies a strong trend. This means that any oversold signals from the Stochastic or even the 4-hour RSI should be treated with extreme caution. The market is trending downwards, and these signals might simply indicate temporary pauses within that larger move. The Bollinger Bands offer insights into volatility and price boundaries. On the 1-hour chart, WTI is trading above the middle band, which might seem counterintuitive given the bearish MACD and RSI. However, the band itself is widening slightly, suggesting increasing volatility. On the 4-hour chart, WTI is trading below the middle band and approaching the lower band, indicating that price action is currently favoring the downside and potentially entering an oversold condition relative to the band's width. This reinforces the idea that while a bounce is possible, the underlying trend remains the dominant force.
Cross-Market Correlations and Geopolitical Undercurrents
The Dollar's Shadow: DXY Influence
The relationship between crude oil prices and the U.S. Dollar Index (DXY) is a crucial element in understanding WTI's movements. A stronger dollar generally makes oil more expensive for holders of other currencies, potentially dampening demand and putting downward pressure on prices. Conversely, a weaker dollar can have the opposite effect, often supporting oil prices. Currently, the DXY is trading around 99.75. On the 1-hour and 4-hour charts, the DXY shows a mixed but leaning-upward momentum, with the 1-hour RSI at 59.63 and the 4-hour RSI at 53.76. This suggests that the dollar is not significantly weakening, which removes a potential tailwind for WTI. If the dollar were to show a decisive move lower, it could provide some relief to oil prices, but as it stands, the dollar's current posture is unlikely to be a major bullish catalyst for WTI. The strong ADX on the 1D chart for DXY (26.84) indicates a firm underlying trend, which means its influence on WTI should not be underestimated.
Equities and Risk Sentiment: A Divergent Signal
The performance of major U.S. stock indices like the S&P 500 (6572.87) and Nasdaq 100 (30457.58) offers a contrasting perspective. Both indices are showing strong upward momentum on the day, indicating a general 'risk-on' sentiment in the broader market. Typically, a risk-on environment, characterized by rising equities, can correlate with increased demand for industrial commodities like oil, as it suggests economic expansion and higher consumption. However, WTI's significant daily drop of -4.33% yesterday, despite this risk-on backdrop, highlights that other factors are currently exerting more influence. The news regarding a potential U.S.-Iran deal and the reopening of the Strait of Hormuz, as reported by outlets like Reuters, appears to be a dominant bearish factor, suggesting that supply-side concerns are temporarily overshadowing demand-side optimism driven by equity markets. This decoupling is a significant signal that market participants are prioritizing geopolitical supply risks.
Geopolitical Shifts: Hormuz Deal and Supply Outlook
The recent news surrounding a potential U.S.-Iran interim agreement, which could lead to the reopening of the Strait of Hormuz, is a pivotal development for the oil market. The Strait of Hormuz is a critical chokepoint for global oil supply, with a significant percentage of the world's oil passing through it daily. Any disruption or, conversely, any assurance of passage, can have immediate and substantial impacts on crude prices. The announcement, even if preliminary, has clearly injected bearish sentiment into the market, contributing to the sharp sell-off seen in WTI and Brent. The fact that an LNG carrier successfully passed through the Strait on Monday, as reported, further reinforces the notion that supply concerns are easing. This development directly challenges the upward price pressures that might have otherwise been supported by a risk-on environment or inflation concerns. For WTI traders, monitoring the details and confirmation of this deal will be paramount in the coming days.
Trade Scenarios and Risk Management
Given the conflicting signals - a strong downtrend indicated by ADX and MACD, yet oversold conditions on the 4-hour RSI and Stochastic, coupled with a significant geopolitical development - a cautious approach is warranted. The current price of $81.09 for WTI sits at a pivotal support level. The market is at a crossroads, and understanding the potential paths forward is crucial for risk management.
Bearish Scenario: Downtrend Resumes
65% ProbabilityNeutral Scenario: Consolidation Around $81.09
25% ProbabilityBullish Scenario: Oversold Bounce
10% ProbabilityManaging Risk in Volatile Conditions
The ADX at 33.66 on the 4-hour chart strongly suggests that we are in a trending market, making a bounce from oversold conditions less probable without significant confirmation. The primary scenario, therefore, leans towards the bearish side. If WTI closes below the $81.09 support, the next immediate levels to watch are the 1-hour support at $80.93 and the more significant 4-hour support at $80.58. These levels represent the next logical steps in a continuation of the downtrend, especially if the geopolitical news continues to favor supply increases. The invalidation of this bearish thesis would be a sustained move back above the $81.80 resistance area, which would suggest that the market is already pricing in the supply news and is looking for other catalysts.
A neutral scenario, involving consolidation around the $81.09 level, is also plausible. The market might digest the news and wait for further confirmation or conflicting data. In this case, price action between the immediate support at $80.93 and resistance at $81.51 (1H) could define the short-term trading range. A breakout from this range would then signal the next directional move. For the bullish scenario, which currently has a lower probability given the strong downtrend, confirmation would be essential. This would involve WTI holding firmly above $81.09, perhaps forming a bullish divergence on the 1-hour RSI or a clear reversal candle pattern, followed by a move above the immediate 1-hour resistance at $81.51, with a subsequent test of the $81.91 area.
The key takeaway from the technicals and current news flow is that while oversold conditions are present on the 4-hour chart, the prevailing trend strength and the geopolitical shift towards increased supply suggest that bearish momentum could continue. Risk management is paramount here. Traders should ensure their stop-losses are appropriately placed, respecting the identified support and resistance levels. Aggressive traders might look for a breakdown below $81.09 to enter short positions, targeting $80.93 and then $80.58. More conservative traders might wait for a confirmed break of the immediate range or for clearer signals of trend exhaustion before committing. Patience and discipline will be rewarded as the market navigates these complex dynamics.
Frequently Asked Questions: WTI Analysis
What happens if WTI breaks below the $81.09 support level?
If WTI breaks below $81.09, the bearish scenario becomes more likely, with immediate targets at $80.93 and then $80.58. This would be driven by continued strong downtrend signals and the impact of increased supply.
Should I buy WTI at current levels around $81.09 given the oversold 4-hour RSI?
Buying at current levels is a lower-probability bullish scenario (10%). While the 4-hour RSI is oversold, the strong ADX trend strength suggests caution. Confirmation, such as a hold above $81.09 with a bullish pattern and a move above $81.51 resistance, would be needed.
Is the RSI at 41.61 on the 1-hour chart a sell signal for WTI?
An RSI of 41.61 on the 1-hour chart indicates bearish momentum but is not yet in oversold territory. It suggests that the short-term downtrend is intact, aligning with the overall trend strength shown by the ADX.
How will the U.S.-Iran deal announcement affect WTI prices this week?
The announcement of a potential U.S.-Iran deal and the reopening of the Strait of Hormuz is a significant bearish catalyst, likely to cap upside potential and contribute to downward pressure on WTI prices, overriding general risk-on sentiment.
Technical Outlook Summary
| Indicator | Value | Signal | Interpretation |
|---|---|---|---|
| RSI (14) | 41.61 | Bearish | Downward momentum on 1H, oversold on 4H |
| MACD Histogram | -0.39 | Bearish | Negative momentum confirmed |
| Stochastic (%K/%D) | 72.89/81.36 | Bearish | Overbought on 1H, bearish crossover |
| ADX | 33.66 | Strong Trend | Confirms strong downtrend on 4H |
| Bollinger Bands | Middle Band | Watch | Price below middle band on 4H |
Key Levels
Support Levels
Resistance Levels
Track markets in real-time
AI-powered analysis, technical indicators and real-time price data.
Join Our Telegram Channel
Breaking market news, AI analysis and trading signals instantly.
Join Channel