The energy markets are witnessing a dramatic downturn in crude oil prices, with WTI futures plummeting to $76.51. This sharp decline, representing a significant 5.91% drop from recent highs, is not just a headline grabber; it's a critical juncture that demands close examination from every trader and analyst. Having tracked WTI through periods of intense volatility and geopolitical uncertainty, I see this current price action as a pivotal moment, forcing a re-evaluation of both short-term trading strategies and long-term investment theses. The question on everyone's mind isn't just *if* prices will recover, but *when*, and what the underlying technical and fundamental drivers are signaling right now. The market's reaction to this downward pressure, particularly around the $80 mark and the subsequent test of lower support, offers a compelling narrative that we need to dissect.
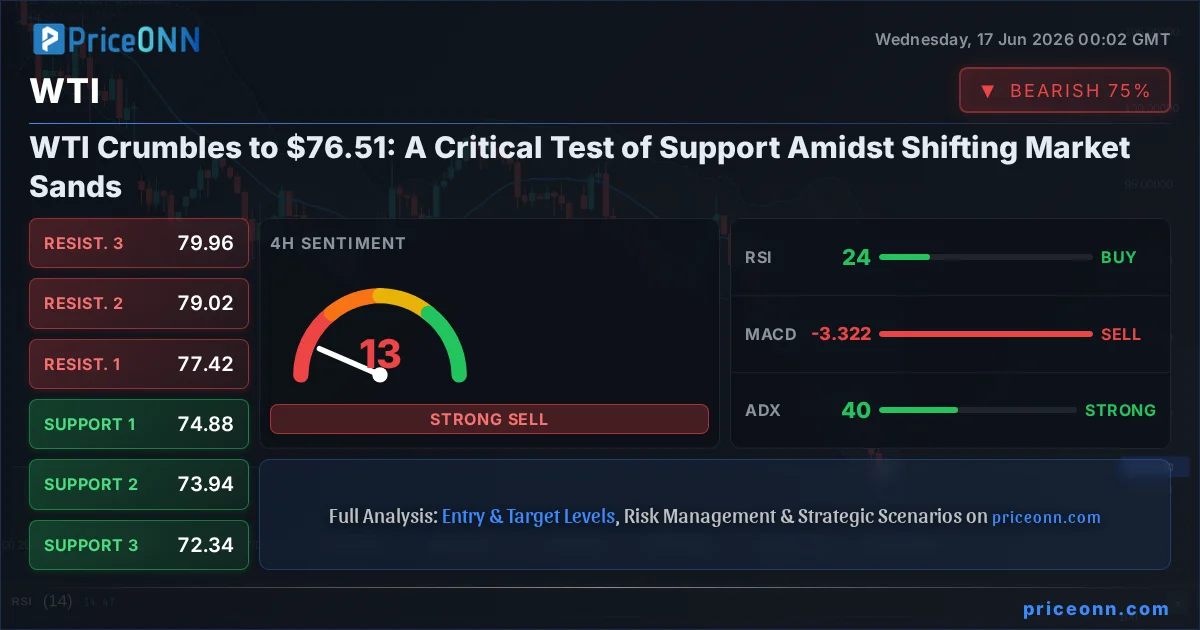
- WTI crude oil has fallen sharply to $76.51, a 5.91% daily decrease, testing critical support.
- The ADX at 51.23 on the 1H chart indicates a very strong downtrend, suggesting further downside is possible.
- Key support levels are identified at $76.31, $76.01, and $75.79, with resistance seen at $76.83, $80.05, and $80.31.
- The RSI at 30.38 on the 1H chart is approaching oversold territory, hinting at a potential short-term bounce, though the overall trend remains bearish.
- Geopolitical factors, such as the tentative U.S.-Iran deal and increased Middle East flows, are contributing to the bearish sentiment, impacting inflation expectations.
The Unraveling of the $80 Barrier
For weeks, the $80 per barrel mark for WTI crude oil had acted as a psychological and technical battleground. Now, that barrier has not only been breached but convincingly broken, with prices accelerating downwards towards $76.51. This rapid descent is a stark reminder of how quickly sentiment can shift in commodity markets, often driven by a confluence of factors including supply dynamics, geopolitical news, and macroeconomic expectations. The daily range of $75.55 to $81.57 illustrates the intraday volatility traders are contending with. The sheer magnitude of the intraday price swing, coupled with the significant daily percentage change of -5.91%, signals that the bears have firmly taken control in the immediate term. Understanding the implications of this breakdown is paramount for anyone exposed to energy markets.
1H Chart: A Bearish Storm Gathering Pace
Looking at the 1-hour chart, the technical indicators paint a grim picture for WTI in the very short term. The trend is unequivocally bearish, with an 87% strength reading, and this is supported by a powerful ADX value of 54.24 on the 1H timeframe, indicating a very strong, albeit potentially overextended, downtrend. The RSI at 29.11 is hovering in oversold territory, typically a precursor to a bounce, but in the context of such a strong trend, it can remain oversold for extended periods. The MACD is firmly below its signal line, confirming negative momentum. While the Bollinger Bands show the price trading below the middle band, suggesting a downward bias, the Stochastic oscillator is actually flashing a bullish divergence (%K crossing above %D), offering a glimmer of hope for a short-term reprieve. However, the overwhelming signal from the 1-hour chart is one of bearish dominance, with key support levels at $76.31, $76.01, and $75.79 now in focus.
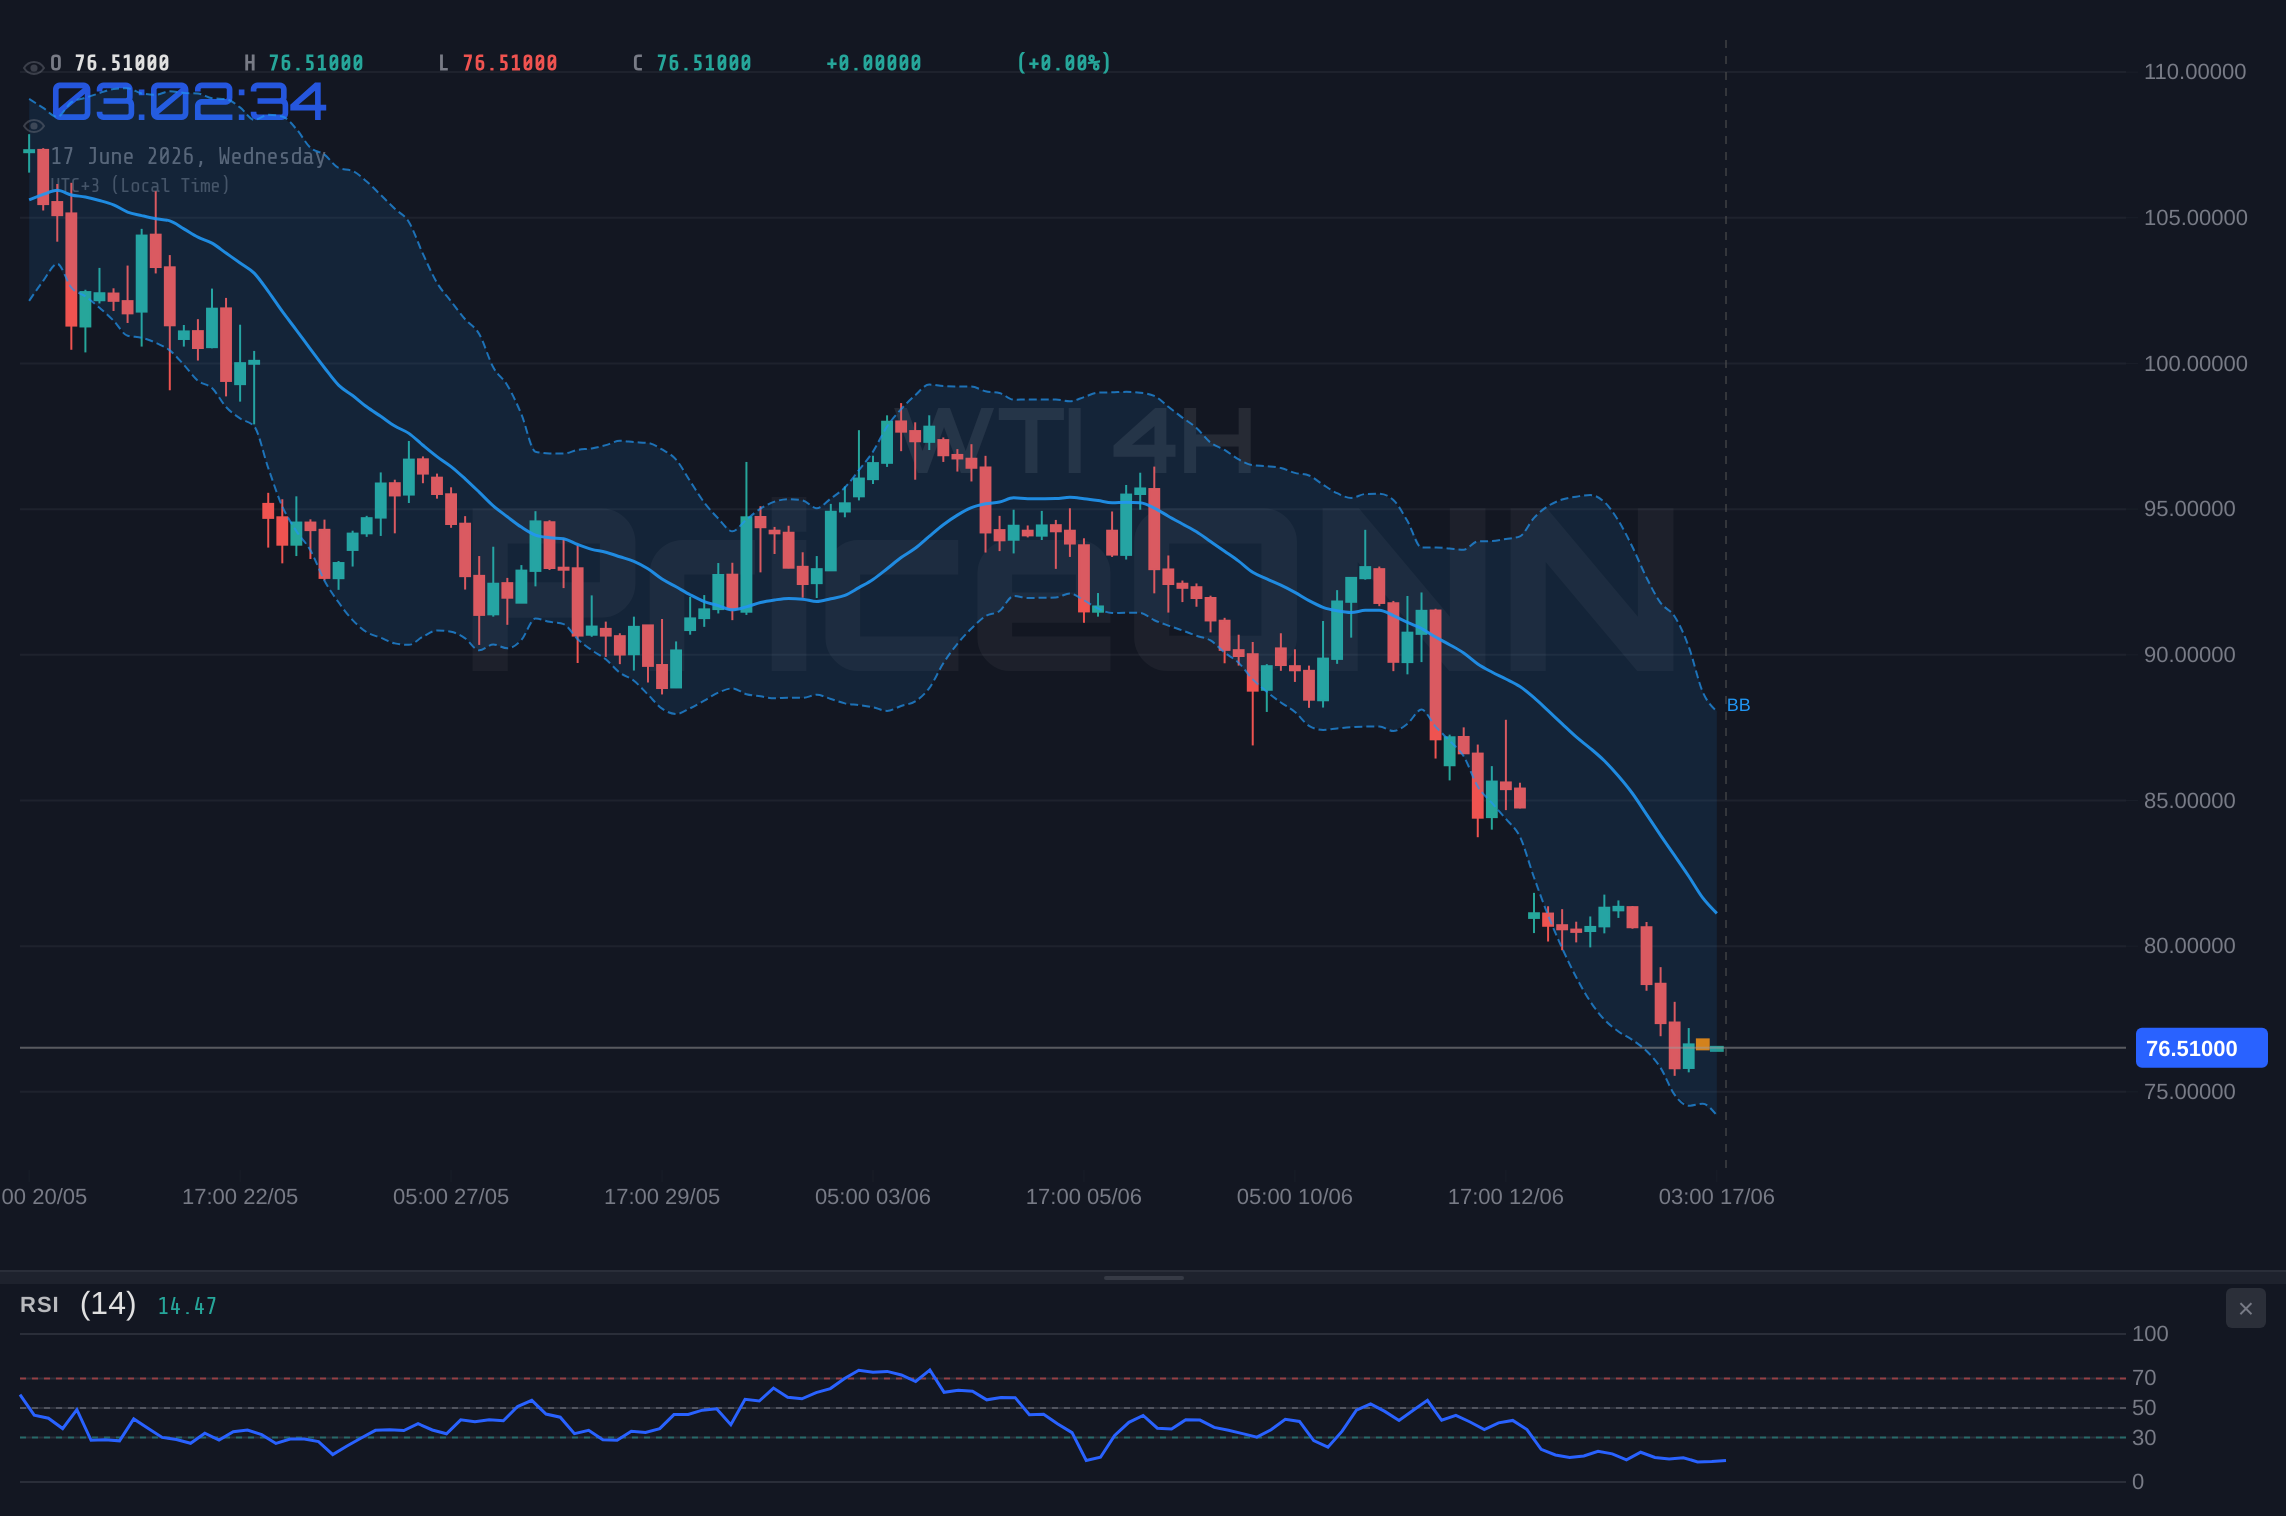
4H Chart: Trend Strength and Potential Exhaustion
Shifting to the 4-hour timeframe, the picture remains decidedly bearish, though signs of potential exhaustion begin to emerge. The trend is still classified as bearish with 100% strength, and the ADX at 46.8 confirms a strong trend. However, the RSI here is even deeper in oversold territory at 22.31, and the Stochastic is also deeply oversold, with %K at 11.07 and %D at 9.04. This extreme oversold condition across multiple oscillators on the 4-hour chart suggests that the current downward momentum might be nearing a point of exhaustion. The MACD continues to show negative momentum, aligning with the prevailing trend. The Bollinger Bands remain below the middle band, reinforcing the bearish bias. While the immediate pressure is downwards, the combination of extreme oversold readings on RSI and Stochastic across both the 1H and 4H charts warrants close observation for any signs of a potential reversal or at least a significant corrective bounce.
Daily Chart: The Bigger Picture of a Declining Trend
On the daily chart, the overall trend for WTI is also bearish, albeit with a slightly lower trend strength of 94% compared to the shorter timeframes. The ADX here is at 20.92, indicating a moderately strong trend. The RSI at 30.1 is on the cusp of oversold territory, and the Stochastic is showing a bearish signal (%K below %D) while also being in the lower range. The MACD is below its signal line, reinforcing the bearish momentum. The Bollinger Bands are hugging the lower band, a clear sign of bearish pressure. The key support levels on the daily chart are more significant, resting at $83.40, $82.45, and $81.64. Conversely, resistance levels are now seen at $85.16, $85.97, and $86.92. The current price of $76.51 is well below these significant daily support levels, highlighting the depth of the current downturn and the challenges bulls face in staging a meaningful recovery without significant fundamental or technical shifts.
Correlation Analysis: DXY, Equities, and Inflationary Echoes
The recent plunge in WTI prices cannot be viewed in isolation. The broader market context plays a crucial role. The Dollar Index (DXY) is currently trading at 99.59, showing a slight daily decrease of 0.09%. Historically, a stronger dollar often correlates with lower commodity prices, as dollar-denominated assets become more expensive for holders of other currencies. While the DXY is showing some weakness today, its overall strength in recent times has likely contributed to the pressure on oil. Furthermore, the performance of equity markets, particularly the SP500 and Nasdaq, provides insight into risk appetite. The SP500, trading at 6572.87 with a 0.74% daily gain, and Nasdaq at 30007.26 with a significant 1.65% daily loss, present a mixed picture. The Nasdaq's sharp decline might suggest waning risk appetite, which could indirectly support safe-haven assets but typically pressures riskier commodities like oil. The news of a tentative U.S.-Iran interim agreement, as reported, and the expectation of increased oil flows from the Middle East, directly impact inflation expectations. Falling oil prices could ease pressure on India's trade deficit, as noted, and generally dampen inflationary pressures globally, a factor that central banks are closely monitoring.
Geopolitical Undercurrents and Supply-Side Shocks
The energy market remains intrinsically linked to geopolitical developments. While the recent news of an LNG tanker clearing the Strait of Hormuz after the U.S.-Iran deal announcement suggests a de-escalation of tensions in that specific region, the broader supply picture is complex. OPEC+ decisions and production quotas continue to be a major influencer. Any indication of increased supply, whether from OPEC+ members or other producers, can quickly suppress prices. Conversely, unexpected supply disruptions due to geopolitical conflicts or infrastructure issues can send prices soaring. The current bearish move in WTI seems to be driven more by anticipated supply increases and a potential easing of geopolitical risk premiums, rather than a sudden drop in demand. However, the market remains sensitive to any news that could alter the supply-demand balance, making it a volatile arena.
Fundamental Drivers: Demand Outlook and Economic Health
Beyond immediate supply-side concerns and geopolitical headlines, the demand outlook for crude oil is a critical fundamental driver. Global economic health, particularly in major consuming nations like the U.S., China, and Europe, dictates the appetite for energy. If economic growth falters, industrial activity slows, and consumer spending wanes, oil demand will inevitably decline, putting downward pressure on prices. Conversely, robust economic expansion typically fuels higher oil consumption. The current mixed signals from the SP500 and Nasdaq, alongside the bearish trend in WTI, suggest that underlying economic concerns might be weighing on oil prices. Traders are closely watching leading economic indicators such as PMI surveys and inflation data for clues about future demand trends. The Federal Reserve's policy decisions, including interest rate expectations, also play a significant role, influencing both economic growth and the strength of the dollar.
Trading Scenarios: Navigating the Uncertainty
Given the conflicting signals across different timeframes and indicators, the current market environment for WTI presents a complex trading landscape. While the shorter-term charts scream bearishness, the extreme oversold conditions on the 4-hour and daily charts suggest that a bounce is plausible, even within a larger downtrend. This creates opportunities for both bears looking to press their advantage and bulls seeking to capitalize on potential reversals or corrective moves.
Bearish Scenario: Continued Downside Pressure
65% ProbabilityNeutral Scenario: Consolidation and Oversold Bounce
25% ProbabilityBullish Scenario: Short-Covering Rally
10% ProbabilityRisk Management: The Trader's Compass
In a market environment as volatile as WTI currently presents, robust risk management is not just advisable - it's essential. The strong ADX readings on shorter timeframes signal that significant price moves can occur rapidly. For those anticipating a bearish continuation, the trigger to enter would likely be a decisive break below the $76.01 support level, with targets extending towards $75.79 and the daily low of $75.55. Conversely, any trader looking for a bullish reversal would need to see price hold above the immediate support at $76.31 and convincingly break the resistance at $76.83, potentially signaling a short-covering rally. Invalidation levels are crucial: a close below $76.01 would likely nullify any immediate bullish thesis, while a sustained move above $76.83 might invalidate the bearish outlook. Always remember to use appropriate stop-loss orders and position sizing to protect your capital, especially when trading trending markets.
The Road Ahead: What to Watch
Looking forward, several factors will shape the trajectory of WTI prices. The ongoing geopolitical landscape, particularly concerning supply from the Middle East, remains a key variable. Any unexpected disruptions could quickly reverse the current bearish sentiment. Furthermore, the Federal Reserve's monetary policy stance and upcoming economic data releases, such as inflation reports and employment figures, will heavily influence both the dollar's strength and overall risk appetite, indirectly impacting oil demand. The technical picture, with WTI testing significant support levels around $76.51, presents a critical juncture. While shorter-term indicators suggest continued downside, the deeply oversold conditions on longer timeframes hint at a potential for a corrective bounce. Traders must remain vigilant, monitor these key levels, and be prepared to adapt their strategies as new information unfolds. The market is currently showing strong bearish momentum, but the oversold conditions cannot be ignored indefinitely.
Frequently Asked Questions: WTI Analysis
What happens if WTI breaks below the $76.01 support level?
A decisive close below $76.01 on the 1-hour chart would likely invalidate any immediate bullish hopes and confirm the continuation of the bearish trend. This could trigger further selling pressure, with the next significant support target at $75.79, potentially extending down to the daily low of $75.55.
Should I buy WTI at current levels around $76.51 given the oversold RSI?
Buying solely based on the oversold RSI at 30.1 (daily) or 29.11 (1H) is risky given the strong bearish trend (ADX 51.23 on 1H). A more prudent approach would be to wait for confirmation, such as a hold above $76.31 and a break of $76.83 resistance, before considering a long position, targeting $77.35.
Is the ADX reading of 51.23 a sell signal for WTI right now?
An ADX of 51.23 on the 1-hour chart signifies a very strong trend, confirming the current bearish momentum. While it doesn't directly signal a 'sell' in itself, it indicates that the market is strongly trending downwards, making short positions more favorable until this trend strength significantly diminishes or reverses.
How will the U.S.-Iran deal announcement affect WTI prices this week?
The news of a tentative U.S.-Iran deal and potential easing of Middle East tensions has contributed to the bearish sentiment by reducing geopolitical risk premiums and suggesting increased oil supply. This could continue to pressure WTI prices lower, especially if it leads to sustained lower inflation expectations and dampens demand forecasts.
Track markets in real-time
AI-powered analysis, technical indicators and real-time price data.
Join Our Telegram Channel
Breaking market news, AI analysis and trading signals instantly.
Join Channel