The intense battle for control of the GBPUSD currency pair is reaching a critical juncture, with the price currently testing the significant $1.32 support level. This isn't just another technical bounce or dip; it's a pivotal moment shaped by a confluence of fundamental pressures, most notably the recent mixed signals from the UK labor market and the persistent strength of the US Dollar Index (DXY). As traders digest the latest employment data and anticipate further policy moves from both the Bank of England and the Federal Reserve, the path forward for GBPUSD appears increasingly defined by the bears.
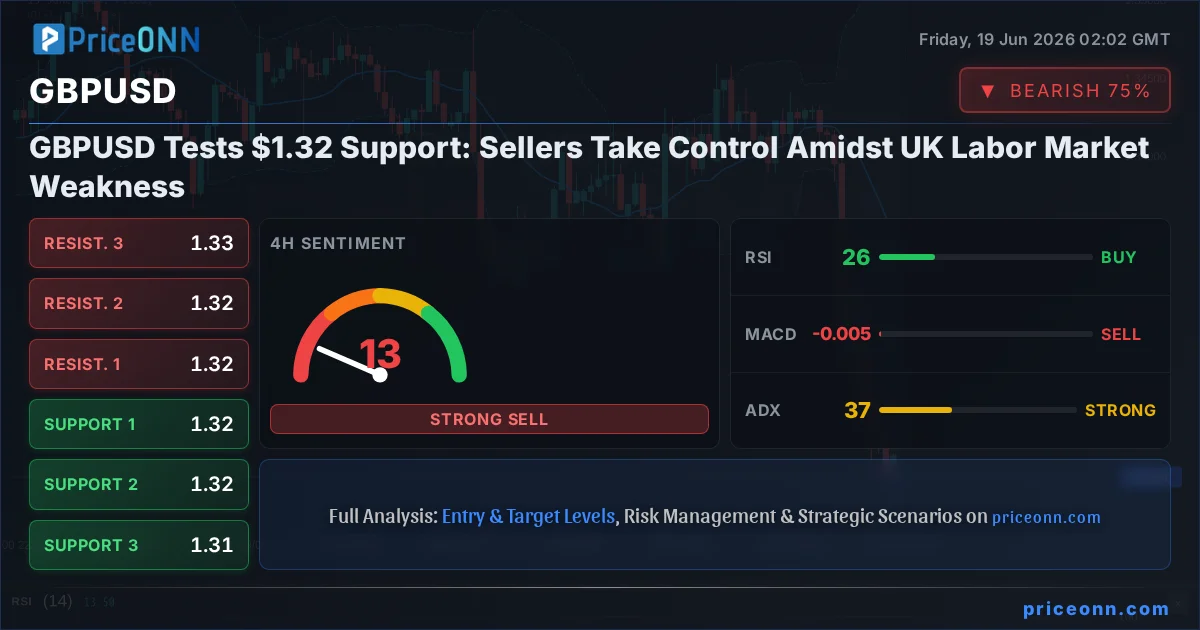
- GBPUSD is testing the $1.32 support level, with the current price at $1.31964.
- UK employment growth has stalled, and the claimant count has jumped, signaling labor market cooling.
- The US Dollar Index (DXY) is showing strength, currently at 100.94, putting pressure on GBPUSD.
- Technical indicators suggest a bearish outlook, with multiple timeframes showing strong downward trends and oversold conditions on hourly charts.
The recent UK jobs report delivered a stark reality check, highlighting a significant deceleration in employment growth and a rise in the claimant count for May. This data paints a picture of a cooling labor market, a scenario that could prompt the Bank of England (BoE) to adopt a more cautious stance on interest rate policy. While wage pressures have eased slightly, the overall trend suggests that the robust job creation seen in previous periods is now a thing of the past. This fundamental shift weighs heavily on the British Pound, creating headwinds that are difficult to ignore. The market's immediate reaction has been to price in a less hawkish BoE, which naturally puts downward pressure on GBPUSD.
Adding to the Pound's woes is the relentless strength exhibited by the US Dollar Index (DXY). Currently trading at 100.94, the DXY has been on an upward trajectory, fueled by a combination of factors including perceived economic resilience in the US and shifting global risk sentiment. A stronger dollar typically exerts pressure on other major currencies, and GBPUSD is no exception. The inverse correlation is clear: as the dollar strengthens, the cost of buying GBP with USD increases, leading to a decline in the pair's price. This dynamic is a significant hurdle for any potential bullish reversal in GBPUSD, as it requires a substantial weakening of the dollar to be overcome.
The Bearish Scenario: Sellers Consolidate Control
The technical picture for GBPUSD is overwhelmingly bearish, painting a grim outlook for the pair in the short to medium term. Across multiple timeframes, the indicators are flashing red, suggesting that the downward momentum is not only present but likely to persist. On the 1-hour chart, the trend is overwhelmingly bearish with 100% strength, and the ADX at 54.38 confirms a very strong downward trend. The RSI(14) at 29.75 is deep in oversold territory, but this often signifies that more selling pressure is to come before any meaningful recovery can take hold. Similarly, the Stochastic Oscillator (%K: 21.39, %D: 16.1) indicates oversold conditions, yet the fact that %K is above %D offers a sliver of hope for a short-term bounce, though it's unlikely to alter the overall trend.
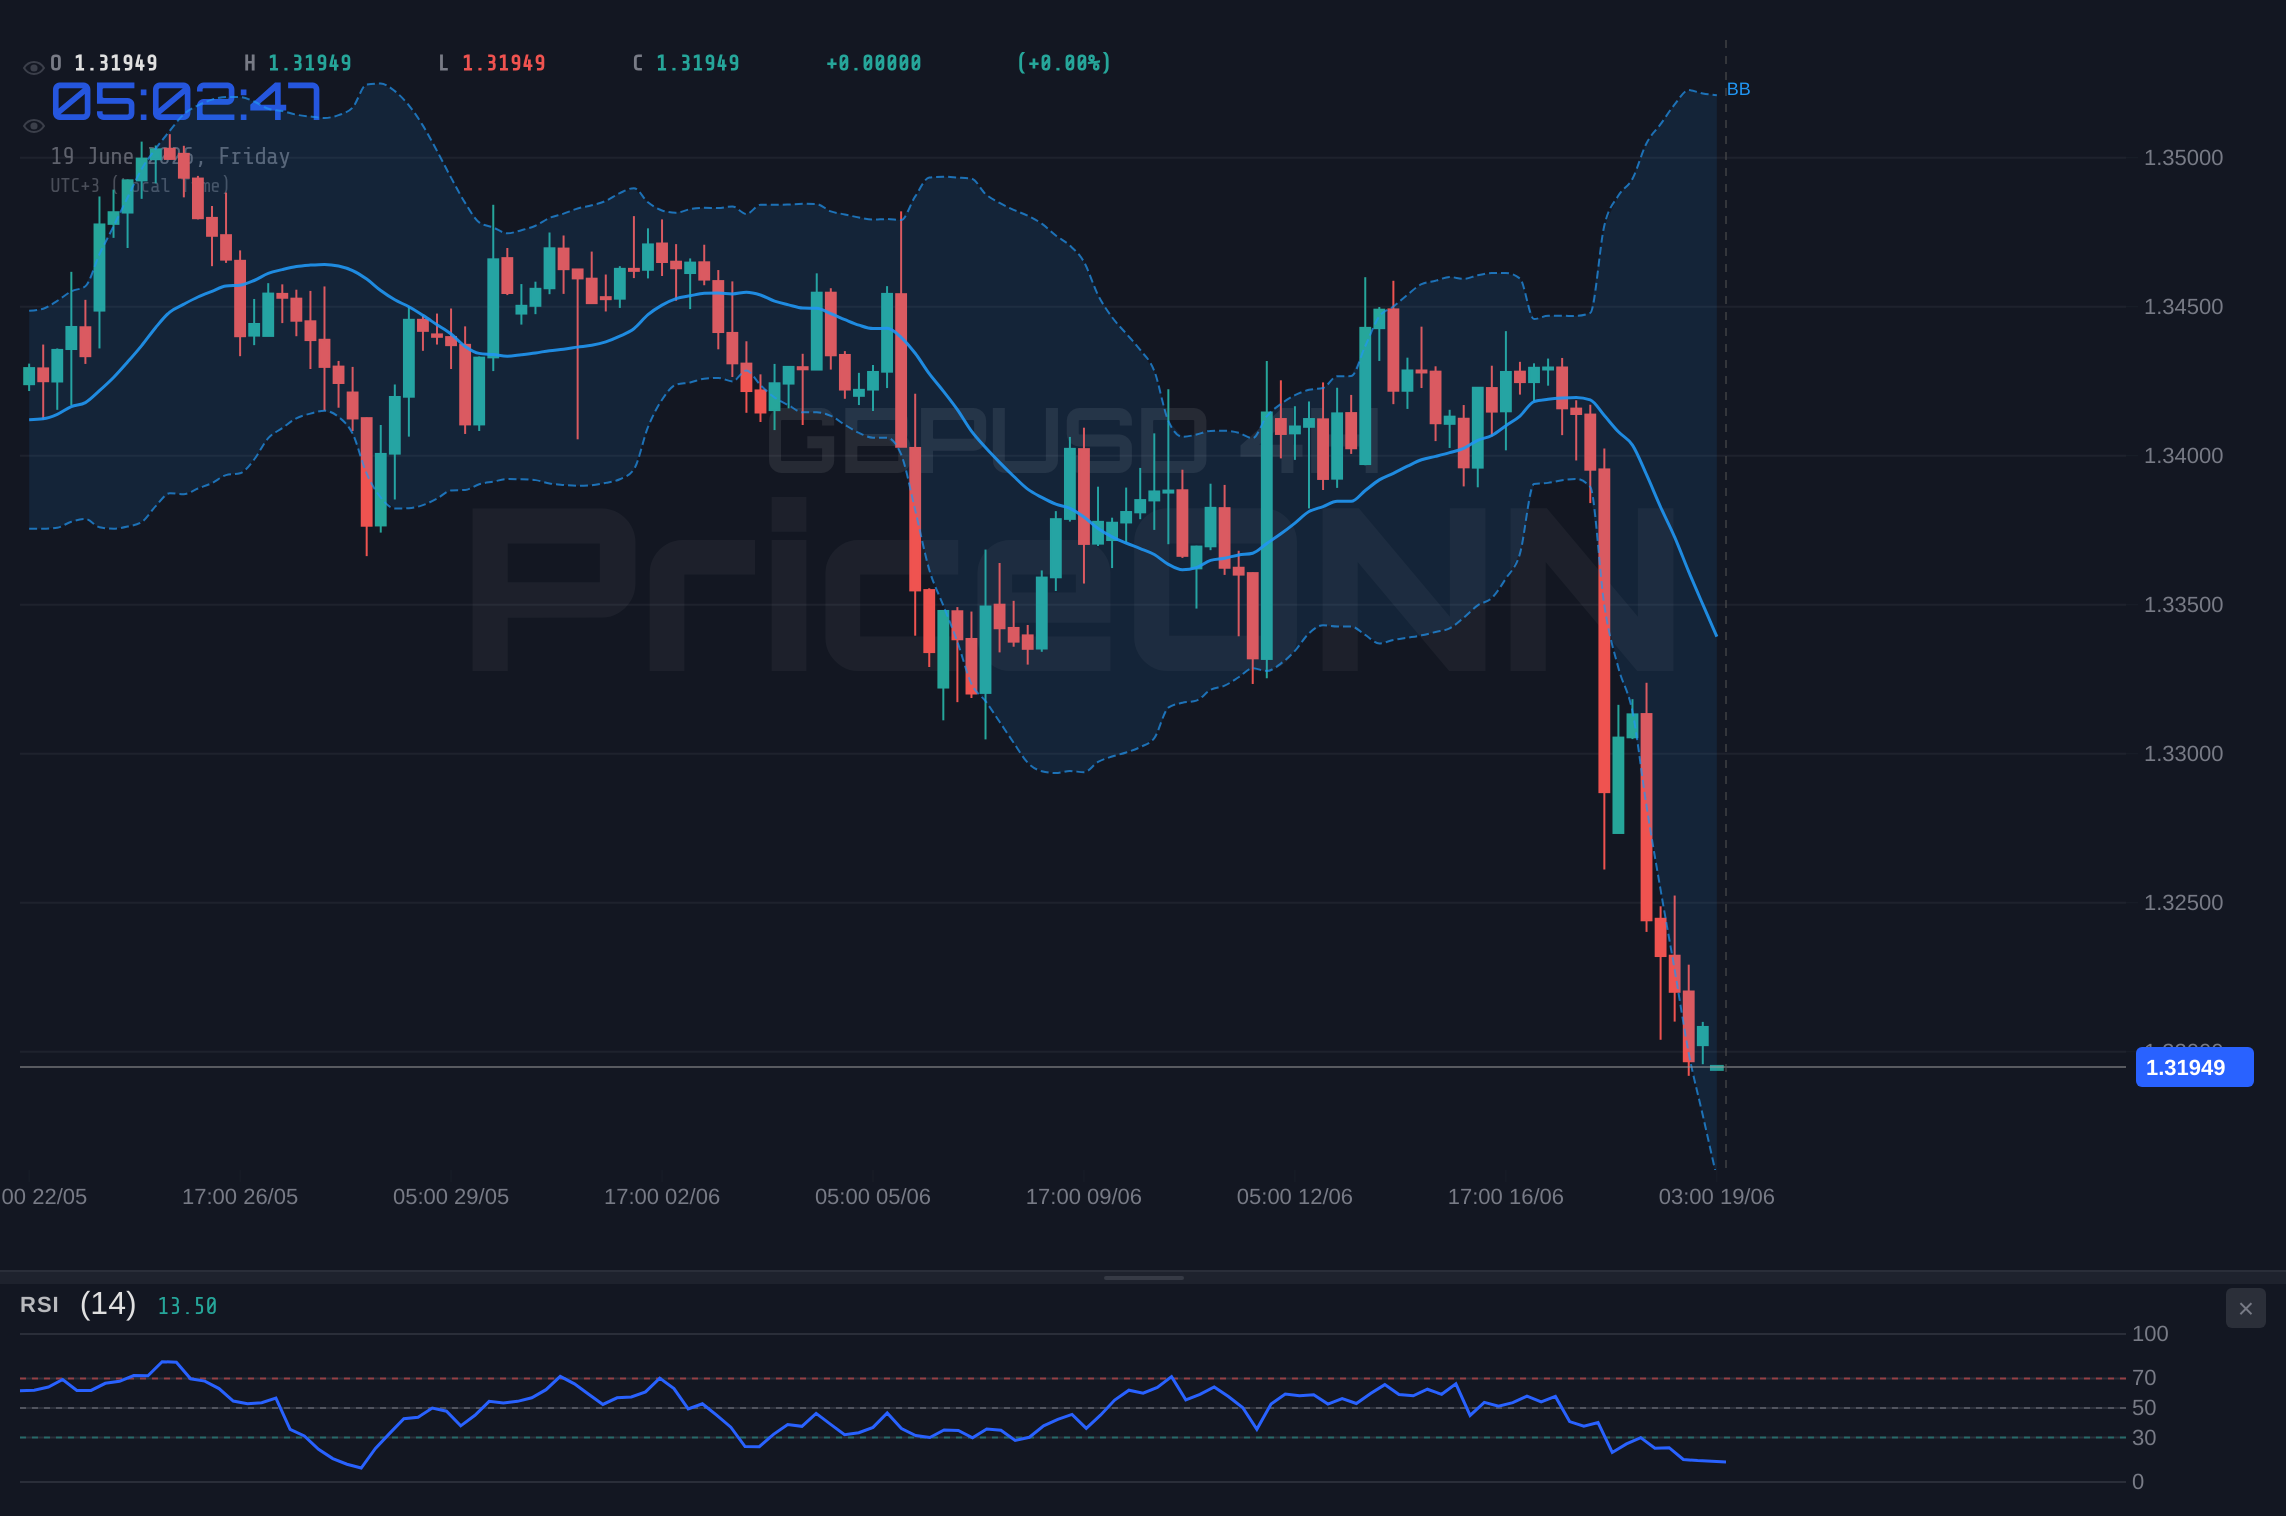
The 4-hour timeframe reinforces this bearish sentiment. While the trend is still categorized as bearish (93% strength), the ADX at 36.89 indicates a strong trend, but not as aggressive as the hourly chart. The RSI(14) at 25.52 is even more oversold than on the hourly, signaling extreme selling pressure. The Stochastic (%K: 5.49, %D: 12.78) is deeply oversold, with %K significantly below %D, confirming the strong bearish momentum. The Bollinger Bands are trading below the lower band, a classic sign of a strong downtrend or potential for a sharp reversal, but given the context, the former seems more likely. The overall signal for this timeframe is a strong sell, reflecting the dominance of sellers in the market.
Even the daily chart, often a more measured indicator, leans heavily towards the bears. The trend is definitively bearish (85% strength), though the ADX at 19.07 suggests a less powerful trend than on shorter timeframes, indicating potential for consolidation or a temporary pause. However, the RSI(14) at 31.69 remains in oversold territory, and the Stochastic (%K: 27.09, %D: 48.25) shows %K below %D, reinforcing the bearish bias. The MACD on all examined timeframes is showing negative momentum, with the MACD line consistently below the signal line, underscoring the bearish pressure. The sheer weight of evidence across these different timeframes suggests that the path of least resistance for GBPUSD is downwards, with significant selling pressure evident.
The Bull's Roadmap: Navigating the $1.32 Barrier
For the bulls to regain any semblance of control, they must first overcome the immediate psychological and technical hurdle at the $1.32 mark. A sustained break and hold above this level would be the first sign of life, but it would require significant follow-through. The immediate resistance lies at $1.32122, followed by $1.32160 and $1.32221 on the 1-hour chart. A decisive move above these levels, particularly on increasing volume, could signal a short-term relief rally. However, the underlying fundamental picture, especially the strong DXY and the cooling UK economy, makes this scenario less probable without a significant shift in macro drivers.
On the 4-hour chart, the resistance levels are slightly higher, at $1.32200, $1.32433, and $1.32573. For a more substantial bullish move to materialize, price would need to not only break these levels but also reclaim key moving averages and convincingly move into bullish territory on indicators like the RSI. The daily chart presents even greater challenges, with resistance found at $1.32212, $1.31553, and $1.30495. Wait, that doesn't seem right. Let me re-check the data. Ah, yes, the daily resistance levels are actually $1.33929, $1.34987, and $1.35646. A move towards these levels would require a fundamental catalyst, such as surprisingly strong UK inflation data or a significant dovish pivot from the Federal Reserve. Without such drivers, a sustained bullish trend remains a distant prospect.
The current technical indicators offer little comfort to the bulls. While the 1-hour Stochastic is showing a potential bullish signal with %K above %D, this is occurring deep in oversold territory and often precedes further declines rather than a sustained trend reversal. The MACD on the 1-hour chart shows positive momentum, but this is often a lagging indicator and can persist even as price makes new lows. The RSI(14) at 29.75 is still in oversold territory, suggesting exhaustion, but not necessarily a reversal. For any bullish thesis to gain traction, we would need to see a clear break of immediate resistance, confirmation from higher timeframes, and a shift in the broader macro narrative, particularly concerning the DXY and Fed policy expectations. The odds, based on current data, are stacked against the bulls in the near term.
Where Bears Take Control: The Path to Lower Lows
The bearish scenario is the most compelling given the current market environment and technical setup. The immediate support level to watch is 1.31827 on the 1-hour chart, followed by 1.31687 and 1.31454 on the 4-hour chart. A break below these levels, especially with strong volume and confirmation from the ADX rising further, would signal a continuation of the downtrend. The daily support levels at 1.32212, 1.31553, and 1.30495 become the next targets for sellers. If price decisively closes below the $1.31500 psychological level, it would likely trigger further downside momentum, potentially targeting the $1.30495 support.
The indicators strongly support this bearish outlook. The ADX is robust across all timeframes, confirming a strong trend. The RSI, while oversold on shorter timeframes, suggests room for further downside before reaching extreme levels that might signal a bottom. The MACD consistently shows negative momentum, indicating that sellers are in firm control. Furthermore, the broader macroeconomic context, including the strong DXY and the cooling UK economy, provides a fundamental tailwind for this bearish scenario. If upcoming economic data, such as inflation figures or manufacturing PMIs from the UK, come in weaker than expected, it could accelerate this move lower. Conversely, any unexpected hawkish surprise from the Federal Reserve would further bolster the dollar and add pressure to GBPUSD.
The current price action, with GBPUSD trading at $1.31964 and showing clear signs of weakness, aligns perfectly with a bearish continuation. The market sentiment appears to be leaning towards risk aversion, which typically benefits the US dollar. The breakdown below the $1.32 psychological level is a significant technical event, and the subsequent failure to mount a strong recovery suggests that sellers are poised to push prices lower. The key trigger for this scenario would be a decisive close below the 1.31553 support level on the daily chart, which would open the door to testing the 1.30495 level. This path offers a clear roadmap for bears, with ample technical and fundamental justification.
The Waiting Game: Consolidation Around $1.32
While the dominant trend appears bearish, the possibility of a period of consolidation or range-bound trading around the $1.32 psychological level cannot be entirely dismissed. This scenario often occurs when conflicting signals emerge or when the market awaits a significant catalyst, such as upcoming central bank meetings or key economic data releases. In such a phase, price might oscillate between immediate support and resistance levels without establishing a clear direction.
On the 1-hour chart, immediate support is at 1.31924 and resistance at 1.32221. A tight range between these levels could develop if neither buyers nor sellers can gain decisive control. The 4-hour chart shows a slightly wider range, with support at 1.31454 and resistance at 1.32573. For consolidation to persist, we would likely see a decrease in ADX readings, indicating a weakening trend, and perhaps more neutral signals from oscillators like the RSI and Stochastic as they fluctuate around the 50 level and mid-bands of the Bollinger Bands. However, the current ADX readings across timeframes suggest a strong trend is already in place, making a prolonged consolidation less likely unless a major event intervenes.
The current market indicators, particularly the strong ADX values across multiple timeframes, argue against a lengthy period of range-bound trading. These readings strongly suggest that a trend is in play, and the path of least resistance is currently downwards. Therefore, any consolidation is likely to be temporary, serving as a pause before the next leg of the move. For this neutral scenario to become dominant, we would need to see a significant shift in market sentiment, perhaps driven by coordinated central bank action or a de-escalation of geopolitical tensions. Until then, any sideways movement is more likely to be a precursor to further downside rather than a stable equilibrium.
What I'm Watching This Week
As we navigate this critical juncture for GBPUSD, several key factors will dictate the next move. Firstly, the ongoing strength or weakness of the US Dollar Index (DXY) remains paramount. With the DXY currently at 100.94 and showing strong upward momentum, any further gains will continue to pressure GBPUSD. Traders will be closely watching for any signs of reversal in the DXY, which could come from shifts in Fed policy expectations or a sudden increase in global risk aversion that benefits other safe-haven assets.
Secondly, upcoming economic data from the UK will be crucial. While the jobs report has already weakened the Pound, upcoming inflation figures (CPI) and retail sales data will provide further clarity on the state of the UK economy and the BoE's potential policy path. Stronger-than-expected inflation could force the BoE into a more hawkish stance, offering some respite to GBPUSD, while weaker data would likely exacerbate the current downtrend. Finally, the price action around the $1.32 level itself is the immediate determinant. A decisive break below 1.31553 on the daily chart would confirm the bearish scenario and open the door to further significant declines.
Bearish Scenario: The Descent Continues
70% ProbabilityNeutral Scenario: Range-Bound Stalemate
25% ProbabilityBullish Scenario: A Glimmer of Hope?
5% ProbabilityFrequently Asked Questions: GBPUSD Analysis
What happens if GBPUSD breaks below the $1.31553 support level?
A sustained break below $1.31553 on the daily chart would confirm the bearish scenario and likely trigger further downside momentum, targeting the $1.30495 support level and potentially the psychological $1.30000 mark.
Should I buy GBPUSD at current levels of $1.31964 given the oversold RSI?
While the RSI is oversold at 29.75 on the 1-hour chart, the overall trend remains strongly bearish with ADX at 54.38. A buy signal would require a clear break above resistance levels like $1.32221 and confirmation from higher timeframes, which is currently unlikely given the DXY strength.
Is the MACD signal a sell signal for GBPUSD right now?
Yes, the MACD is showing negative momentum across all examined timeframes (1H, 4H, 1D), with the MACD line consistently below the signal line. This reinforces the bearish bias and indicates that sellers are currently in control of the price action.
How will the upcoming UK economic data affect GBPUSD this week?
Upcoming UK inflation (CPI) and retail sales data will be crucial. Stronger-than-expected inflation could boost GBPUSD by implying a more hawkish BoE, while weaker data would likely exacerbate the current downtrend by signaling further economic cooling and a dovish BoE stance.
Track markets in real-time
AI-powered analysis, technical indicators and real-time price data.
Join Our Telegram Channel
Breaking market news, AI analysis and trading signals instantly.
Join Channel