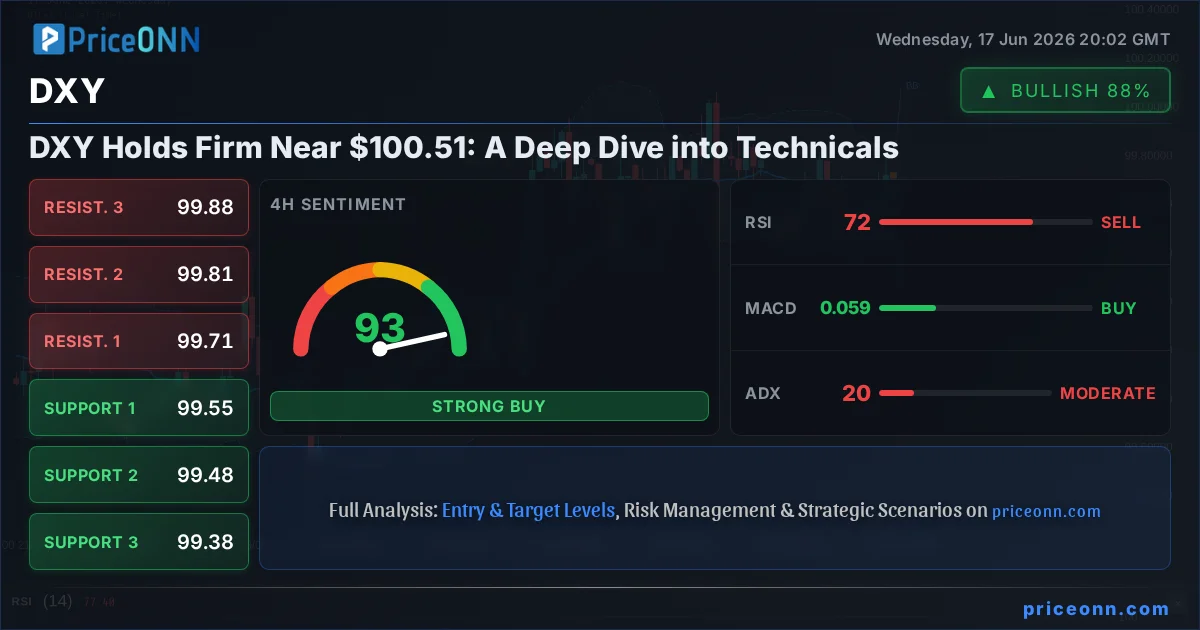
DXY Holds Firm Near $100.51: A Deep Dive into Technicals
The Dollar Index hovers around $100.51, presenting a critical juncture for traders. Analysis reveals mixed signals across timeframes, with key support and resistance levels in focus. Explore the bull vs. bear debate and potential trading scenarios.
Is the Dollar Index ($DXY) poised for a significant move, or are we entering a period of consolidation? With the DXY currently trading near the critical $100.51 level, the market is at a crossroads, presenting a compelling case for a deep technical analysis. Bulls and bears are locked in a fierce battle, each looking to seize control and dictate the next directional impulse. This tension is palpable, especially as we observe conflicting signals across various timeframes, from the rapid-fire 1-hour charts to the more definitive daily view. Understanding the interplay between indicators, support and resistance zones, and broader market correlations is paramount for navigating this pivotal moment. This article delves into the intricate technical landscape of the DXY, dissecting the arguments for both upward and downward movements, and ultimately offering a data-driven perspective on where the dollar might be headed.
- The Dollar Index (DXY) is trading near $100.51, a critical technical level.
- RSI at 68.37 on the daily chart suggests upward momentum, though not yet overbought, while 1-hour RSI at 83.65 signals potential overextension.
- Key support for DXY is identified at $99.42, with resistance looming at $100.13 on the daily chart.
- ADX readings indicate a strong uptrend on the 1-hour (31.07) and daily (28.61) charts, suggesting directional conviction is building.
- Conflicting signals across timeframes necessitate a cautious approach, with confirmation needed for either a sustained rally or a pullback.
The current market sentiment appears to be a tug-of-war between the persistent strength of the US dollar and the potential for a healthy correction. On the daily chart, the DXY is exhibiting a strong uptrend (98% strength), supported by a robust ADX of 28.61. This suggests that directional conviction is present. However, the 1-hour RSI is flashing an 83.65, firmly in overbought territory, hinting that a short-term pullback could be on the cards. This divergence across timeframes is a classic signal of market indecision or a potential turning point. Traders are keenly watching to see if the dollar can maintain its upward trajectory or if profit-taking will lead to a more significant retracement. The interplay between these conflicting indicators will be crucial in determining the immediate direction.
The bulls have a compelling narrative, rooted in the dollar's recent performance and the underlying economic context. The daily chart shows a clear upward trend, with the price currently trading above the middle Bollinger Band and showing positive momentum according to the MACD. The ADX at 28.61 on the daily chart further solidifies the argument for a strong trend. On the 1-hour timeframe, the RSI at 83.65, while indicating overbought conditions, also speaks to significant buying pressure. The Stochastic indicator on the 1-hour chart (K=78.14, D=69.11) supports this bullish momentum, showing %K above %D. Furthermore, the Dollar Index (DXY) at $100.51 is benefiting from a broader risk-off sentiment observed in other markets, such as the Nasdaq 100's decline. This suggests that investors are seeking the safety and stability of the US dollar amidst global economic uncertainties. The strong uptrend on the 1-hour chart, coupled with positive MACD momentum, implies that buyers are actively engaged and could push the index higher.
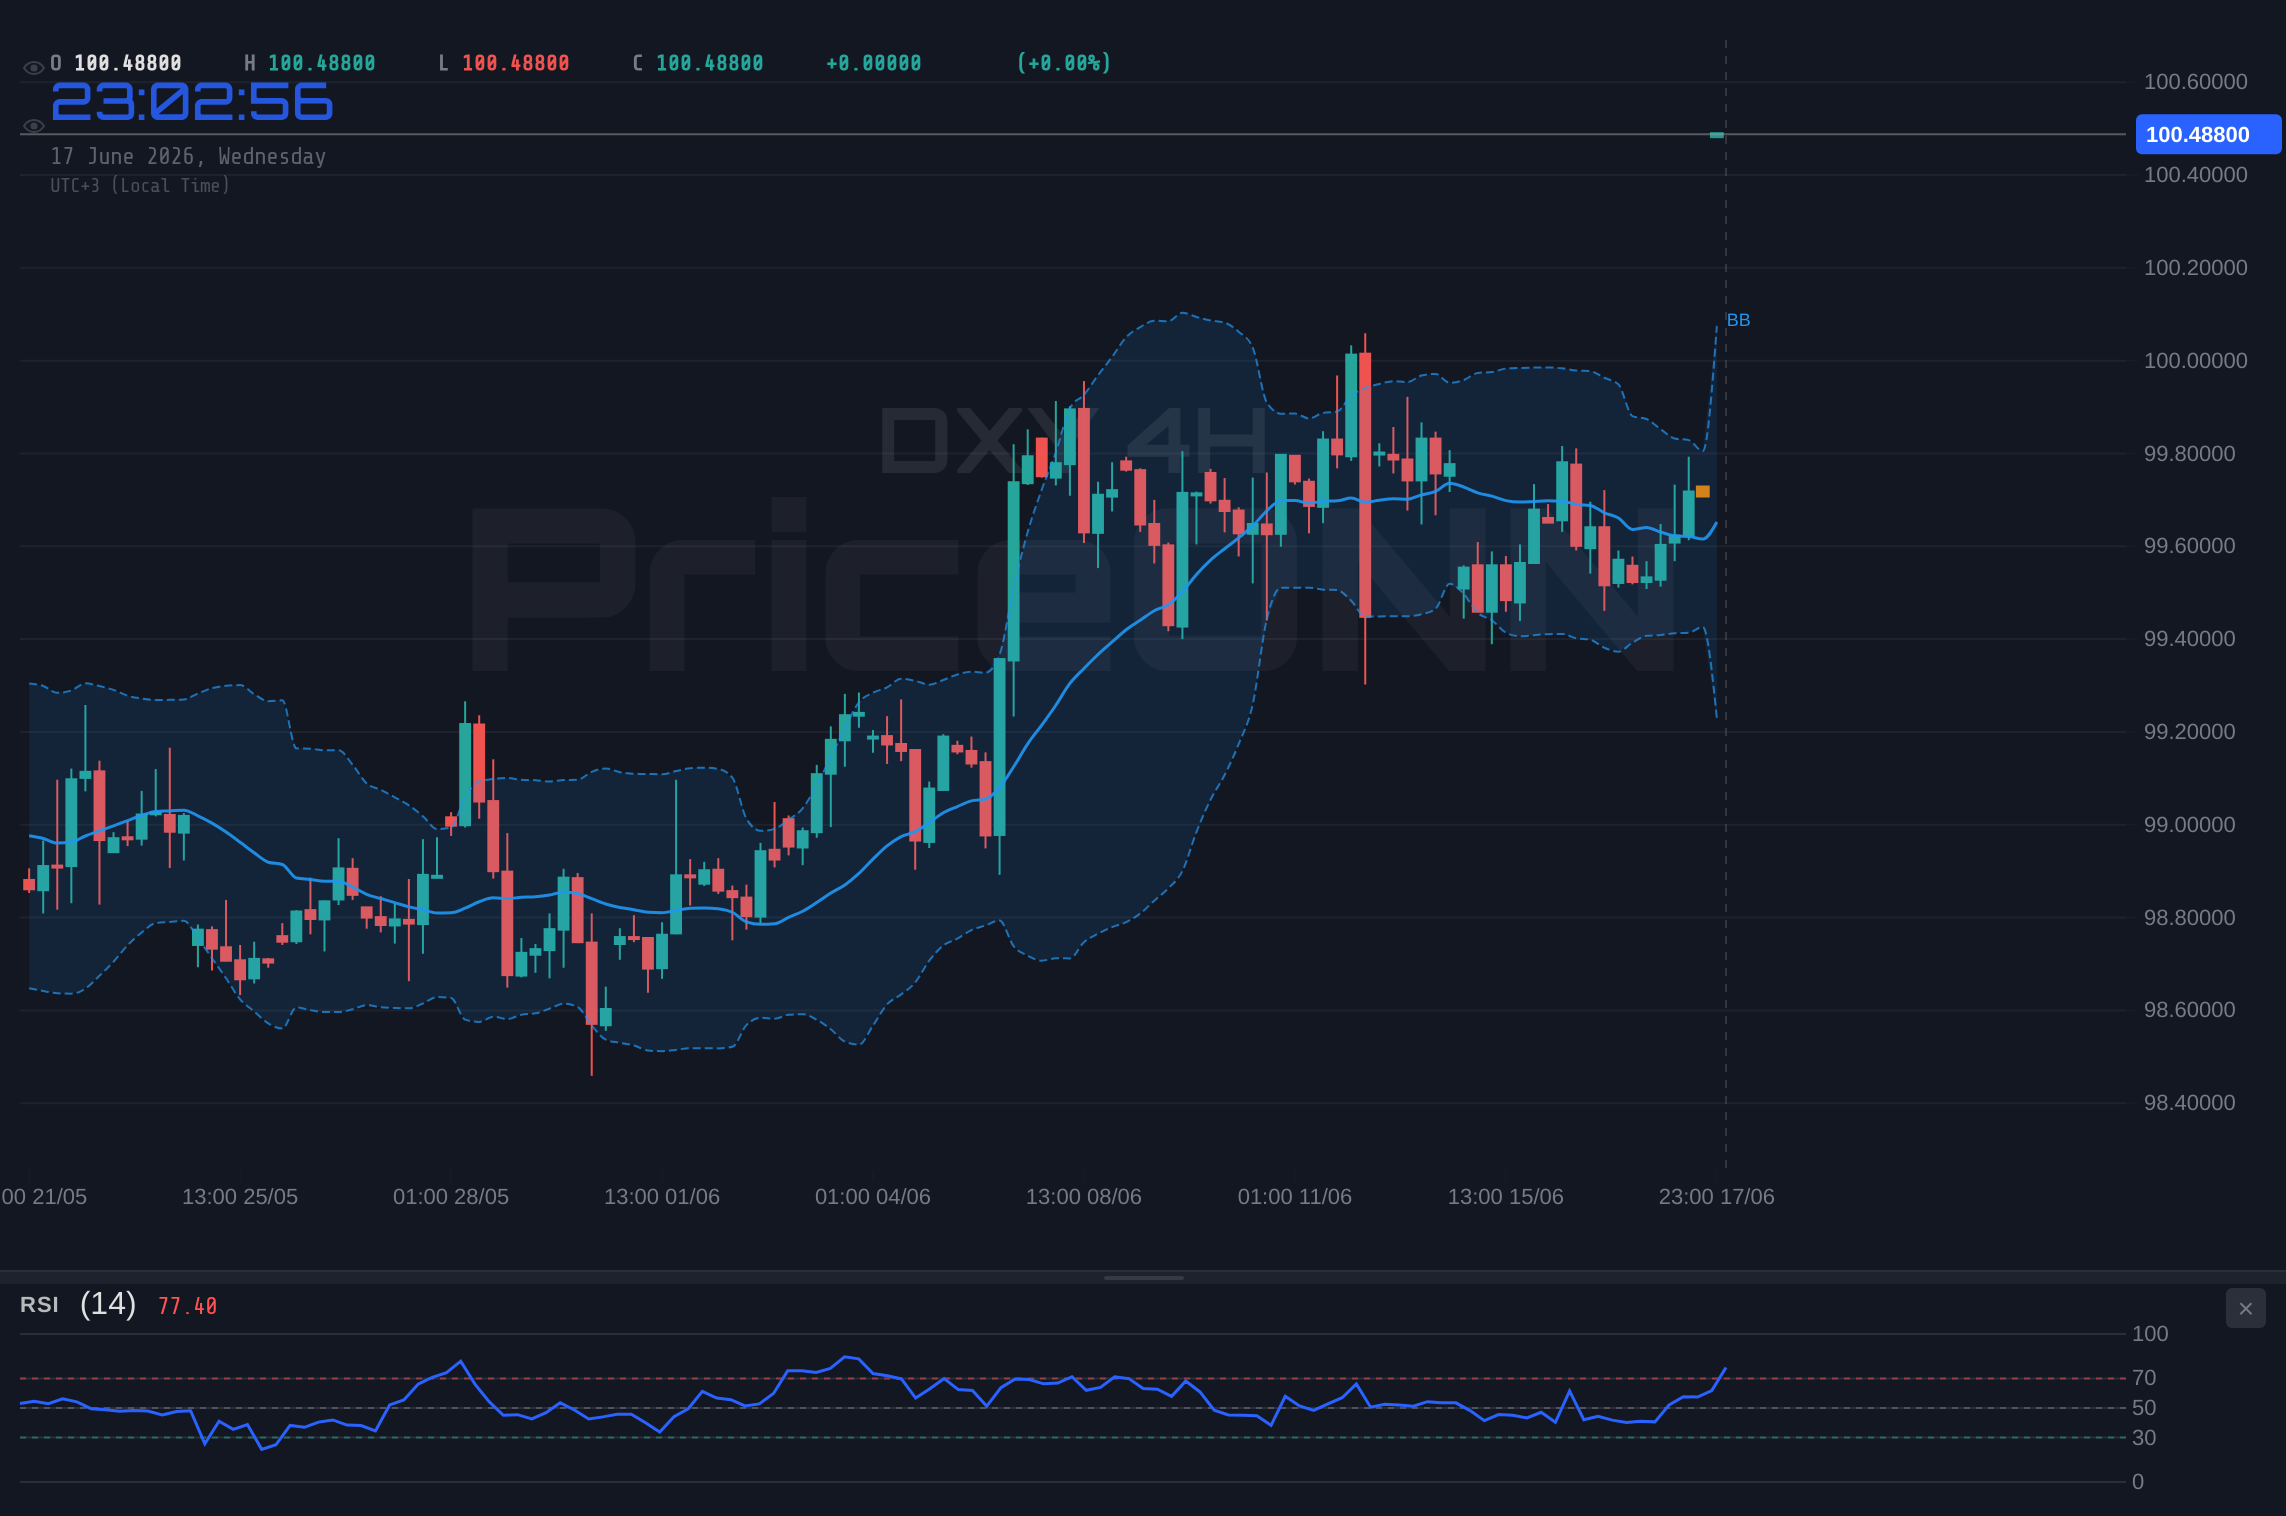
However, the bears are not without their ammunition. The overbought RSI readings on the 1-hour (83.65) and 4-hour (72.08) charts are significant red flags, suggesting that the recent rally might be overextended and due for a correction. The Stochastic indicator on the 4-hour chart (K=61.88, D=36.81) also supports this, showing %K above %D, indicating potential upward momentum but also nearing overbought territory. While the daily ADX at 28.61 suggests a strong trend, the daily RSI at 68.37 is approaching, but not yet in, overbought territory, leaving room for further upside but also highlighting a potential ceiling. The key support level at $99.42 on the daily chart becomes critical. A decisive break below this level would invalidate the bullish thesis and signal a deeper pullback, potentially targeting the $99.26 and $99.06 levels. The fact that the price has climbed so rapidly also increases the likelihood of profit-taking, especially if broader market sentiment shifts.
Zooming into the intraday dynamics, the 1-hour chart presents a mixed picture that requires careful interpretation. The RSI at 83.65 is a clear warning sign of overextension, suggesting that the current upward momentum may be unsustainable in the immediate short term. This indicator, coupled with the Stochastic showing K=78.14 and D=69.11, implies that the market is entering overbought territory, paving the way for potential sellers to step in. The MACD histogram being positive and the MACD line above the signal line indicate bullish momentum, but this could quickly reverse if the RSI pressure leads to a price correction. The ADX at 31.07 confirms a strong trend, but a strong trend can sometimes be followed by sharp reversals if key levels fail. The current resistance at $100.23, $100.34, and $100.53 on the 1-hour chart will be the immediate battleground for bulls and bears.
Shifting focus to the 4-hour timeframe, the picture becomes slightly more nuanced. The RSI at 72.08, while still elevated, is less extreme than the 1-hour reading, suggesting that the upward momentum might still have some legs, but the overbought condition is certainly present. The MACD shows positive momentum, and the Stochastic indicator (K=61.88, D=36.81) continues to favour bulls, with %K still above %D. However, the ADX at 20.1 indicates a moderately strong trend, which is less definitive than the 1-hour or daily readings. The support levels at $99.55, $99.48, and $99.38 are crucial. A failure to hold these levels would suggest that the overbought conditions are indeed leading to a reversal. The resistance levels here are $99.71, $99.81, and $99.88. A break above these could signal a continuation, but the overbought RSI remains a significant concern.
The daily chart provides the broader context, and here, the picture is more bullish, though not without its caveats. The RSI at 68.37 indicates a strong upward trend that is approaching, but has not yet reached, overbought territory. This suggests there could be room for further appreciation. The MACD is positive, and the MACD histogram shows increasing bullish momentum. The ADX at 28.61 confirms a strong trend. The Stochastic indicator, however, shows K=73.08 and D=74.37, with %K below %D, which can sometimes signal a potential downturn or divergence. This is a key conflict: the daily RSI and ADX point to continued strength, while the Stochastic suggests caution. The primary resistance levels to watch are $99.77, $99.97, and $100.13. A sustained move above $100.13 could open the door to higher targets, but the overbought Stochastic is a warning that the rally might be nearing its peak.
The correlation analysis is critical for understanding the DXY's potential movements. With the Nasdaq 100 index showing a significant daily decline of -0.89% and trading at 29694.04, this indicates a risk-off sentiment in the equity markets. Typically, such a scenario would see investors flocking to safe-haven assets like the US dollar. The DXY's own upward move, supported by its strong ADX and daily RSI, aligns with this risk-off narrative. However, the relationship is not always linear. If the Federal Reserve's policy expectations were to shift dramatically, this could alter the DXY's trajectory independently of broader market sentiment. Currently, with the DXY at $100.51, its strength is likely amplifying the downward pressure on other riskier assets and commodities, such as Gold (XAUUSD) which is down -2.16% at $4237.52, and Silver (XAGUSD) down -4.18% at $67.07.
Let's consider the implications of the economic calendar. While no specific events were highlighted in the provided data for the immediate 48-hour window that directly impact the DXY, upcoming central bank speeches or inflation data releases could significantly sway the dollar's direction. Market participants are constantly digesting Fed-speak for clues on future monetary policy. Any indication of a more hawkish stance from the Fed could further bolster the DXY, pushing it towards higher resistance levels. Conversely, signals of a potential pause or even a pivot could trigger a correction, especially given the overbought conditions on shorter timeframes. Investors will be particularly attuned to any shifts in interest rate expectations, as these are often the primary drivers of currency valuations in the current environment.
The current technical setup on the DXY, trading near $100.51, presents a classic bull vs. bear debate. The bulls point to the strong daily uptrend, positive MACD momentum, and supportive ADX readings, arguing that the dollar is poised to continue its ascent, possibly driven by global risk aversion and a hawkish Federal Reserve outlook. They see the overbought RSI on shorter timeframes as a temporary pause rather than a reversal signal. The bears, however, highlight the extreme overbought conditions on the 1-hour and 4-hour charts, the divergence in the daily Stochastic indicator, and the critical support level at $99.42. They believe the market is ripe for a correction, where profit-taking could accelerate a move lower, especially if broader market sentiment shifts or Fed expectations soften.
The probability of a bullish continuation hinges on the DXY holding above key support levels and breaking through immediate resistance. If the bulls can maintain control above $99.42 and push through $100.13, the next significant target would be around the $100.53 resistance on the 1-hour chart, potentially extending higher. The strength of the daily trend and the risk-off sentiment in equities provide a favorable backdrop for this scenario. However, this path is fraught with peril given the stretched short-term indicators.
Conversely, a bearish scenario would be triggered by a decisive break below the $99.42 daily support. This would invalidate the current bullish structure and likely lead to a rapid unwinding of long dollar positions. The bears would then target the subsequent support levels at $99.26 and $99.06. This outcome becomes more probable if overbought conditions persist and trigger significant profit-taking, or if geopolitical tensions ease unexpectedly, reducing the demand for safe-haven assets.
A neutral scenario, or consolidation, is also a distinct possibility. This would involve the DXY trading within a defined range, likely between the immediate support at $99.42 and resistance at $100.13 (daily levels). In this scenario, neither bulls nor bears can gain decisive control, leading to choppy price action as the market awaits clearer fundamental or technical signals. This consolidation could allow short-term overbought conditions to cool off, potentially setting the stage for a more sustainable move in either direction once a breakout occurs.
Given the conflicting signals, particularly the divergence between shorter-term overbought conditions and the longer-term bullish trend, caution is advised. The ADX readings on both the 1-hour and daily charts (31.07 and 28.61 respectively) suggest a strong trend is in play, which often means pullbacks are shallow and trends resume. However, the RSI extremes on shorter timeframes cannot be ignored. A prudent approach would be to wait for confirmation. For bulls, confirmation would be a clear break and hold above the $100.13 daily resistance. For bears, confirmation would be a decisive close below the $99.42 daily support. Until then, the market remains in a tense equilibrium, with the $100.51 level acting as a crucial pivot point.
The current technical picture for the DXY, trading around $100.51, is complex. While daily indicators like RSI (68.37) and ADX (28.61) suggest bullish momentum, the 1-hour RSI (83.65) and Stochastic (K=78.14, D=69.11) are flashing overbought warnings. This divergence creates an environment ripe for volatility. Key support at $99.42 and resistance at $100.13 are the levels to watch. A break above resistance could signal a continuation of the uptrend, while a break below support might initiate a deeper correction. The overall trend strength indicated by the ADX suggests that whichever direction breaks out, it could be significant.
Bearish Reversal Scenario
35% ProbabilityConsolidation Scenario
30% ProbabilityBullish Continuation Scenario
35% ProbabilityFrequently Asked Questions: DXY Analysis
What happens if DXY breaks above the $100.13 daily resistance level?
A decisive break above $100.13 on the daily chart would invalidate short-term overbought signals and suggest a continuation of the bullish trend. This could trigger further buying pressure, potentially targeting the $100.34 and $100.53 resistance levels on the 1-hour chart.
Should I buy DXY at current levels near $100.51 given the mixed RSI signals?
Buying at $100.51 presents a risk due to the overbought RSI on the 1-hour (83.65) and 4-hour (72.08) charts. A more prudent approach would be to wait for a pullback to a key support level like $99.42 or confirmation of a breakout above $100.13, reducing the risk of catching a falling knife.
Is the daily RSI at 68.37 a sell signal for DXY right now?
An RSI of 68.37 on the daily chart is strong and indicates upward momentum, but it is not yet in overbought territory (typically considered above 70). While it suggests the rally is robust, it also means the market is approaching a zone where a correction could begin, especially if shorter-term indicators are already overextended.
How will the current risk-off sentiment in Nasdaq affect DXY this week?
The Nasdaq 100's decline to 29694.04 at -0.89% typically fuels demand for safe-haven assets like the US dollar. This correlation supports the bullish case for DXY around $100.51, as investors seek stability amidst equity market volatility. However, this effect could be tempered if Fed policy expectations shift.
Track markets in real-time
AI-powered analysis, technical indicators and real-time price data.
Join Our Telegram Channel
Breaking market news, AI analysis and trading signals instantly.
Join Channel