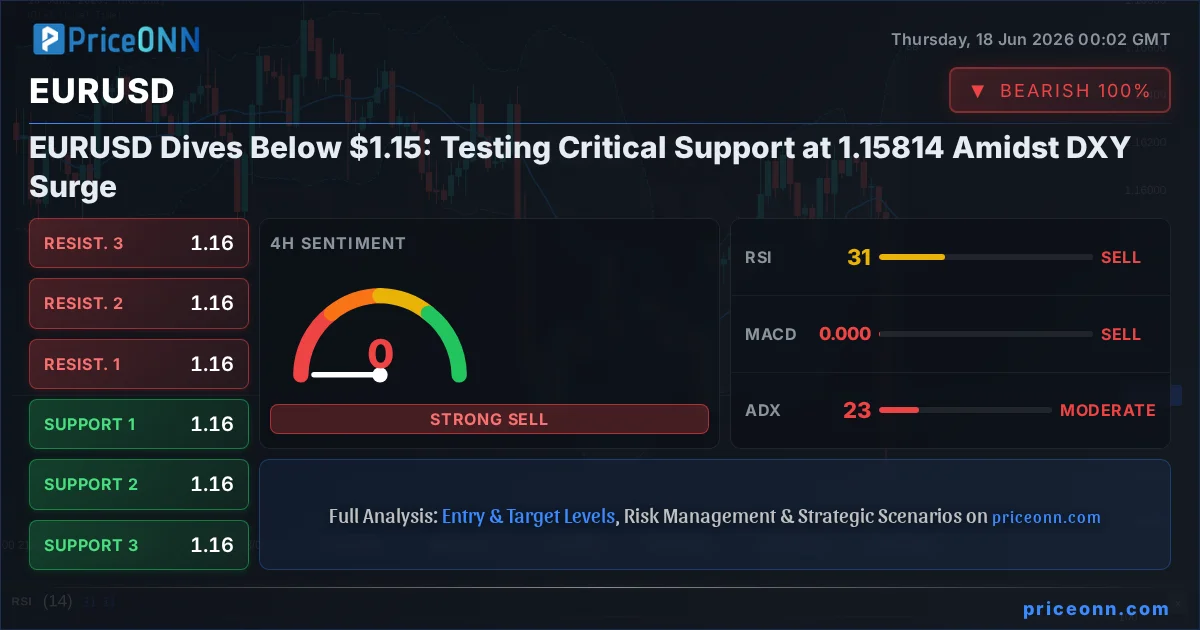
The EURUSD pair is currently navigating a challenging descent, trading below the significant $1.15 handle and testing key support levels. This downward pressure is largely driven by a resurgent US Dollar Index (DXY), which has clawed its way higher, creating headwinds for major currency pairs. As traders digest the latest market movements, the focus sharpens on whether the established support at 1.15814 will hold, or if the bearish momentum will push EURUSD even lower. The interplay between global risk sentiment, central bank expectations, and the relentless strength of the dollar is creating a volatile environment, demanding careful analysis from all market participants.
- EURUSD is trading below $1.15, with immediate support identified at 1.15814.
- The DXY is at 100.41, showing strong upward momentum and increasing pressure on EURUSD.
- 1-Hour RSI at 22.81 suggests oversold conditions, hinting at a potential short-term bounce, but the 1D ADX at 44.88 confirms a strong downtrend.
- Key resistance levels for EURUSD are 1.15061, 1.15084, and 1.15119, while support lies at 1.15003, 1.14968, and 1.14945.
- The prevailing downtrend on the daily chart, coupled with a strong DXY, suggests continued weakness unless key resistance levels are decisively broken.
The narrative surrounding EURUSD is currently dominated by the dollar's impressive resurgence. The Dollar Index (DXY), trading at 100.41, has demonstrated significant strength, fueled by a combination of factors including shifting central bank expectations and a general preference for safe-haven assets. When the DXY strengthens, it typically exerts downward pressure on currencies like the Euro, as seen in EURUSD's current trajectory below $1.15. This correlation is not merely theoretical; it's a fundamental driver of forex markets. The current DXY reading, with its 1H RSI at 77.71 and a strong ADX of 34.61, indicates robust bullish momentum. This implies that as long as the dollar remains on this upward path, EURUSD will likely face an uphill battle, with any rallies being met with selling pressure near resistance.
Digging into the intraday technicals for EURUSD reveals a complex picture, particularly on the shorter timeframes. On the 1-hour chart, the Relative Strength Index (RSI) has plunged to 22.81, firmly within oversold territory. This often signals that a currency pair has fallen too far, too fast, and could be due for a bounce as short-sellers take profits or bargain hunters step in. Compounding this, the Stochastic Oscillator on the same timeframe shows %K (21.98) crossing above %D (20.54), a classic bullish signal. However, this potential for a short-term rebound is starkly contrasted by the persistent negative momentum indicated by the MACD, which remains below its signal line, and the formidable ADX at 44.89, which points to a strong prevailing downtrend that is far from exhausted. This divergence between short-term oversold conditions and a strong overall downtrend is a common trap for traders looking for quick reversals.
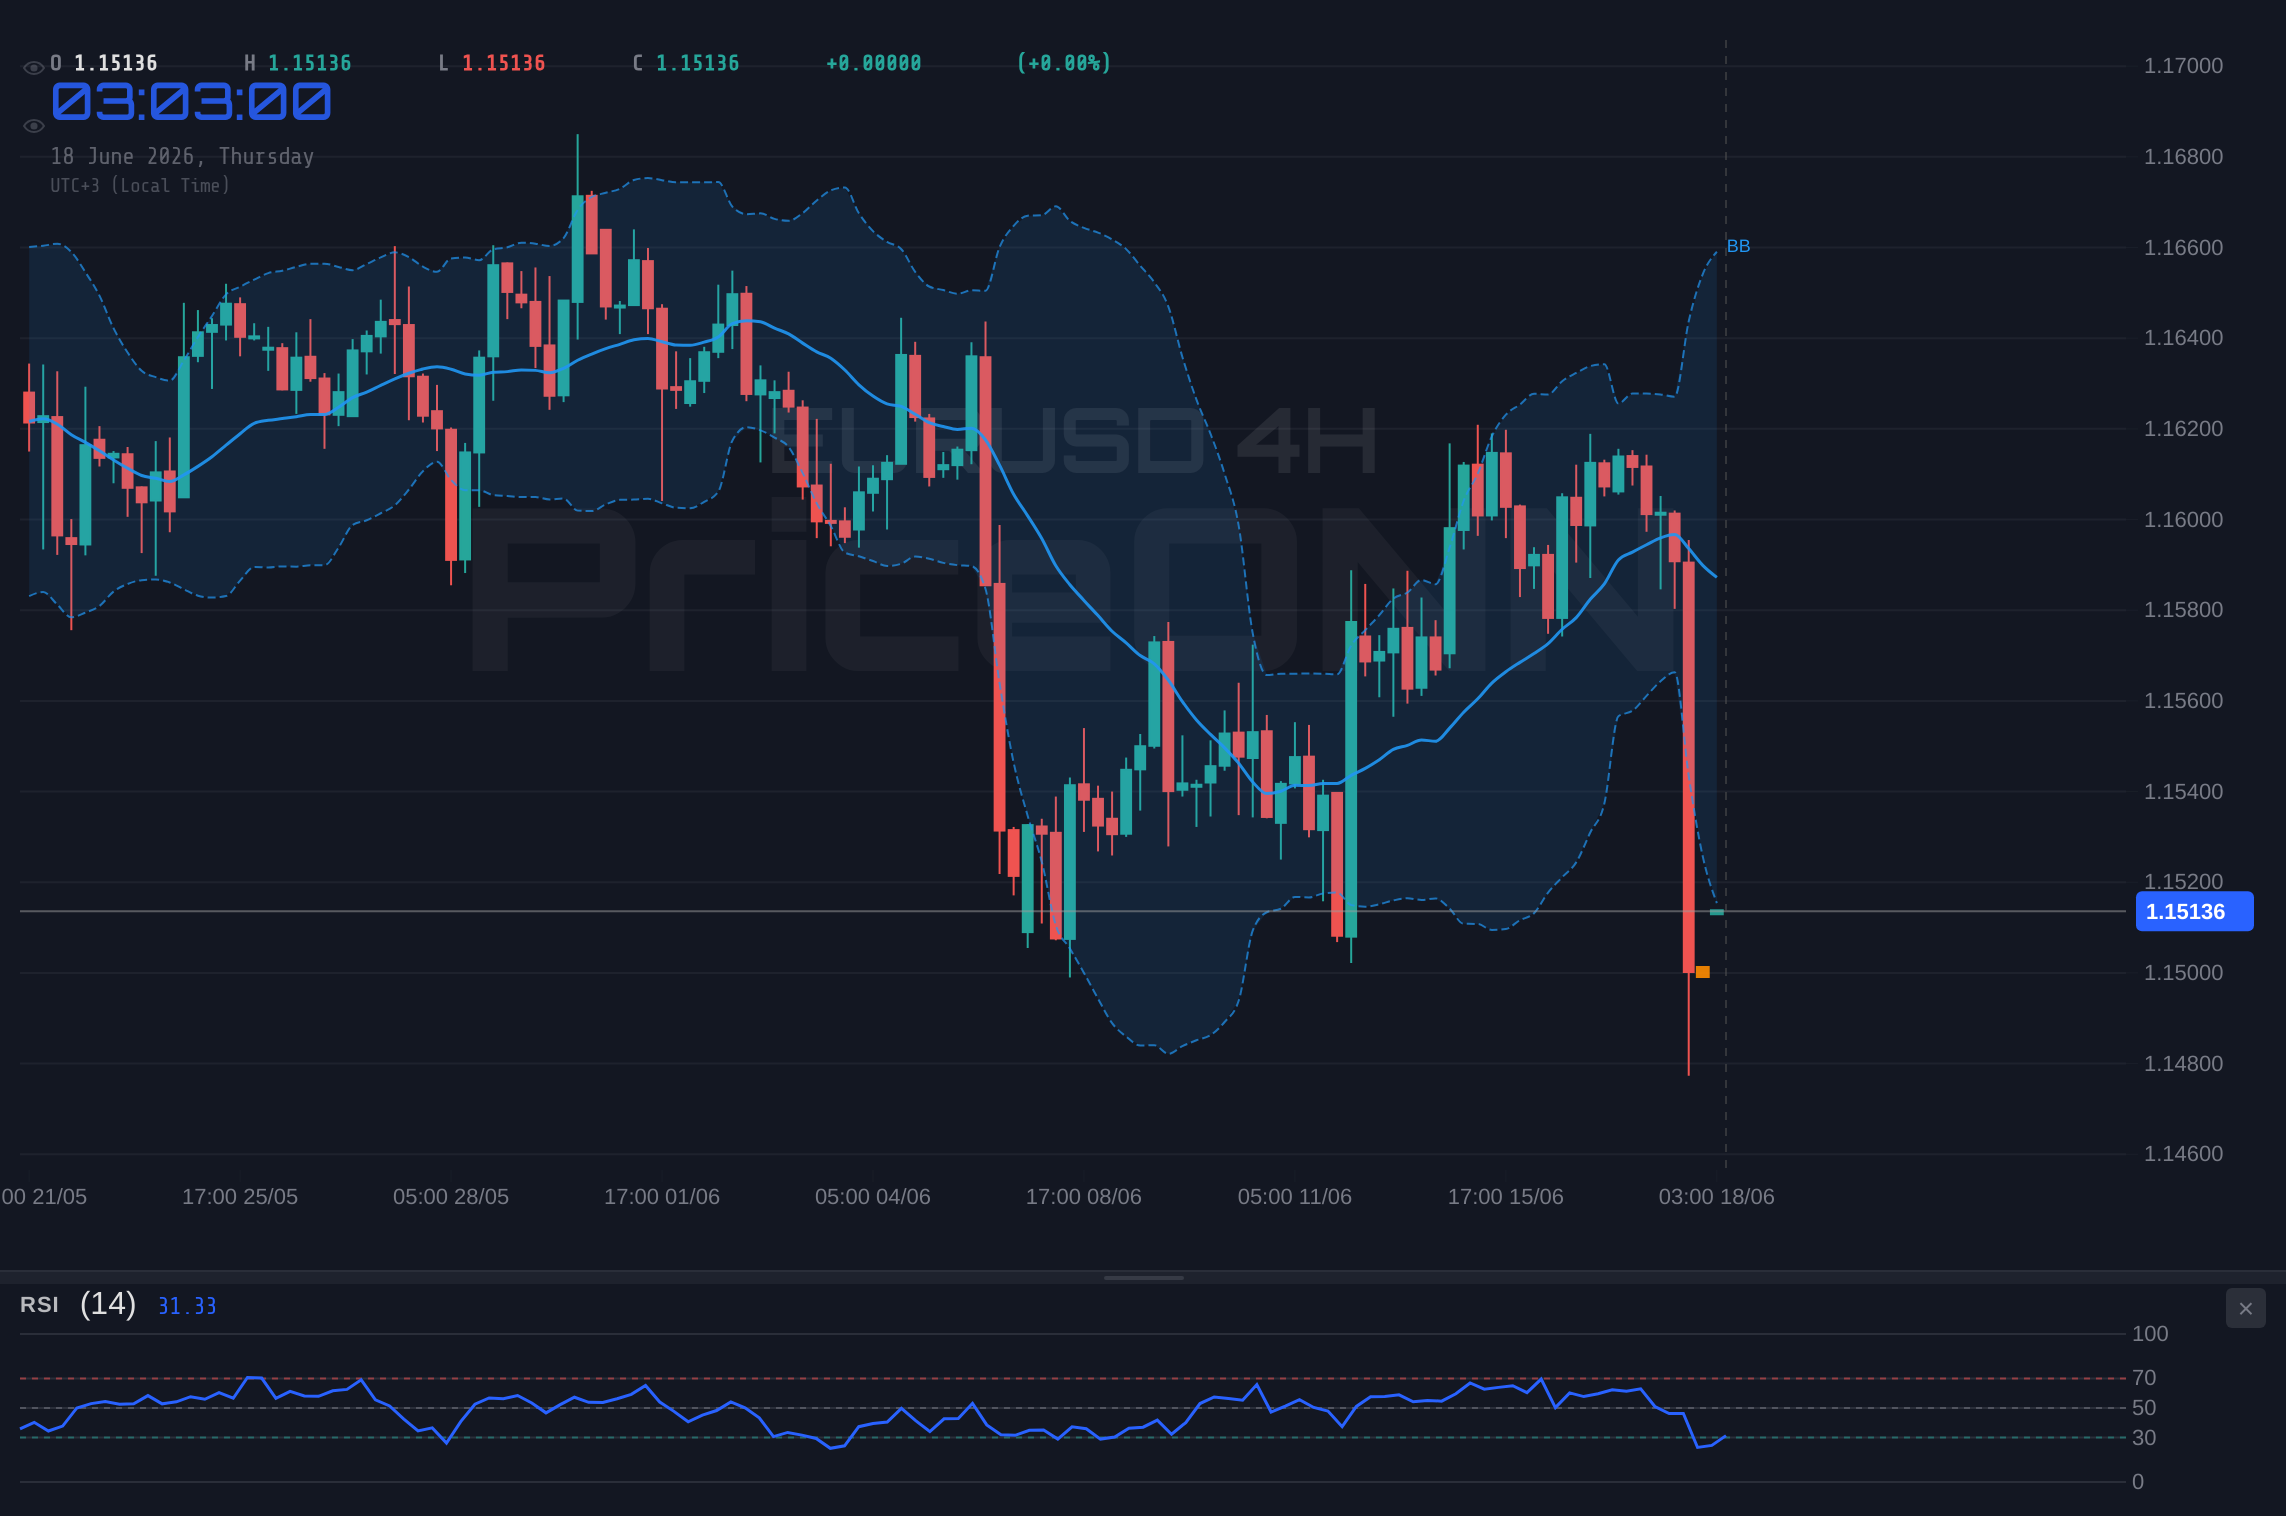
Transitioning to the 4-hour timeframe, the technical landscape for EURUSD presents a slightly different, though still bearish, outlook. The trend is officially categorized as neutral with a strength of 50%, suggesting a lack of decisive direction in this intermediate timeframe. However, the indicators here lean towards caution. The RSI(14) at 30.79 is approaching oversold territory, but it’s still above the extreme levels seen on the 1-hour chart. The MACD continues to show negative momentum, and the ADX at 22.52 indicates a moderate downtrend, less aggressive than the 1-hour but still significant. The Stochastic Oscillator here shows %K (38.13) below %D (66.35), which is a bearish signal in this context, contradicting the short-term oversold readings. The Bollinger Bands are hugging the lower side of the middle band, reinforcing the bearish bias. Overall, the 4-hour chart suggests that while a short-term bounce might be possible, the medium-term trend is not yet showing signs of a reversal.
The Daily Chart: A Strong Bearish Undercurrent
The daily timeframe provides the most critical context for understanding the sustained pressure on EURUSD. Here, the trend is definitively classified as bearish, with a high strength of 81%. This is underpinned by a daily RSI(14) reading of 36.82, which, while not deeply oversold, clearly indicates a downward bias and considerable room for further decline before reaching extreme levels. The MACD histogram continues to print negative values, with the MACD line stubbornly below its signal line, confirming the persistent selling pressure. The ADX value of 21.75 on the daily chart signifies a moderate but established downtrend, suggesting that the current move is not a mere blip but part of a larger bearish move. The Stochastic Oscillator, with %K at 50.09 and %D at 41.29, is showing a potential for a bounce as %K crosses above %D, but this signal is occurring within a bearish trend and needs significant confirmation from other indicators or price action to be considered reliable.
The current price action around the $1.15 mark is crucial. The primary support level on the 1-hour chart is identified at 1.15003, with further S2 at 1.14968 and S3 at 1.14945. These levels represent the immediate floor. However, the daily support levels paint a more significant picture: S1 at 1.15814, S2 at 1.15554, and S3 at 1.15367. The fact that EURUSD is currently trading below $1.15 means it has already breached the first daily support level of 1.15814, intensifying the bearish sentiment. This breach of a key support level often acts as a catalyst for further selling, as it can trigger stop-loss orders and attract new sellers who see it as confirmation of the downtrend. The ability of price to reclaim levels above 1.15814 will be a critical determinant of whether this downward move is a temporary dip or the start of a more significant decline.
On the resistance side, the immediate hurdles are the 1-hour levels: R1 at 1.15061, R2 at 1.15084, and R3 at 1.15119. These are relatively close to the current price and represent areas where a short-term bounce might stall. More importantly, the daily resistance levels are located at 1.16261 (R1), 1.16448 (R2), and 1.16708 (R3). For the bearish thesis to be invalidated, EURUSD would need to decisively break through these daily resistance levels, particularly R1 at 1.16261. Such a move would signal a potential shift in momentum and the beginning of a recovery. Until then, any rallies are likely to be capped by these resistance zones, especially given the prevailing dollar strength and the bearish technical signals on the longer timeframes.
The Impact of a Strong DXY on Gold and Equities
The robust performance of the DXY has a ripple effect across global markets, most notably on gold (XAUUSD) and equity indices like the S&P 500 and Nasdaq. With the DXY currently at 100.41 and showing strong upward momentum, gold prices have experienced significant pressure. The live data shows XAUUSD at 4279.32, down 1.2% for the day. This inverse correlation is a well-established market dynamic: a stronger dollar makes dollar-denominated assets like gold more expensive for holders of other currencies, thus dampening demand. Furthermore, a strong dollar often coincides with rising US Treasury yields, which increases the opportunity cost of holding non-yielding assets like gold. This environment is challenging for gold bugs, as the dollar's strength appears to be overshadowing any safe-haven demand that might otherwise emerge from geopolitical tensions or inflation concerns.
Similarly, the strength of the dollar exerts a drag on major US equity indices. The S&P 500, trading at 6572.87, is up 0.74% today, while the Nasdaq 100 is up 0.14% at 30004.5. However, the underlying correlation suggests that sustained dollar strength, particularly when driven by expectations of tighter monetary policy or rising yields, can eventually weigh on corporate earnings and investor sentiment. While the immediate equity reaction might seem positive, the longer-term implication of a persistently strong dollar can be a headwind for multinational corporations that derive a significant portion of their revenue from overseas markets. A stronger dollar means those foreign earnings translate into fewer dollars when repatriated, impacting profitability. This dynamic creates a complex interplay where a strong dollar can simultaneously support US assets through safe-haven flows while also posing a risk to growth-oriented sectors.
Considering the broader economic context, the current market environment is shaped by ongoing debates about inflation and central bank policy. While recent data might suggest some easing of price pressures, the persistent strength of the dollar could be interpreted as a sign that markets are anticipating a more hawkish stance from the Federal Reserve, or at least a slower pace of rate cuts than previously expected. This anticipation can lead to higher bond yields, which in turn supports the dollar. The recent news about falling oil prices, as reported by JP Morgan, could provide a tailwind for global stock markets by potentially easing inflation concerns. However, if the dollar's strength is primarily driven by yield differentials, then the impact on equities might be more muted or even negative in the short to medium term. This complex web of correlations and macroeconomic factors requires a nuanced approach, where technical signals are used to confirm rather than dictate the primary direction.
Analyzing the Technical Signals: A Mixed Bag with a Bearish Lean
When we consolidate the technical indicators across multiple timeframes for EURUSD, a picture emerges that is largely bearish, albeit with nuances. The 1-hour chart, while showing oversold conditions on RSI and Stochastic, is dominated by a strong ADX (44.89) and negative MACD momentum, signaling a powerful downtrend. The 4-hour chart offers a more neutral perspective on trend strength (ADX 22.52) but still leans bearish with negative MACD and RSI below 40. The daily chart, however, paints the clearest bearish picture, with a strong ADX (21.75) and RSI below 40, confirming the prevailing downward bias. The general signal across all timeframes, weighted by trend strength and indicator confluence, leans heavily towards selling. The sheer strength of the DXY at 100.41 further reinforces this bearish outlook for EURUSD.
The Stochastic Oscillator provides particularly interesting, albeit conflicting, signals. On the 1-hour chart, it shows a potential bullish crossover as %K moves above %D, coinciding with oversold RSI. This suggests a possible short-term bounce is brewing. However, on the 4-hour chart, the Stochastic shows a bearish crossover (%K below %D), and on the daily chart, it's showing a bullish crossover again (%K above %D). This inconsistency highlights the choppiness of the market and the importance of not relying on a single indicator. The ADX, on the other hand, provides a more consistent message: it's at 44.89 on the 1H, 22.52 on the 4H, and 21.75 on the 1D. While it shows a very strong trend on the shortest timeframe, it moderates to a moderate trend on the longer ones, suggesting the aggressive downtrend might be losing some steam, but the overall direction remains down.
The Bollinger Bands further support the bearish sentiment. Across all timeframes (1H, 4H, 1D), the price is trading below the middle band, indicating downward pressure. On the 1-hour chart, the bands are relatively wide, suggesting recent volatility, but the price action remains confined to the lower half. On the daily chart, the band is widening slightly as price moves lower, which is typical during a strong trend. For any bullish reversal to gain traction, EURUSD would need to consistently trade back above the middle Bollinger Band on the daily chart, a level that currently acts as dynamic resistance. Until then, the path of least resistance appears to be to the downside, especially with the DXY's current strength.
Trade Scenarios for EURUSD: Navigating the Current Market Landscape
Given the current technical setup and the prevailing market sentiment, we can outline three primary scenarios for EURUSD. The decision to trade will depend on which scenario unfolds and aligns with your risk tolerance and strategy. The dominant trend on the daily chart, supported by the strong DXY, suggests a bearish bias is the most probable outcome, but the oversold conditions on shorter timeframes cannot be entirely ignored.
Bearish Scenario: Downside Momentum Continues
65% ProbabilityNeutral Scenario: Consolidation and Range-Bound Trading
25% ProbabilityBullish Scenario: Short-Covering Rally
10% ProbabilityThe bearish scenario appears the most likely path, given the daily trend strength and the DXY's current trajectory. A break and hold below the 1.15814 support level would confirm this thesis, potentially opening the door for targets at 1.15554 and 1.15367. Traders should watch for confirmation through increased volume on the downside break and sustained negative momentum in indicators like MACD on the daily chart. The neutral scenario, involving range-bound trading between the 1-hour support at 1.15003 and daily resistance at 1.16261, is a possibility if the market consolidates before the next major economic catalyst. This could lead to choppy price action, with short-term bounces from oversold conditions being sold into resistance. The bullish scenario is the least probable at this juncture, requiring a decisive break above immediate resistance levels and a significant shift in market sentiment, potentially driven by unexpected dovish commentary from the Fed or a sharp reversal in the DXY.
Looking Ahead: Economic Calendar and Market Drivers
The upcoming economic calendar holds several potential catalysts that could influence the direction of EURUSD. While specific dates for major upcoming events like Fed policy meetings or key inflation reports are not provided in the current data, investors are constantly evaluating central bank rhetoric and economic indicators. The strength of the DXY, currently at 100.41, suggests that market participants may be pricing in a more hawkish outlook from the Federal Reserve than anticipated, or perhaps a slower path to rate cuts. Any hint of dovishness from the ECB, or conversely, any further hawkish signals from the Fed, could exacerbate the current trend. Traders will be closely monitoring any statements from Fed officials for clues on future monetary policy direction.
Furthermore, geopolitical developments, though not explicitly detailed in the provided data, always play a role in currency markets, particularly those involving major economies or energy supplies. Recent news snippets indicate ongoing discussions around geopolitical shifts and their impact on energy prices, which indirectly affect inflation expectations and central bank policy. For instance, reports about falling oil prices could ease some inflationary pressures, potentially influencing central bank decisions. However, the current DXY strength seems to be the dominant narrative, suggesting that domestic US economic factors and Fed policy expectations are taking precedence in driving the dollar's value relative to the Euro.
The correlation between EURUSD and the DXY remains a critical factor to watch. As the DXY continues its ascent, EURUSD faces downward pressure. A sustained move above the 100.41 mark for the DXY, coupled with strong daily technicals, would reinforce the bearish outlook for EURUSD. Conversely, a significant reversal in the DXY, perhaps triggered by dovish Fed commentary or a sudden shift in global risk sentiment towards a more risk-on environment, could provide the necessary catalyst for EURUSD to stage a recovery. Until such a shift occurs, the path of least resistance for EURUSD appears to be lower, with key support levels on the daily chart being the immediate focus for traders.
Frequently Asked Questions: EURUSD Analysis
What happens if EURUSD breaks below the 1.15367 support level?
If EURUSD breaks decisively below the 1.15367 support level (Daily S3), it would confirm a strong bearish continuation. This would likely trigger further stop-loss orders and could see the pair testing even lower levels, potentially targeting the 1.14500 psychological mark. The prevailing strong downtrend on the daily chart and the high ADX value of 21.75 support this bearish outlook.
Should I consider buying EURUSD at current levels around $1.15 given the 1-hour RSI at 22.81?
While the 1-hour RSI at 22.81 suggests oversold conditions and a potential for a short-term bounce, it's a risky strategy given the dominant daily downtrend and strong DXY. A more prudent approach would be to wait for confirmation, such as a close above the 1.15814 daily support level or a clear bullish divergence across multiple timeframes, before considering a buy. The probability of a sustained rally from current levels without these confirmations is low.
Is the MACD signal on the daily chart a sell signal for EURUSD?
Yes, the MACD on the daily chart is currently showing negative momentum, with the MACD line below its signal line. This is a bearish signal, indicating that selling pressure is dominant. Coupled with the RSI at 36.82 and a strong ADX of 21.75, this technical configuration reinforces the bearish outlook for EURUSD, suggesting that downward moves are more likely than upward ones in the near term.
How will the strong DXY at 100.41 impact EURUSD in the coming days?
The strong DXY at 100.41 is a significant headwind for EURUSD. It implies that the US dollar is in demand, likely due to factors like higher US interest rate expectations or safe-haven flows. This strength will likely continue to pressure EURUSD downwards, making rallies harder to sustain. Any significant move higher in EURUSD would likely require a reversal or consolidation in the DXY, possibly triggered by upcoming economic data or central bank policy shifts.
Bearish Scenario: Downside Momentum Continues
65% ProbabilityNeutral Scenario: Consolidation and Range-Bound Trading
25% ProbabilityBullish Scenario: Short-Covering Rally
10% ProbabilityThe technical indicators across multiple timeframes paint a predominantly bearish picture for EURUSD, with the daily chart showing a strong downtrend (ADX 21.75) and RSI below 40. The strength of the DXY at 100.41 further supports this view, indicating that dollar demand remains high. While short-term oversold conditions on the 1-hour chart (RSI 22.81) might offer a brief reprieve, the overall trend suggests that rallies are likely to be sold into. The critical level to watch is 1.15814; a sustained break below this point would solidify the bearish scenario, potentially leading to further declines towards 1.15554 and 1.15367. Traders should maintain a cautious approach, favoring short positions on pullbacks and waiting for clear confirmation before considering any long entries.
Track markets in real-time
AI-powered analysis, technical indicators and real-time price data.
Join Our Telegram Channel
Breaking market news, AI analysis and trading signals instantly.
Join Channel