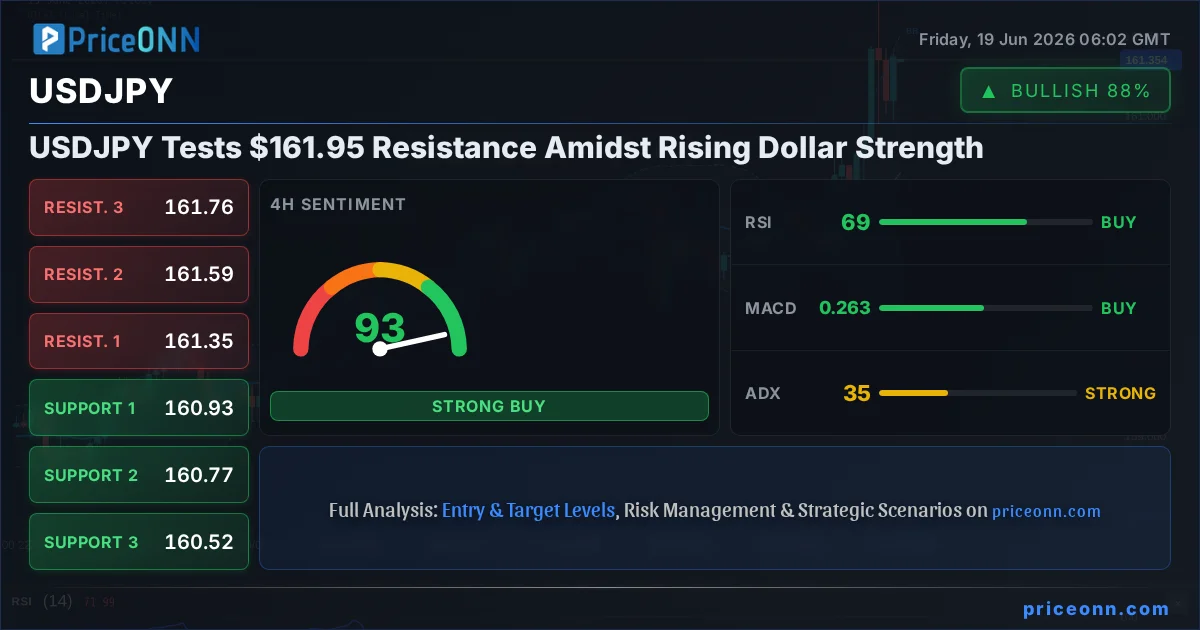
The relentless ascent of the US dollar, underscored by the Dollar Index (DXY) pushing higher towards 101.15, is casting a long shadow over global currency markets. For USDJPY, this presents a critical juncture. Currently trading at $161.33, the pair is inching closer to the significant $161.95 resistance level. This isn't just a technical observation; it's a narrative being written by shifting central bank expectations and a renewed appetite for safe-haven assets, which paradoxically benefits the dollar in this environment. The interplay between the Bank of Japan's accommodative stance and the Federal Reserve's hawkish undertones creates a fertile ground for USD strength, making the upcoming price action for USDJPY a key focus for traders worldwide.
- USDJPY is approaching the critical $161.95 resistance level, currently trading at $161.33.
- The DXY is showing strong upward momentum, reaching 101.15, which typically pressures pairs like USDJPY.
- The 1D RSI at 69.21 indicates a strong bullish trend but also approaches overbought territory, signaling caution for further immediate upside.
- Key support for USDJPY is established at $160.61, while resistance looms at $161.95 and $162.55.
- A break above $161.95 could target $162.55, but a failure to hold $160.61 support would negate the bullish outlook.
The narrative driving USDJPY higher is multifaceted, deeply rooted in the diverging monetary policies of the Federal Reserve and the Bank of Japan. While the Fed has maintained a hawkish bias, signaling a potential pause or even a pivot only under specific economic conditions, the Bank of Japan continues to navigate its unique path of ultra-loose monetary policy. This divergence creates a natural tailwind for the dollar against the yen. Recent market sentiment, as reflected in the S&P 500's upward movement to 6572.87, suggests a degree of risk appetite, which can often support carry trades like USDJPY. However, the underlying strength of the dollar, as indicated by the DXY's climb, suggests that this pair's upward trajectory might be more driven by dollar strength than by a weakening yen alone. Understanding this dynamic is crucial for traders looking to navigate the upcoming price action.
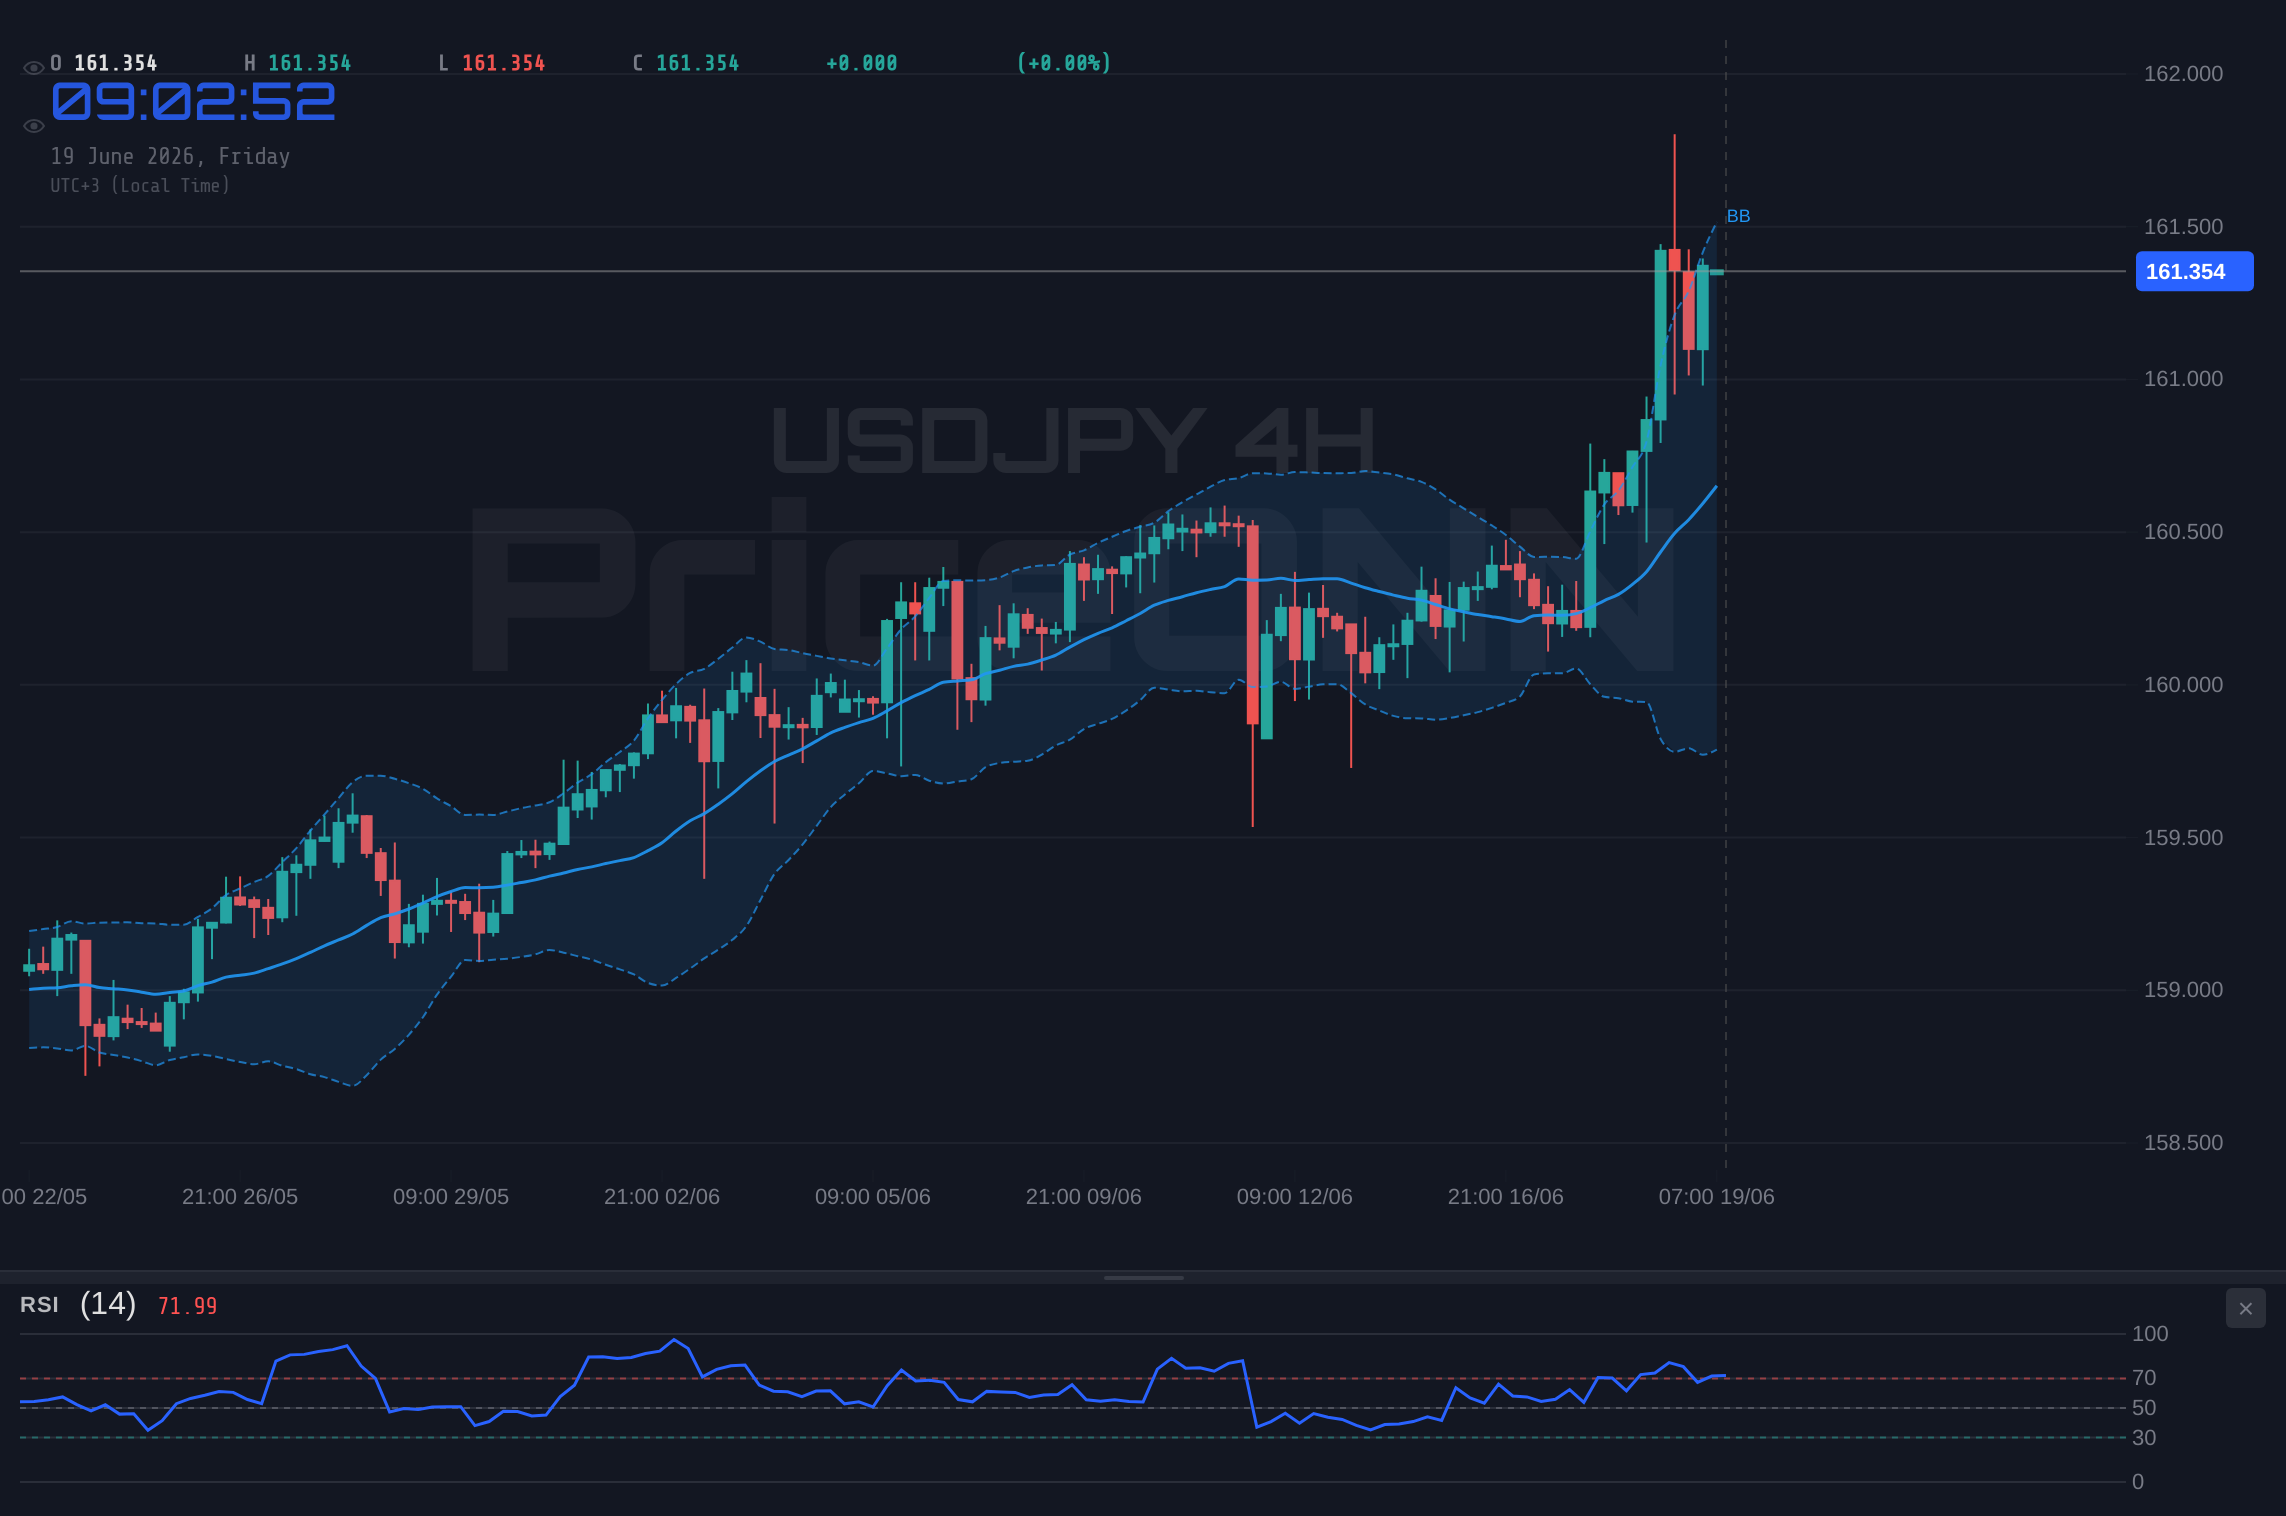
Technically, the picture for USDJPY is one of a dominant uptrend, albeit one that is approaching a significant hurdle. On the daily chart, the trend is clearly defined as bullish, with a strength rating of 92%. The current price of $161.33 hovers above the middle Bollinger Band, which itself is trending upwards, reinforcing the bullish sentiment. The Relative Strength Index (RSI) is sitting at 69.21, firmly in neutral territory but showing a strong upward bias, suggesting room for further gains before reaching overbought conditions. However, the Stochastic Oscillator, with %K at 82.39 and %D at 75.95, is already in overbought territory, hinting at a potential for a short-term pullback or consolidation as buyers might pause to take profits. The Average Directional Index (ADX) at 14.91 indicates a weaker trend, which is somewhat counterintuitive to the strong bullish signals from other indicators, suggesting that while the upward momentum exists, the trend's conviction may not be as robust as the price action implies.
Delving deeper into the intraday dynamics, the 1-hour chart paints a picture of a strong, immediate bullish push. The trend is unequivocally bullish with 100% strength. The RSI is at 60.68, indicating healthy upward momentum without being excessively overbought. The Bollinger Bands are expanding slightly, with the price trading above the middle band, confirming the bullish bias. The Stochastic Oscillator, with %K at 67.57 and %D at 41.5, shows a clear bullish signal, with %K well above %D and not yet in extreme territory. This suggests that the immediate upward pressure could continue. However, the MACD, while showing positive momentum, has its histogram below the signal line, which can sometimes precede a slight cooling off or consolidation. The ADX at 20.5 suggests a moderately trending market, supporting the idea that the current move has some legs, but it's not an explosive trend yet.
The 4-hour timeframe offers a slightly more nuanced view, confirming the overall bullish trend but highlighting areas of caution. Here, the trend is rated at 93% bullish. The RSI at 68.92 is approaching the overbought threshold, suggesting that further significant upside might require a period of consolidation or a pullback to reset momentum. The MACD histogram is positive and above the signal line, supporting the bullish case. However, the Stochastic Oscillator, with %K at 67.26 and %D at 82.64, is showing a bearish divergence, with %K below %D and in the overbought zone. This is a classic sign of potential weakening momentum and a possible reversal or consolidation in the short to medium term. The ADX at 35.2 indicates a strong trend, which means that even if there's a pullback, the underlying bullish pressure might remain intact, leading to a retracement rather than a full reversal.
The correlation with the Dollar Index (DXY) is a crucial element in understanding USDJPY's trajectory. The DXY is currently trading at 101.07 and has shown a strong upward movement, with its 1-hour trend rated at 100% bullish and its 1-day trend at 91% bullish. The DXY's daily RSI is at a lofty 72.96, bordering on overbought, and the ADX is a very strong 32.38. This robust dollar strength typically exerts downward pressure on pairs like USDJPY. However, in this specific case, the bullish trend in USDJPY appears to be strong enough to either absorb the dollar's strength or perhaps even be driven by it, suggesting that the yen is weakening more significantly than other major currencies against the dollar. This highlights the unique dynamics at play, where the carry trade appeal of USDJPY might be overriding the typical inverse correlation with a strengthening DXY.
Looking at other correlated assets provides further context. The S&P 500 is currently trading at 6572.87 with a daily trend showing a 100% bearish signal, despite a 0.74% intraday gain. This mixed signal in equities suggests caution in risk appetite. If risk aversion were to significantly increase, it could lead to a flight to safety, potentially benefiting the yen as a safe-haven currency, which would then put downward pressure on USDJPY. Conversely, if the S&P 500 manages to sustain its gains, it could indicate a broader risk-on sentiment that might continue to support USDJPY. The Nasdaq, currently at 30165.26, also shows a mixed picture, with a strong 92% bullish trend on the daily chart but conflicting signals on shorter timeframes, indicating underlying uncertainty in the tech sector which often leads market sentiment.
Brent crude oil, trading at $80.17, is showing a 1.18% gain and a 98% bearish trend on the daily chart, despite intraday bullishness. This suggests that inflationary pressures, potentially linked to geopolitical risks or supply concerns, might be a backdrop to the current market. While oil prices can influence inflation expectations and subsequently central bank policy, their direct impact on USDJPY is often secondary to monetary policy divergence. However, a significant spike in oil prices could reignite inflation concerns, potentially forcing the Fed to adopt a more hawkish stance, which would further bolster the dollar and, by extension, USDJPY.
Given the confluence of strong bullish signals on shorter timeframes, the persistent divergence in monetary policy, and the current price action approaching a key resistance, a multi-scenario approach is prudent. The market is at a crossroads, with the potential for a continuation of the uptrend if resistance breaks, or a consolidation or pullback if it holds. The strength of the DXY and the mixed signals from equity markets add layers of complexity, requiring traders to remain vigilant and have well-defined risk management strategies in place. The ADX readings across different timeframes, while indicating strong trends on 1H and 4H, show a weaker trend on the daily, suggesting that the current bullish move might face significant headwinds as it approaches higher resistance levels.
Bearish Scenario: Resistance Holds Firm
60% ProbabilityNeutral Scenario: Consolidation Near Resistance
30% ProbabilityBullish Scenario: Resistance Breakout
10% ProbabilityThe technical indicators, while generally supportive of a bullish trend, are flashing warnings that cannot be ignored. The daily RSI at 69.21 is strong but approaching overbought territory. The Stochastic Oscillator on the daily chart is already deep in overbought conditions, and the 4-hour Stochastic shows bearish divergence. This suggests that while the immediate pressure might be to the upside, the sustainability of a further rally without a significant pullback or consolidation is questionable. The ADX on the daily chart (14.91) indicates a weak trend, which means that a move above resistance might not be sustained without further confirmation or a shift in market sentiment. Therefore, traders should exercise caution and look for clear confirmation signals before committing to a direction.
The current market environment, characterized by strong dollar sentiment and diverging central bank policies, favors continued strength in USDJPY. However, the proximity to significant resistance levels ($161.95 and $162.55) and the mixed signals from shorter-term oscillators warrant a measured approach. The $160.61 support level on the daily chart is critical. A failure to hold this level would likely trigger a more substantial retracement, invalidating the current bullish thesis. Conversely, a decisive break and hold above $161.95, supported by strong volume and positive DXY momentum, could pave the way for further upside towards $162.55 and potentially higher.
The recent news flow, while not directly impacting USDJPY, paints a broader picture of market conditions. Reports on electricity being a bottleneck for AI suggest underlying inflationary pressures that could keep central banks on edge. Similarly, the stalling UK jobs growth and easing wage pressures, alongside the volatility in crude oil prices, highlight the complex and often contradictory economic data landscape. These factors contribute to the overall uncertainty and can influence risk appetite, indirectly affecting USDJPY through its correlation with the DXY and broader market sentiment. Traders must remain adaptable, constantly reassessing the data and technicals as new information unfolds.
Frequently Asked Questions: USDJPY Analysis
What happens if USDJPY breaks above the $161.95 resistance level?
A decisive break and hold above $161.95, confirmed by strong volume, could target the next resistance at $162.55, and potentially higher towards $163.29. This bullish scenario would be invalidated if price closes back below $161.33.
Is the RSI at 69.21 a sell signal for USDJPY right now?
An RSI of 69.21 on the daily chart indicates strong bullish momentum but is approaching overbought territory. It's not an immediate sell signal, but it suggests caution for further immediate upside and highlights the potential for consolidation or a pullback if resistance holds.
Should I consider a bearish trade if USDJPY fails to break $161.95 resistance?
Yes, a failure to break $161.95 resistance presents a bearish setup. The trigger would be the price failing to hold above $161.33, with targets at $161.33 (retest) and the key daily support at $160.61. This scenario is invalidated by a close above $162.55.
How is the rising DXY at 101.15 impacting USDJPY's current move towards $161.95?
The DXY's strong upward momentum towards 101.15 typically exerts downward pressure on USDJPY. However, the current bullish trend in USDJPY suggests that dollar strength might be a primary driver, or that the yen is weakening more significantly. This correlation is key to watch as USDJPY approaches resistance.
Track markets in real-time
AI-powered analysis, technical indicators and real-time price data.
Join Our Telegram Channel
Breaking market news, AI analysis and trading signals instantly.
Join Channel