The relentless march of the bears continues to cast a shadow over the silver market, with XAGUSD currently teetering at the $65.81 mark. This price point represents a critical juncture, as the precious metal battles to hold onto key support levels amidst a prevailing bearish sentiment. For traders and investors alike, understanding the intricate dance between technical indicators, macroeconomic undercurrents, and market sentiment is paramount. The current price action paints a stark picture: a market under pressure, with sellers dictating the narrative across various timeframes. From the short-term 1-hour chart to the longer-term daily perspective, the signals overwhelmingly point towards a continuation of the downtrend, though the exact magnitude and duration remain subjects of intense analysis.
- RSI at 30.54 on the 1H chart signals extreme oversold conditions, hinting at potential short-term consolidation but not yet a reversal.
- The ADX at 33.93 on the 1H timeframe indicates a strong downtrend is in play, suggesting momentum is firmly with the sellers.
- Key support for XAGUSD is currently holding around $65.68, with a decisive break below this level opening the door for further declines.
- The broader correlation with a strengthening US Dollar Index (DXY), currently at 100.9, is adding headwinds for silver prices.
The technical landscape for XAGUSD is a study in bearish dominance, particularly when examining the shorter timeframes. On the 1-hour chart, the trend is unequivocally downward, boasting an impressive 100% strength. This is not a market characterized by indecision; sellers have established a firm grip. The immediate support level to watch is $65.68, followed by $65.55 and $65.31. Each of these levels represents a potential floor, but the prevailing momentum suggests they are more likely to be breached than to hold firm. Resistance, on the other hand, is found at $66.05, $66.28, and $66.41. For a bullish reversal to even be considered, a sustained push above these resistance points would be necessary, a scenario that current indicators do not support.
Diving deeper into the indicators on this 1-hour timeframe reveals a consistent bearish bias. The Relative Strength Index (RSI) at 30.54 hovers in oversold territory, a classic signal that can sometimes precede a bounce, but within the context of a strong downtrend, it often signifies simply that the selling pressure is intense. The MACD is firmly in negative territory, with the MACD line below its signal line, reinforcing the bearish momentum. The Bollinger Bands are also painting a grim picture, with price trading below the middle band, indicating a bearish inclination. Even more telling is the Stochastic oscillator, with %K at 14.68 and %D at 11.22, firmly entrenched in the oversold region, suggesting further downside potential before any significant reprieve. The Average Directional Index (ADX) at 33.93 further confirms the strength of the current downtrend, indicating that this is not a sideways chop but a committed move by sellers.
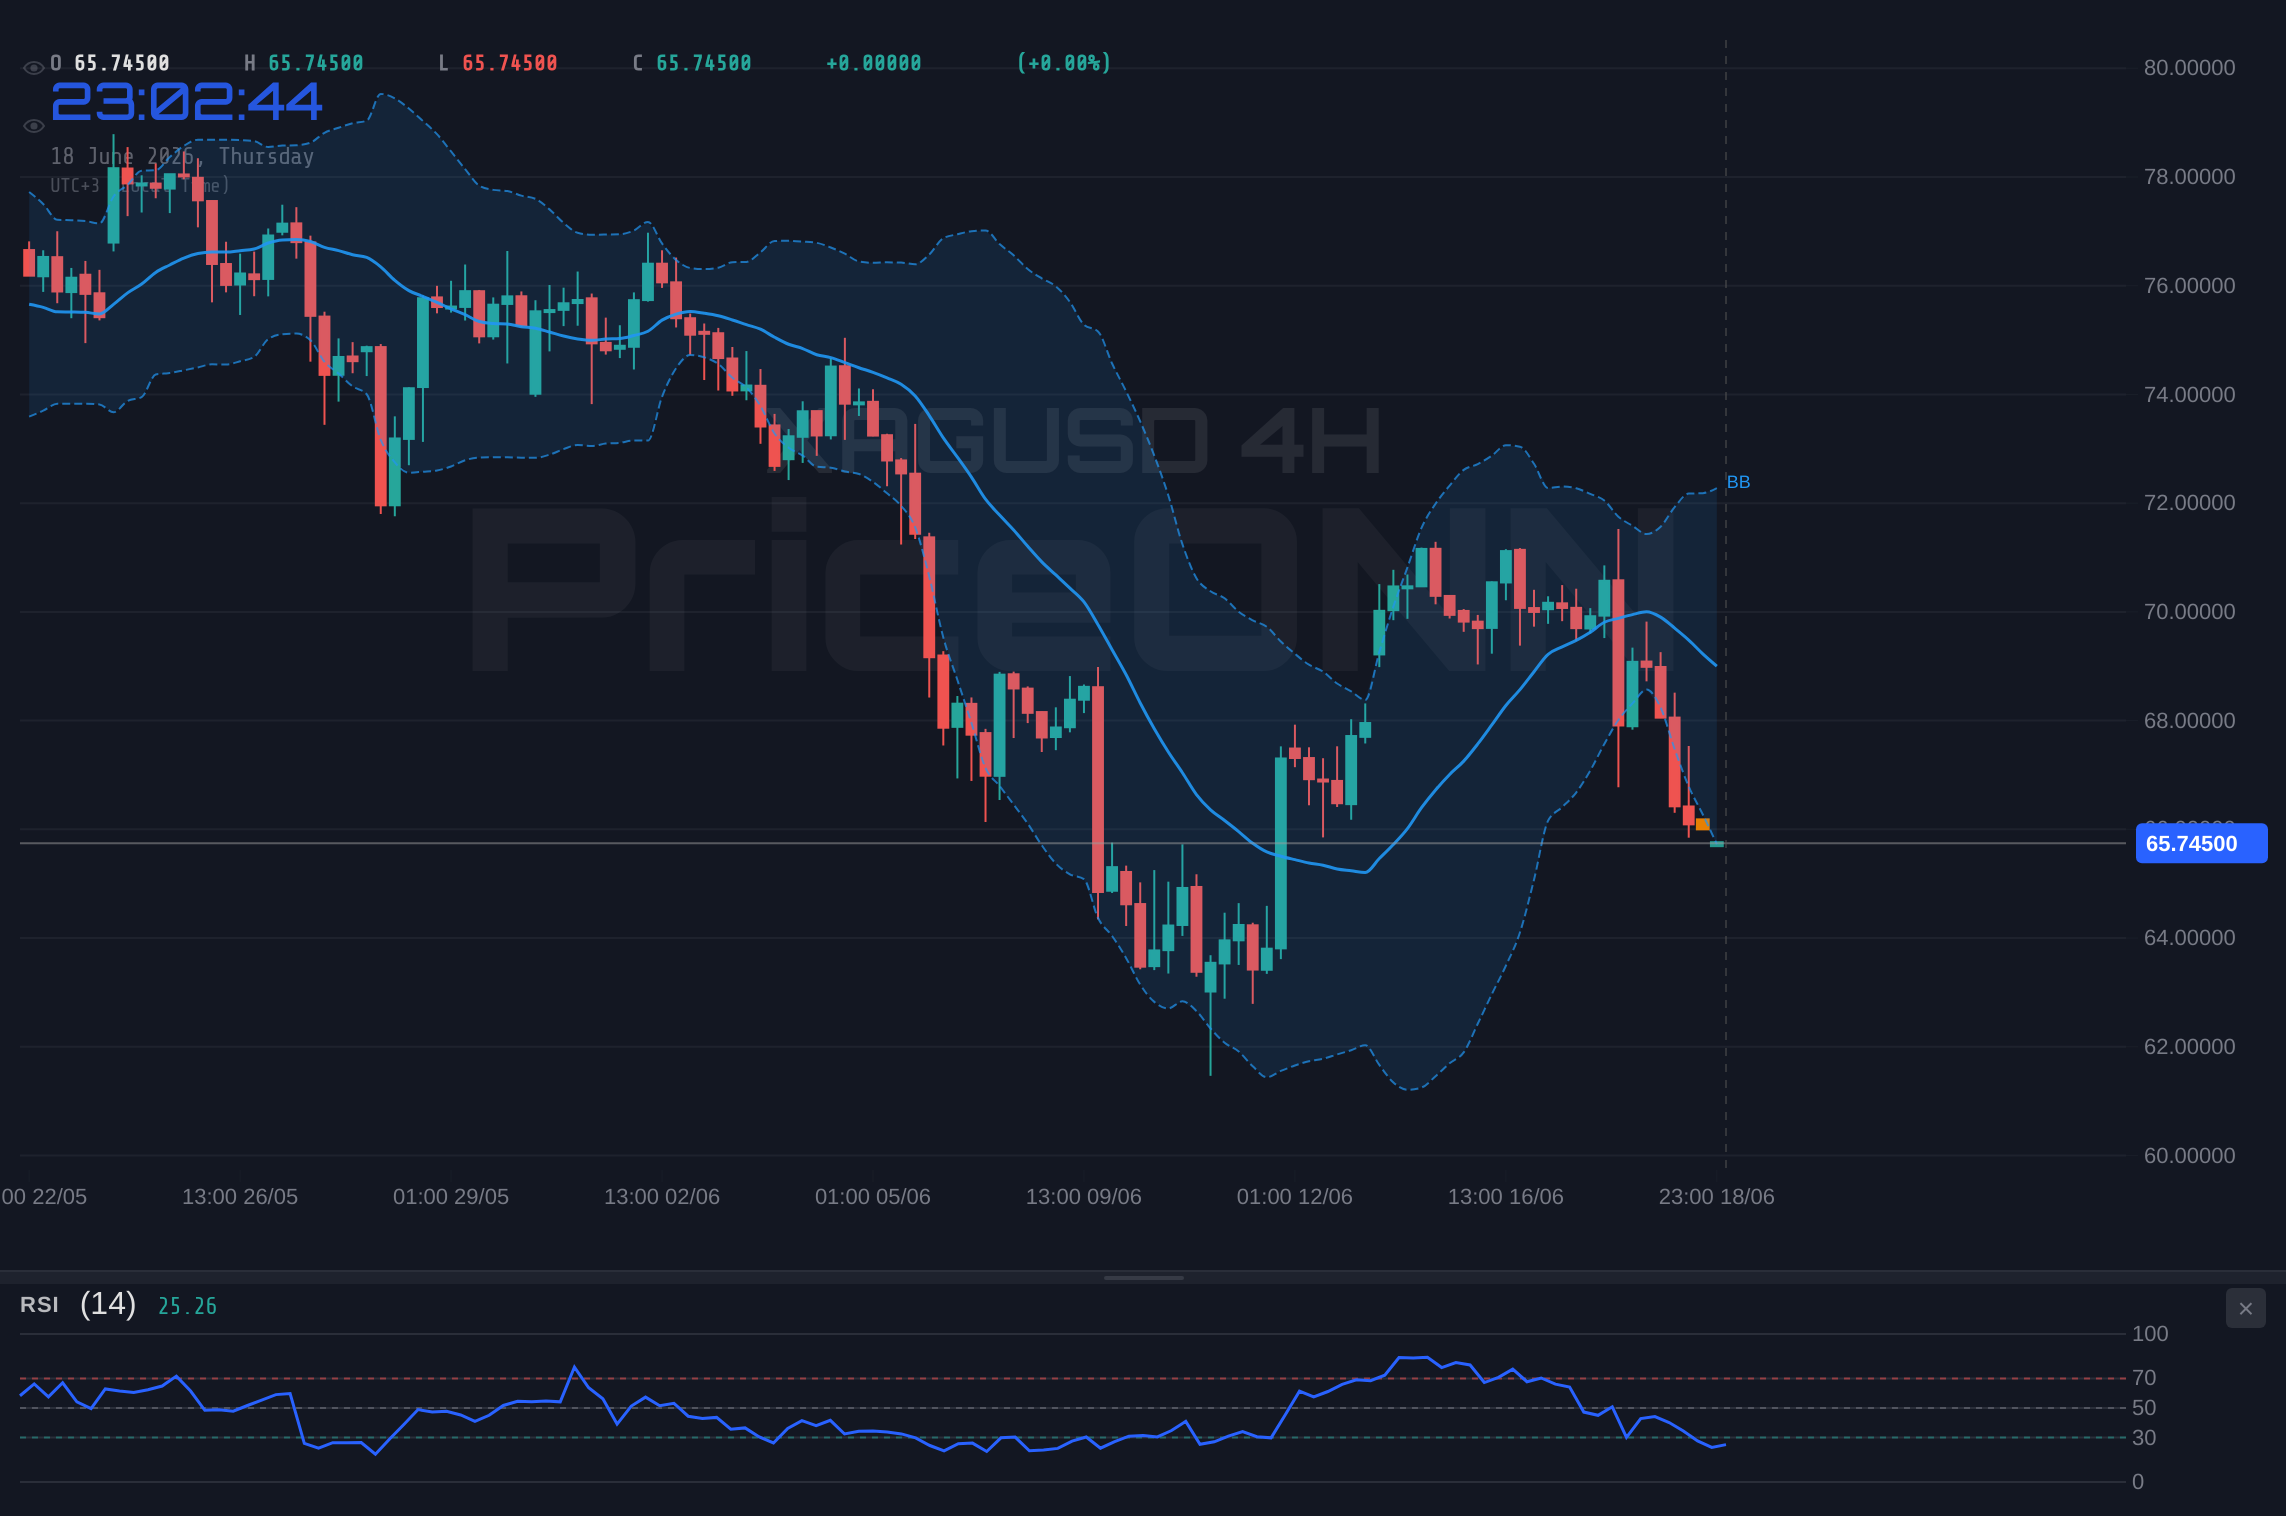
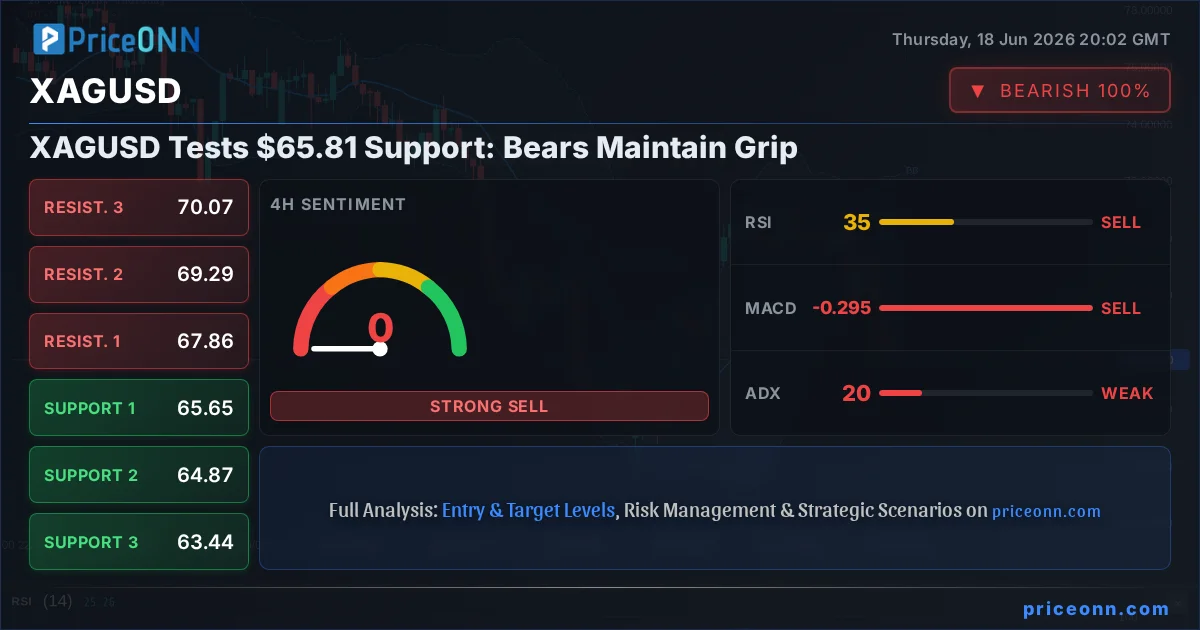
Shifting focus to the 4-hour chart, the picture becomes slightly more nuanced, though still decidedly bearish. The trend is classified as neutral with 50% strength, suggesting a potential pause or consolidation in the immediate aftermath of the sharp decline. However, the overall setup remains precarious for bulls. Key support levels on this timeframe are situated at $65.65, $64.87, and $64.44. These are lower than the 1-hour supports, indicating a broader price discovery to the downside. Resistance is capped at $67.86, $69.29, and $70.07. The RSI here reads 35.43, still in the neutral-to-oversold territory, and showing a downward trend. The MACD continues to exhibit negative momentum, and the Bollinger Bands are positioned below the lower band, a sign of extreme selling pressure that could lead to a short-term oversold bounce or a continuation of the trend.
The Stochastic oscillator on the 4-hour chart, with %K at 9.75 and %D at 34.57, clearly indicates a bearish signal as %K is well below %D, reinforcing the downward bias. The ADX at 22.73, while lower than the 1-hour reading, still points to a trend of moderate strength, suggesting that the market is not yet entering a completely range-bound phase. The overall signal on this timeframe is a strong 'SELL', with zero buy signals and eight sell signals, underscoring the current dominance of the bears. This neutral-on-paper but bearish-in-practice trend on the 4-hour chart suggests that while immediate sharp drops might be less likely than on the 1-hour, the path of least resistance remains firmly downwards. Any rallies are likely to be met with selling pressure as traders look to exit positions or initiate new shorts.
Extending the analysis to the daily timeframe, the bearish narrative for XAGUSD remains consistent, albeit with a slight shift in the trend strength. The daily trend is classified as bearish with 98% strength, confirming that the longer-term outlook is firmly in the hands of the sellers. This is a critical observation for any trader considering longer-term positions or swing trades. The significant support levels identified on the daily chart are substantially lower: $4190.18, $4122.79, and $4026.79. These represent potential deep targets should the current bearish momentum persist and accelerate. On the resistance side, the levels are $4353.57, $4449.57, and $4516.96 – levels that seem distant given the current market conditions.
The indicators on the daily chart echo the bearish sentiment. The RSI at 38.39 is in the neutral zone but trending downwards, indicating waning buying interest. The MACD is deeply negative, with the MACD line far below its signal line, signaling strong bearish momentum. Bollinger Bands are hugging the lower band, a sign of prolonged selling pressure. However, there is a slight divergence in the Stochastic oscillator, with %K at 55.86 and %D at 41.4, showing %K above %D. This could be interpreted as a nascent bullish signal, suggesting that the oversold conditions might be reaching a temporary extreme and a short-term bounce could be on the cards. Nevertheless, this single indicator reading must be viewed in the context of all others. The ADX at 35.89 confirms a strong downtrend, aligning with the overall bearish picture. The general signal across the daily timeframe leans heavily towards 'SELL', with only one buy signal amidst a sea of sell signals, reinforcing the idea that the long-term trend is down.
The current price of XAGUSD at $65.81 is not just a number; it's a battleground. The proximity to the 1-hour support at $65.68 is significant. A break below this level would not only confirm the immediate bearish bias but could trigger a cascade of sell orders as algorithmic traders and short-term players react. The strength of the downtrend, as indicated by the ADX readings across all timeframes (33.93 on 1H, 22.73 on 4H, and 35.89 on 1D), suggests that any upward retracements are likely to be short-lived and met with renewed selling pressure. The general market environment, influenced by a strengthening US Dollar Index (DXY) currently at 100.9, further exacerbates the pressure on silver, as a stronger dollar typically makes dollar-denominated commodities like silver more expensive for holders of other currencies, thus dampening demand.
The correlation with broader market sentiment, as reflected in indices like the S&P 500 and Nasdaq, cannot be ignored. While the S&P 500 has shown some resilience, its overall trend on the daily chart is bearish, and the Nasdaq’s daily trend is also showing signs of weakness despite a recent uptick. This risk-off sentiment, even if nuanced, tends to favor safe-haven assets like gold over more volatile commodities like silver, especially when the dollar is also strengthening. The recent news regarding WTI Crude Oil struggling to recover and the UK jobs market showing stalled growth further indicates a global economic environment that is not conducive to strong commodity demand, adding another layer of bearish context for XAGUSD. While analysts are watching Barrick Mining and Silvercorp Metals for potential opportunities in the mining sector, the underlying commodity price action for silver itself remains deeply challenged.
Looking at the convergence of technical signals, the bears appear to have a clear advantage. The consistent bearish momentum indicated by the MACD across all timeframes, coupled with RSI readings that, while oversold at times, are not yet showing sustained bullish divergence, paints a picture of sustained selling pressure. The Stochastic oscillator's mixed signals across different timeframes (oversold on 1H, bearish on 4H, and a potential bullish crossover on 1D) highlight the need for caution and confirmation. However, the overwhelming number of 'SELL' signals from the 1-hour and 4-hour aggregators, and the strong bearish trend indicated by the ADX on the daily chart, suggest that any short-term rallies are more likely to be opportunities for sellers to re-enter the market at better prices rather than the start of a sustained recovery.
The current price action around $65.81 is a critical test. The ability of the market to hold above the immediate support at $65.68 will be the first tell-tale sign. If this level falters, the subsequent levels of $65.55 and $65.31 will come into sharp focus. A decisive close below $65.31 on the 1-hour chart could trigger a further decline towards the daily support levels, starting with $4190.18, a significant psychological and technical barrier. Conversely, for the bulls to regain any semblance of control, they would need to engineer a strong move above the 1-hour resistance at $66.05, ideally followed by a push through $66.41. Such a move would require a significant shift in momentum, likely driven by external factors such as a sudden weakening of the US dollar or a shift in geopolitical risk appetite, neither of which appears imminent based on current data.
The path forward for XAGUSD appears fraught with challenges for buyers. The confluence of bearish technical indicators, a strengthening dollar, and a generally cautious global economic outlook suggests that the prevailing downtrend is likely to persist. While short-term oversold conditions might offer fleeting opportunities for counter-trend trades, the overall trend strength and the consistent selling pressure observed across multiple timeframes indicate that the bears are in the driver's seat. Traders should remain vigilant, paying close attention to the key support levels mentioned and waiting for clear confirmation before considering any bullish positions. The market is currently favoring a strategy of caution and risk management, with a keen eye on whether the bears can maintain their supremacy and push prices lower.
The prevailing sentiment in the silver market, as evidenced by the current price of $65.81 and the overwhelming technical signals, points towards continued bearish pressure. While the daily Stochastic shows a slight bullish crossover, it stands in stark contrast to the more dominant bearish signals across shorter timeframes and the strong ADX readings confirming an established downtrend. This suggests that any potential upside might be limited and short-lived. The critical support at $65.68 is the immediate level to monitor; a failure to hold this could accelerate selling towards $65.31 and beyond. The strengthening DXY at 100.9 adds another layer of complexity, typically acting as a headwind for commodities like silver. Therefore, a strategy focused on risk management and waiting for clearer directional signals or significant breaks of key levels appears most prudent in the current choppy market environment.
The current technical setup for XAGUSD suggests a high probability of further downside, with the bears firmly in control. The consistent bearish momentum across 1-hour and 4-hour charts, reinforced by strong ADX values, indicates that sellers are likely to continue their pressure. While the daily chart offers a sliver of hope with a bullish Stochastic crossover, it is overshadowed by negative MACD and RSI readings trending lower. The key support at $65.68 is crucial; a break below it would likely trigger further selling. Conversely, any significant upside move would need to overcome immediate resistance at $66.05 and $66.41, a challenging prospect given the current market dynamics and the strengthening dollar index (DXY at 100.9). Patience and disciplined risk management are advised as the market navigates these levels.
Ultimately, the battle for control of XAGUSD at the $65.81 level is currently being won by the bears. The confluence of bearish technical indicators, including oversold RSI readings that fail to spark sustained buying, negative MACD momentum, and strong ADX trend strength, paints a clear picture. The immediate support at $65.68 is under intense pressure, and a failure to hold it could see prices rapidly testing $65.31 and potentially heading towards the daily support levels. While the daily Stochastic offers a minor bullish divergence, it is not yet confirmed and is outweighed by the broader bearish sentiment. The strengthening dollar index (DXY at 100.9) acts as an additional headwind, reinforcing the view that the path of least resistance for silver remains to the downside. Traders should remain cautious, awaiting a decisive break of either key support or resistance levels before committing to significant positions.
The market is currently presenting a challenging environment for silver bulls. With XAGUSD trading at $65.81, the technical indicators across multiple timeframes overwhelmingly favor the bears. The strong downtrend signals on the 1-hour and daily charts, coupled with the neutral-to-bearish sentiment on the 4-hour chart, suggest that further price erosion is the most probable scenario. Key support at $65.68 is under scrutiny, and a breakdown could open the door to significant declines. While short-term oversold conditions might offer brief respite, they are unlikely to alter the dominant trend without stronger confirmation. The strengthening DXY at 100.9 reinforces the bearish outlook for dollar-denominated assets like silver. Therefore, a strategy focused on short-term selling opportunities or waiting for a clear break of significant levels appears most prudent.
Volatility creates opportunity - those prepared will be rewarded. While the current technical picture for XAGUSD at $65.81 clearly favors the bears, markets are cyclical. The prevailing downtrend, marked by strong ADX readings and bearish momentum indicators, suggests that caution is warranted. However, the oversold RSI on the 1-hour chart and the bullish Stochastic crossover on the daily timeframe hint at potential short-term bounces. The key will be how price reacts to the critical support at $65.68. A decisive break below this level would confirm the bears' dominance and open the door for further declines, likely amplified by the strengthening DXY at 100.9. Patience and disciplined risk management are essential as the market navigates these turbulent waters.
Frequently Asked Questions: XAGUSD Analysis
What happens if XAGUSD breaks below $65.68 support on the 1H chart?
A break below $65.68 would likely trigger further selling pressure, potentially targeting the $65.55 and $65.31 support levels. This would confirm the prevailing bearish momentum indicated by MACD and ADX.
Is the RSI at 30.54 a buy signal for XAGUSD right now?
While RSI at 30.54 on the 1H chart indicates oversold conditions, it does not automatically signal a buy. In a strong downtrend, RSI can remain oversold for extended periods without a significant reversal. Confirmation from other indicators or price action is crucial.
How is the strengthening DXY at 100.9 affecting XAGUSD at $65.81?
A stronger US Dollar Index (DXY) at 100.9 typically exerts downward pressure on dollar-denominated commodities like silver (XAGUSD). This correlation suggests that the rising dollar is contributing to the bearish sentiment and price decline observed in silver.
How will the stalled UK jobs growth affect XAGUSD outlook?
Stalled UK jobs growth, alongside easing wage pressures, signals potential economic slowdown in the UK. This can contribute to broader risk-off sentiment globally, which, when combined with a strong dollar, generally weighs on commodities like XAGUSD, reinforcing the bearish outlook.
Track markets in real-time
AI-powered analysis, technical indicators and real-time price data.
Join Our Telegram Channel
Breaking market news, AI analysis and trading signals instantly.
Join Channel