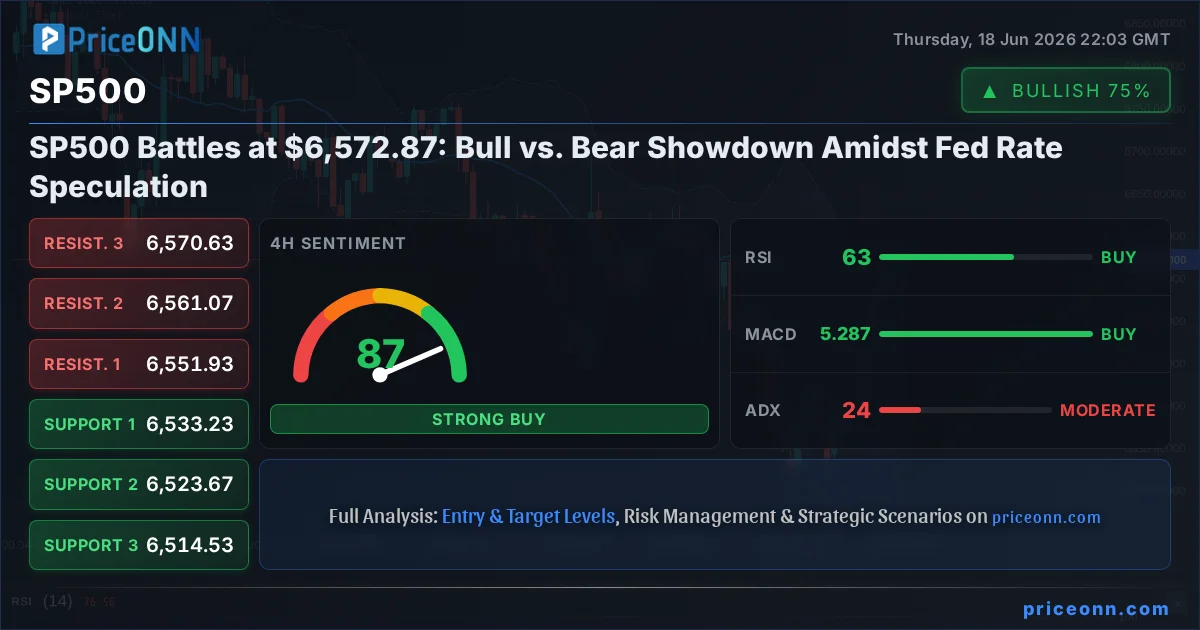
The battle lines are drawn around the critical $6,572.87 mark for the S&P 500. In a market environment that’s constantly scanning the horizon for clues on Federal Reserve policy and broader economic health, this level represents more than just a price point; it’s a psychological battleground where bulls and bears are fiercely contesting control. The index’s recent upward trajectory, marked by a 0.74% gain to $6,572.87, has been met with significant resistance, highlighting the underlying tension. Understanding the forces at play - from the persistent whispers of AI-driven growth to the looming specter of inflation and interest rate uncertainty - is crucial for navigating this complex landscape.
- The S&P 500 is trading at $6,572.87, with RSI at 67.09 signaling growing overbought pressure, though not yet extreme.
- Critical support for the SP500 is identified at $6,533.23, a level that has historically provided a floor during periods of consolidation.
- MACD histogram at +10.5 indicates bullish momentum is currently strong, but potential divergence on the 4-hour chart warrants caution.
- Fed rate expectations are a significant driver, with the DXY index at 100.90 showing renewed strength, potentially pressuring equity markets.
The Bullish Case: Riding the Wave of Technological Optimism
The bulls are certainly not backing down easily. Their argument is largely underpinned by the ongoing narrative surrounding artificial intelligence (AI) and its transformative potential across various sectors. Recent reports highlight how Big Tech’s substantial capital expenditure plans, particularly in AI infrastructure, are fueling optimism. Companies like Google, Meta, and Amazon are pouring billions into hardware and research, creating a ripple effect that benefits chip manufacturers and related technology providers. This sustained investment suggests a fundamental belief in future earnings growth, providing a solid foundation for equity valuations. The S&P 500’s own 0.74% daily rise to $6,572.87, despite some headwinds, showcases this underlying strength. Furthermore, the Nasdaq 100, a tech-heavy index, has shown robust upward momentum on the 1-hour and 4-hour charts, with its ADX at 22.38 and 15.62 respectively, indicating a prevailing trend that often pulls the broader market along with it.
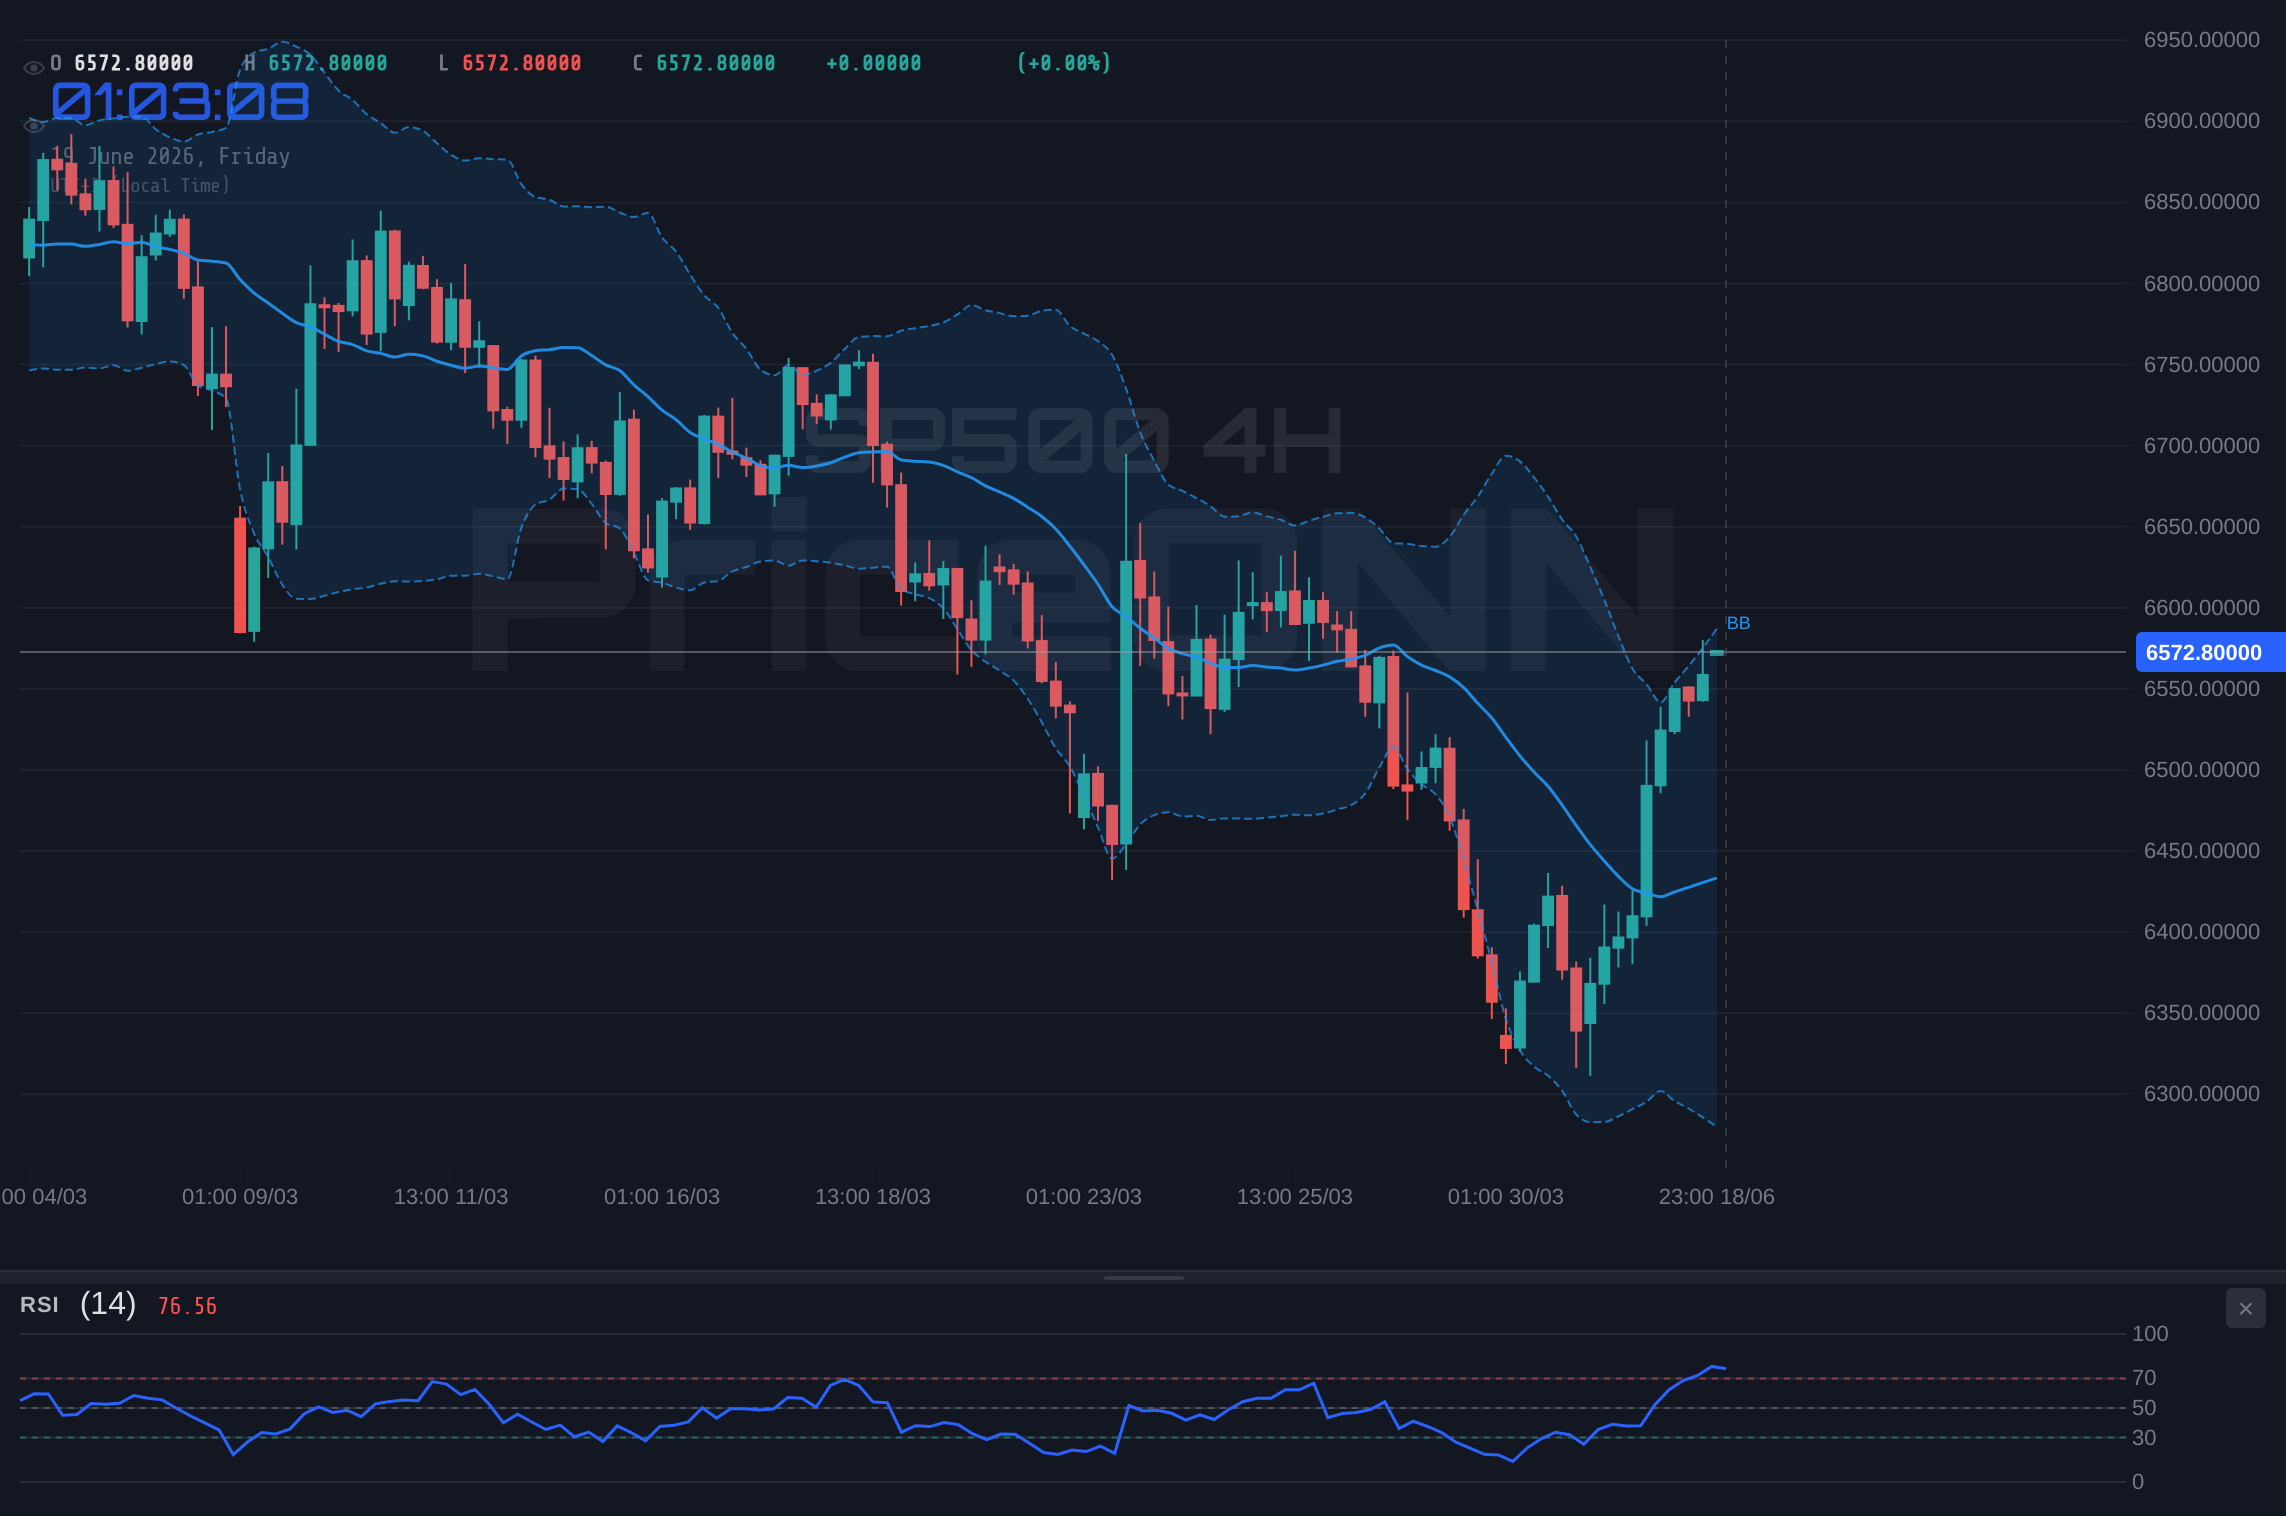
Technically, the 1-hour chart for the S&P 500 shows a strong upward trend (96% strength), with positive MACD momentum and RSI at 70.95, indicating strong buying interest. While the RSI is approaching overbought territory, it hasn't reached extreme levels that would typically signal an immediate reversal. The Stochastic indicator on the 4-hour chart, showing K=97.85 and D=86.96, is in overbought territory, suggesting a potential pause or pullback might be on the horizon. However, the overall picture from the bulls’ perspective is one of continued upward momentum, driven by innovation and strategic investments. The fact that the Dow Jones 30 is showing an 8-hour trend of 'Neutral' (50% strength) and a 1-day trend of 'Neutral' (50% strength) might indicate that the broader market isn't fully committed to a single direction, allowing tech-driven strength to lead. The bulls believe this technological revolution is not a short-term fad but a fundamental shift that will continue to support higher valuations for the foreseeable future.
The Bearish Counter-Argument: Inflation, Rates, and Geopolitical Puzzles
However, the bears are quick to point out the significant macroeconomic headwinds that could derail this optimistic outlook. The persistent specter of inflation remains a primary concern. While some data points might suggest easing wage pressures, as noted in the UK jobs market report, the overall inflationary environment remains a delicate balancing act for central banks. The Federal Reserve, in particular, is walking a tightrope, trying to curb inflation without stifling economic growth. The DXY, or Dollar Index, has shown renewed strength, climbing to 100.90 with a very strong 1-hour trend (100% strength) and ADX at 51.95. A stronger dollar typically exerts downward pressure on equities, especially those with significant international revenue streams, by making US goods more expensive abroad and reducing the value of foreign earnings when repatriated. This correlation is a critical factor for the S&P 500, which is currently trading at $6,572.87.
The daily chart for the S&P 500 presents a more cautious picture. The trend is decisively bearish (100% strength) with support levels significantly lower than the current price, at $6,377.47, $6,230.63, and $6,149.87. While the index has rallied, it is currently below its 1-day middle Bollinger Band, suggesting a potential for further downside if the current upward momentum falters. The RSI(14) at 45.35, while not yet in oversold territory, indicates a lack of strong bullish conviction on the daily timeframe. Furthermore, the MACD on the daily chart shows negative momentum, with the MACD line below its signal line, reinforcing the bearish sentiment on the longer timeframe. The bears argue that the recent tech rally might be a dead cat bounce, a temporary recovery within a larger downtrend, especially if inflation proves more stubborn than anticipated or if geopolitical tensions escalate, leading to a flight to safety away from riskier assets like equities.
Technical Signals: A Tale of Two Timeframes
The technical indicators present a somewhat bifurcated view, reflecting the ongoing tug-of-war between bulls and bears. On the shorter timeframes, particularly the 1-hour chart, the S&P 500 shows strong bullish signals. The trend is firmly upward with 100% strength, the RSI is hovering around 70.95, and the MACD is displaying positive momentum, with its histogram at +10.5. The ADX at 49.72 on the 1-hour chart suggests a strong trend is in place, albeit one that could be nearing exhaustion if it doesn't see further confirmation. This short-term strength is what’s keeping the bulls excited, pushing the price towards resistance levels like $6,568.73 and $6,577.27.
However, the longer timeframes paint a different picture. The 4-hour chart shows a neutral trend (50% strength), and the daily chart firmly establishes a bearish trend (100% strength). On the daily timeframe, the RSI is at 45.35, indicating a lack of conviction and potentially setting the stage for a pullback. The MACD on the daily chart is negative, and the Stochastic indicator (%K: 42.97, %D: 29.88) is showing a bullish signal, but this is within a broader context of falling prices and below the middle Bollinger Band. The ADX on the daily chart at 47.51 signifies a strong trend, but its bearish direction cannot be ignored. This divergence between short-term optimism and long-term caution is a classic sign of market indecision, where traders are waiting for a clearer signal before committing to a significant move. The bears are leveraging this ambiguity, pointing to the substantial distance between the current price of $6,572.87 and the daily support levels as evidence of potential downside risk.
Correlation Analysis: The Dollar's Shadow and Equity's Dance
The interplay between the US Dollar Index (DXY) and the S&P 500 is a critical element in understanding the current market dynamics. As the DXY strengthens, it typically puts downward pressure on global equities, including the S&P 500. Currently, the DXY is trading at 100.9, exhibiting a powerful upward trend on the 1-hour and 4-hour charts, supported by an ADX well above 30. This renewed dollar strength, potentially driven by expectations of continued hawkishness from the Federal Reserve or by safe-haven flows amid geopolitical uncertainties, creates a challenging environment for US large-cap stocks that rely on global markets. The bulls might argue that the AI boom can decouple equities from traditional correlations, but the bears will undoubtedly use the DXY's ascent as ammunition to support their case for a market correction.
Conversely, the performance of risk assets like the S&P 500 and Nasdaq 100 often moves in tandem. When these indices show strength, it suggests a higher risk appetite in the market, which can be positive for growth stocks and cyclical sectors. The Nasdaq 100’s strong performance, particularly on the 1-hour and 4-hour charts, indicates that investors are still willing to embrace risk, at least in the technology sector. However, the S&P 500’s daily chart paints a less rosy picture, with a bearish trend and significant distance to support levels. This divergence needs careful monitoring. If the Nasdaq's strength begins to wane, it could signal a broader shift in risk sentiment that would likely drag the S&P 500 down from its current perch at $6,572.87. The correlation analysis suggests that while technology might be leading the charge, the broader economic and currency environment poses a significant risk to sustained gains.
Economic Calendar: Watching for Fed Clues and Inflation Data
The economic calendar is a critical battleground where future market direction is often shaped. Investors are keenly awaiting any new data that could provide clarity on the Federal Reserve's next moves regarding interest rates. While specific upcoming events like FOMC meetings or CPI releases are not detailed in the provided market data context, the general expectation of policy shifts is a major driver. Any indication of sustained inflation or a robust labor market could lead to renewed speculation about higher-for-longer interest rates, which would typically be a headwind for equities. Conversely, signs of cooling inflation or a weakening job market might fuel hopes for rate cuts, potentially boosting the S&P 500. The current market sentiment is clearly influenced by these expectations, as seen in the DXY’s strength.
The recent news about AI spending boom is a fundamental driver that bulls are leaning on, suggesting that technological innovation could offset some macroeconomic concerns. However, reports on stalled job growth in the UK and the ongoing challenges in India’s fuel prices despite falling international crude, hint at a more complex global economic picture. These disparate economic signals create uncertainty, making it difficult for the market to establish a clear, sustained trend. The S&P 500’s current position at $6,572.87, caught between the optimism of tech growth and the risks of higher rates and geopolitical instability, underscores the importance of upcoming economic data. Traders will be scrutinizing any releases that could provide a definitive direction, whether it’s employment figures, inflation reports, or central bank commentary.
The Verdict: A Precarious Balance at $6,572.87
At $6,572.87, the S&P 500 finds itself at a critical juncture, reflecting a market deeply divided. The bulls are buoyed by the undeniable momentum in AI and technology, supported by strong short-term technical signals and robust corporate investment. They see the current price as a stepping stone towards further gains, believing that innovation will continue to drive earnings and valuations higher, potentially pushing past immediate resistance levels. The bullish case is compelling, painting a picture of a market powered by disruptive technology that can overcome broader economic concerns.
However, the bears have a formidable arsenal of arguments. The strengthening dollar, the potential for persistent inflation, the looming specter of higher interest rates for longer, and the bearish signals on the daily S&P 500 chart cannot be ignored. The significant distance to support levels on the daily chart ($6,377.47 and below) suggests that any significant negative catalyst could trigger a sharp sell-off. The divergence between short-term optimism and long-term technical caution, coupled with the correlation risks posed by the DXY, creates a precarious balance. My assessment leans towards caution. While the enthusiasm for AI is palpable, the macroeconomic backdrop and the longer-term technical picture suggest that the risks of a pullback are substantial. The market is currently pricing in a lot of optimism, and any deviation from favorable economic data or a shift in Fed policy could quickly unwind these gains. Therefore, while a short-term rally might persist, the probability of a significant correction or consolidation seems higher than a continued uninterrupted ascent from these levels.
Bearish Scenario: Correction Ahead
65% ProbabilityNeutral Scenario: Consolidation Phase
25% ProbabilityBullish Scenario: AI Rally Continues
10% ProbabilityFrequently Asked Questions: SP500 Analysis
What happens if SP500 breaks below $6,533.23 support?
A break below the $6,533.23 support level on the 4-hour chart would likely trigger a bearish scenario, invalidating the current upward momentum. This could lead to a rapid decline towards the next daily support at $6,377.47 as stop-loss orders are triggered and bears gain control.
Should I buy SP500 at current levels of $6,572.87 given the RSI at 67.09?
Buying at $6,572.87 with an RSI at 67.09 presents a risk. While not yet extremely overbought, the RSI is approaching levels that have historically preceded pullbacks. A more prudent approach might be to wait for confirmation, perhaps a retest of support around $6,533.23 or a clear breakout above $6,577.27 resistance, rather than chasing the current price.
Is the MACD histogram at +10.5 a strong bullish signal for SP500?
The positive MACD histogram at +10.5 indicates bullish momentum on the shorter timeframes, supporting the recent rally. However, it's crucial to watch for potential divergence on longer timeframes. While positive now, if the histogram starts to shrink or the MACD line crosses its signal line downwards, it would signal weakening bullish conviction.
How will the Federal Reserve's interest rate expectations impact SP500 this week?
Federal Reserve expectations are paramount. If upcoming data suggests inflation is persistent, increasing the likelihood of higher-for-longer rates, it could pressure the SP500 downwards from $6,572.87, especially given the DXY's strength. Conversely, any hints of a dovish pivot or rate cuts could fuel further upside, though the current technical picture suggests caution is warranted.
| Indicator | Value | Signal | Interpretation |
|---|---|---|---|
| RSI (14) | 67.09 | Neutral | Approaching overbought, watch for divergence. |
| MACD Histogram | 10.5 | Bullish | Positive momentum, but monitor for weakening. |
| Stochastic | K: 97.85, D: 86.96 | Bearish | Overbought, potential for pullback or consolidation. |
| ADX | 47.51 | Bullish | Strong trend identified on daily chart. |
| Bollinger | Middle Band | Watch | Price trading below middle band on daily chart. |
Track markets in real-time
AI-powered analysis, technical indicators and real-time price data.
Join Our Telegram Channel
Breaking market news, AI analysis and trading signals instantly.
Join Channel