Gold just did something the bulls have been waiting months for, and frankly, it’s put the market on edge. After a significant run-up, XAUUSD has pulled back sharply, testing key support levels. The current price of $4,291.28 marks a critical point where the market will likely decide its next significant move. This isn't just about a few dollars changing hands; it’s about whether the underlying inflationary pressures and geopolitical tensions that fueled gold's rise are abating, or if this dip is merely a healthy correction before the next leg higher. We've seen a clear shift in momentum over the past 24 hours, and understanding the drivers behind this move is paramount for any trader looking to navigate these choppy waters.
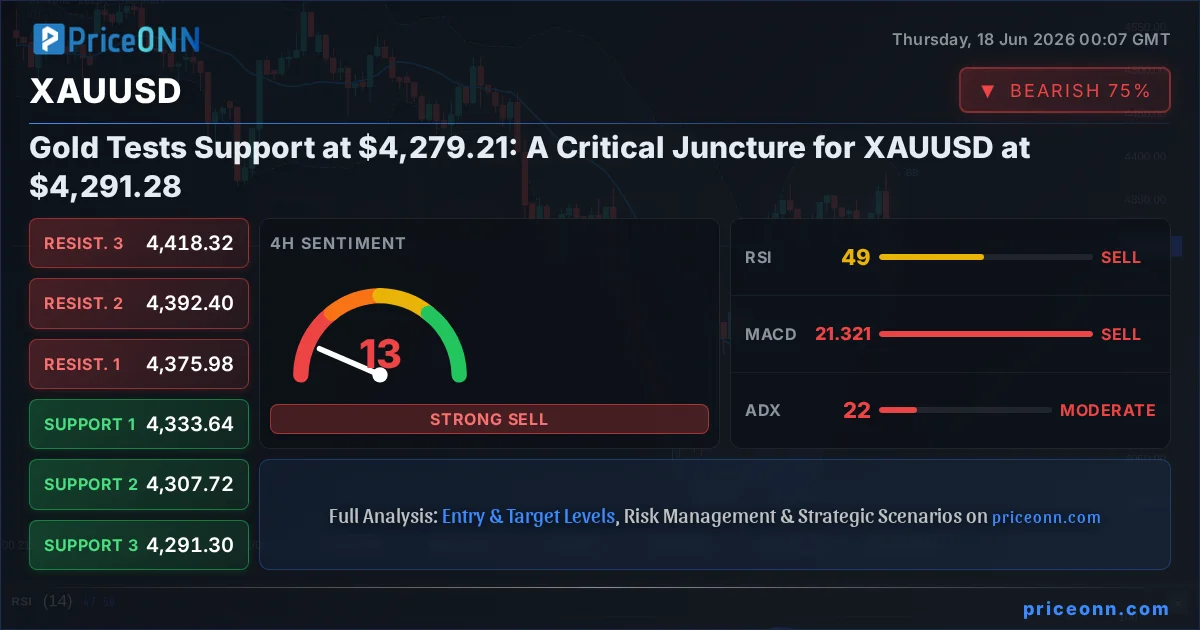
- XAUUSD is currently trading at $4,291.28, having tested support at $4,279.21.
- The RSI(14) is at 44.14 on the 1-hour chart, indicating neutral momentum with a slight downward bias.
- The 1-hour chart shows a strong ADX of 24.54, confirming a medium-strength downtrend.
- DXY is up 0.77% to 100.34, exerting downward pressure on gold prices.
- Geopolitical shifts and evolving Fed expectations are key fundamental drivers influencing gold's price action.
The immediate pressure on gold stems from a resurgent US Dollar Index (DXY), which has climbed 0.77% to trade at 100.34. This strengthening dollar is a classic headwind for gold, making the precious metal more expensive for holders of other currencies and often signaling a risk-on environment where investors might shy away from safe-haven assets. The DXY’s upward trajectory, especially when accompanied by rising equity markets, typically spells trouble for gold. However, the relationship isn't always straightforward, and with geopolitical risks still simmering, the dollar's role as a safe haven can sometimes override its inverse correlation with gold.
Looking at the technicals, the 1-hour chart paints a cautionary picture for gold bugs. The RSI(14) hovers at 44.14, firmly in neutral territory but with a downward lean. This suggests that while the selling pressure isn't overwhelming, buyers are not yet stepping in with conviction. More telling is the ADX at 24.54, indicating a medium-strength downtrend. Coupled with a MACD that shows negative momentum and is below its signal line, the short-term picture is decidedly bearish. The Bollinger Bands are also showing price trading below the middle band, reinforcing the bearish sentiment. Even the Stochastic Oscillator, with %K at 32.45 dipping below %D at 44.73, signals further downside potential in the immediate term. The overall signal on this timeframe is a strong 'SELL', reflecting the current downward momentum.
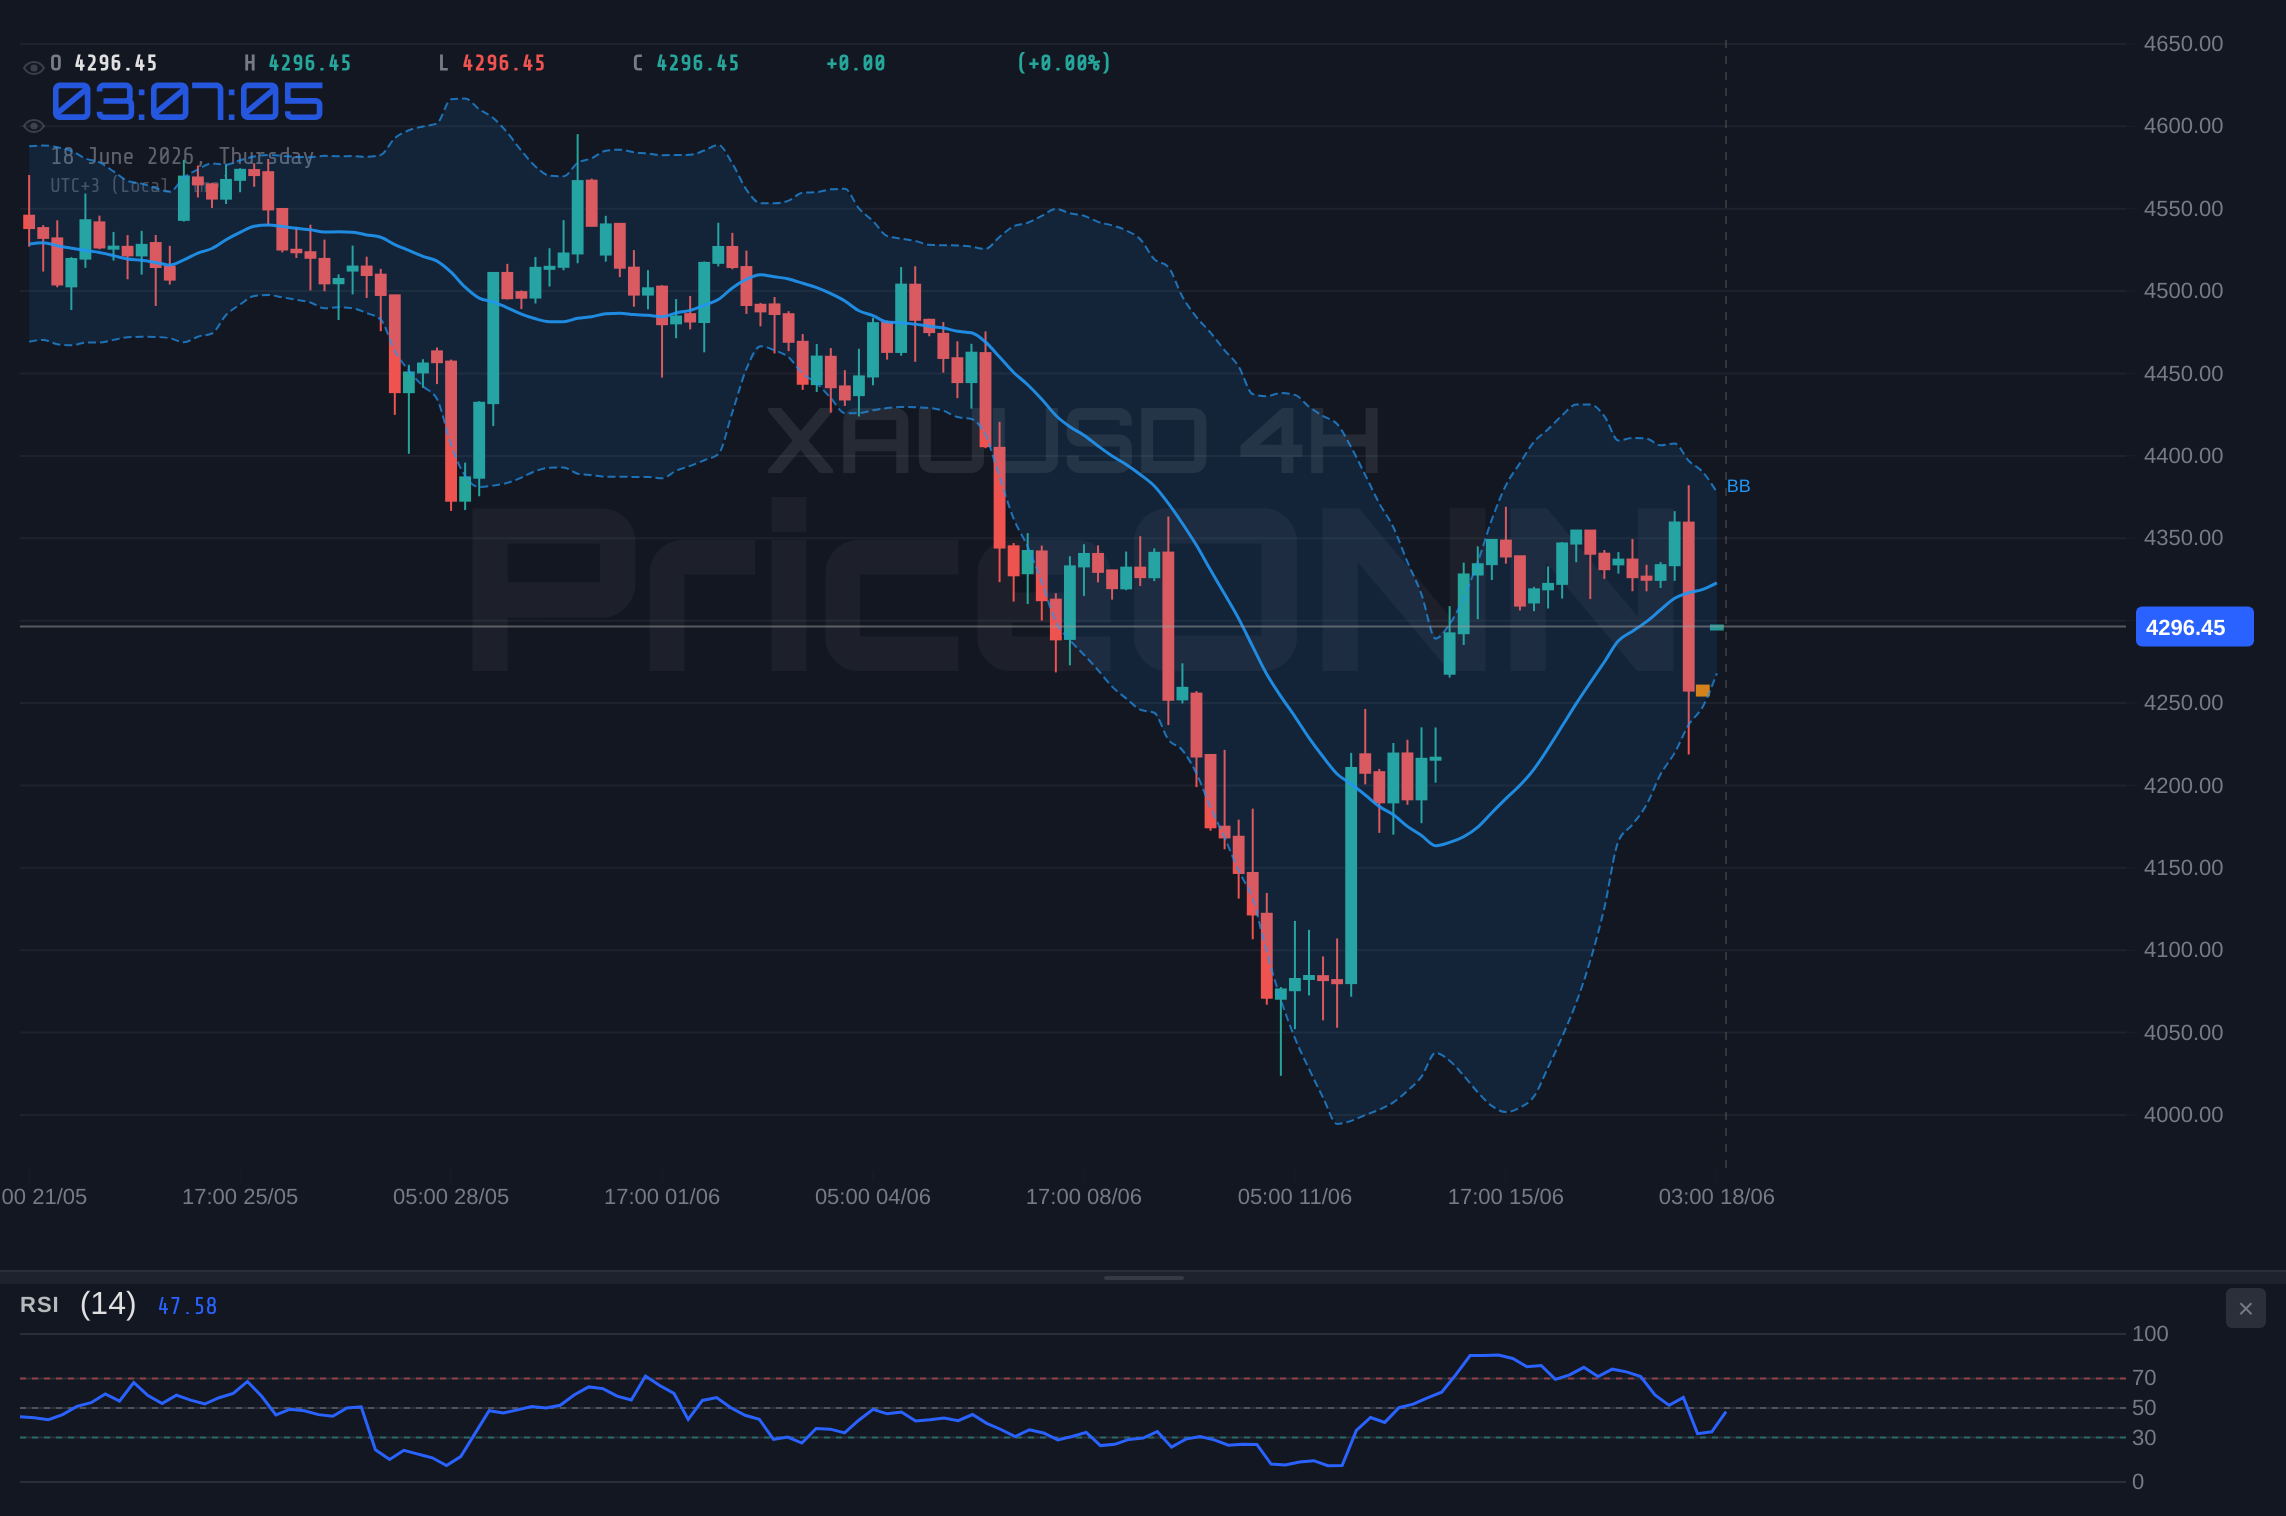
However, the multi-timeframe analysis reveals a more complex narrative. While the 1-hour chart is bearish, the 4-hour timeframe presents a slightly more nuanced view. Here, the trend is identified as 'Bullish' with a strength of 86%, a stark contrast to the hourly outlook. The RSI(14) at 48.29 is still in neutral territory but shows a less pronounced downward trend. The MACD remains negative, but the ADX at 21.74 suggests a weaker trend compared to the hourly. Intriguingly, the Stochastic Oscillator here shows a bullish signal (%K at 62.27 above %D at 50.78), hinting at a potential for a bounce. This conflict between timeframes suggests that the current pullback might be a retracement within a larger upward trend, rather than the start of a significant reversal.
The daily chart, arguably the most important for long-term trend identification, firmly places XAUUSD in a 'Downtrend' with a significant 98% strength. The RSI(14) is at 41.93, continuing the downward bias. The MACD exhibits negative momentum, and the Bollinger Bands are below the middle band. Yet, even here, the Stochastic Oscillator presents a bullish signal (%K at 59.71 above %D at 33.94), suggesting that the daily trend might be due for a correction or a pause. The ADX at 35.48 indicates a strong downtrend, but the conflicting Stochastic signal means that while the overall direction is down, short-term counter-trend moves are possible. This divergence across timeframes is precisely what creates trading opportunities – and risks.
Let's dive deeper into the fundamental context. The recent news flow, particularly regarding geopolitical shifts and evolving central bank expectations, plays a crucial role. Reports from earlier this week, such as the one from Reuters on June 17th stating that Fed officials highlighted inflation remaining 'stubborn', directly impact gold's appeal. If inflation is indeed proving sticky, it could theoretically support gold as an inflation hedge. However, the market's reaction is often driven by expectations of central bank responses. If sticky inflation leads to expectations of prolonged higher interest rates, this would typically weigh on gold, as higher rates increase the opportunity cost of holding non-yielding assets like gold.
The ongoing narrative around interest rates is complex. While some Fed officials signal persistent inflation, the market is also pricing in potential rate cuts later in the year. This push and pull creates volatility. If the market begins to strongly price in earlier or deeper rate cuts, this could provide a significant tailwind for gold, as lower interest rates reduce the opportunity cost and can weaken the dollar. Conversely, any hawkish rhetoric or stronger-than-expected economic data that pushes rate cut expectations further out will likely continue to pressure gold prices. The upcoming economic calendar will be crucial here; any surprises in inflation or employment figures could quickly shift these expectations.
The correlation with other markets is also telling. The S&P 500, trading at 6572.87 and showing a positive daily change of 0.74%, suggests a degree of risk appetite in the broader market. Typically, a rising S&P 500 might coincide with a weaker gold price, as investors rotate into riskier assets. However, the current narrative is complex. If the equity rally is perceived as being driven by factors that also support gold (like sustained inflation or geopolitical uncertainty), then the correlation might weaken. Conversely, if the equity strength is seen as a sign of economic resilience that allows central banks to maintain tighter policy, it could continue to weigh on gold.
Silver (XAGUSD) is mirroring gold's weakness, currently trading at $68.73 with a significant daily drop of 1.81%. The technical indicators for silver are largely bearish across timeframes, with the 1-hour and 4-hour charts showing 'SELL' signals. The ADX on the daily chart is 28.24, indicating a strong downtrend. This đồng-movement between gold and silver suggests that the headwinds affecting the precious metals complex are broad-based, likely driven by dollar strength and shifting rate expectations.
The influence of energy prices, particularly Brent crude trading at $78.73 and WTI at $75.88, also cannot be ignored. While oil prices have seen a notable decline, they remain a key indicator for inflation expectations. A sustained drop in oil prices could ease inflationary pressures, potentially leading central banks to adopt a more dovish stance, which would be supportive of gold. However, the geopolitical context, including the tentative US-Iran deal mentioned in recent news, adds layers of uncertainty. Any escalation in Middle East tensions could quickly reverse the trend in oil prices and reignite safe-haven demand for gold, regardless of the dollar's strength.
Considering the price action, the support level at $4,273.61 on the 1-hour chart and $4,291.30 on the 4-hour chart are now critical. The daily support at $4,281.49 is also in sharp focus. A decisive break below these levels, especially the daily support, would confirm the prevailing downtrend and could open the door for further declines towards the next significant support at $4,256.96. On the other hand, if gold manages to hold these levels and shows signs of stabilization, we could see a short-covering rally, especially if upcoming economic data surprises to the downside or if geopolitical risks escalate.
The current market sentiment is one of caution. While the daily trend is bearish, the conflicting signals from shorter timeframes and the Stochastic oscillator across multiple charts suggest that the market is at a crossroads. Traders will be closely watching the $4,291.28 level as a pivot. A failure to hold this price could trigger significant stop-losses, accelerating the move lower. Conversely, a strong bounce from current levels, especially if accompanied by a weakening dollar and rising geopolitical concerns, could signal a bottom is forming. The interplay between inflation data, central bank rhetoric, and geopolitical developments will be the key determinants in the coming days.
For traders right now, the most actionable insight lies in observing the reaction around the current price of $4,291.28. If the price consolidates here or bounces, look for confirmation on the hourly chart – a MACD crossover or RSI moving back above 50 would be initial signs. However, if the price slices through $4,273.61 and then $4,256.96, the bearish case on the daily chart gains significant traction, and caution would be the word. Patience is key; the market is offering conflicting signals, and forcing a trade here could be costly. Waiting for clearer confirmation, perhaps after the next major economic data release or a significant geopolitical development, will likely yield a much better risk-reward setup.
Bearish Scenario: Downtrend Continuation
65% ProbabilityNeutral Scenario: Consolidation & Volatility
25% ProbabilityBullish Scenario: Support Holds, Rebound Begins
10% ProbabilityFrequently Asked Questions: XAUUSD Analysis
What happens if XAUUSD breaks below the $4,273.61 support level on the 1-hour chart?
A break below $4,273.61 would invalidate the short-term bullish signals and confirm the bearish trend indicated by the daily chart's ADX of 35.48. This could lead to a rapid decline towards the next support at $4,256.96, potentially triggering further sell-offs.
Should I consider buying XAUUSD at current levels around $4,291.28 given the conflicting technical signals?
Caution is advised. While the Stochastic on the daily chart shows a bullish signal, the overall trend is bearish with a strong ADX of 35.48. A risk-reward favorable entry would require confirmation, such as a clear bounce off $4,273.61 or a break above $4,290.26, with an invalidation point below $4,256.96.
Is the RSI at 44.14 on the 1-hour chart a sell signal for XAUUSD?
An RSI of 44.14 is not definitively a sell signal, but it indicates neutral momentum with a downward bias. Combined with negative MACD momentum and a downtrending ADX of 24.54, it reinforces the short-term bearish sentiment. It suggests that sellers are more in control than buyers at this immediate juncture.
How will the current DXY strength at 100.34 affect XAUUSD this week?
The rising DXY typically puts downward pressure on gold. With DXY at 100.34, it suggests the US dollar is strengthening, making gold more expensive for international buyers. This correlation could continue to weigh on XAUUSD unless geopolitical risks escalate significantly, overriding the dollar's strength.
Track markets in real-time
AI-powered analysis, technical indicators and real-time price data.
Join Our Telegram Channel
Breaking market news, AI analysis and trading signals instantly.
Join Channel