The current market narrative paints a stark picture for precious metals, with silver (XAGUSD) feeling the heat and dropping to $64.13. This sharp decline isn't happening in a vacuum; it's a direct consequence of a strengthening U.S. Dollar Index (DXY) and a palpable shift towards risk aversion across global markets. As traders digest these cross-asset movements, the question on everyone's mind is whether the current price levels represent a buying opportunity or merely a pause before further declines. This analysis delves into the intricate web of correlations and technical signals shaping XAGUSD's trajectory, exploring what the data suggests for the immediate future and the broader market outlook.
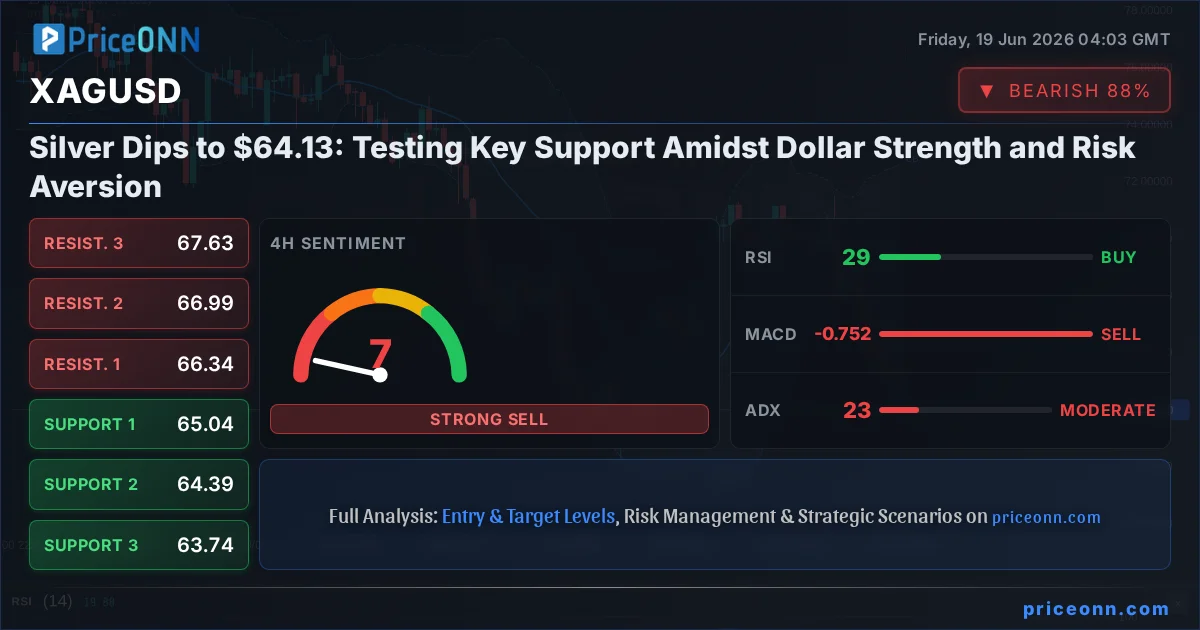
- Silver (XAGUSD) is currently trading at $64.13, down significantly as the dollar strengthens.
- Critical support for XAGUSD is being tested near the $63.88 level, with the 4-hour chart showing potential for a bounce.
- The DXY is at 101.03, showing strong upward momentum, which typically pressures silver prices.
- On the 1H chart, RSI is at 21.15, indicating extreme oversold conditions that could precede a short-term reversal.
- The broader market sentiment is risk-off, evidenced by the Nasdaq 100's 1H trend being neutral despite a 50% strength rating.
The intricate dance between the U.S. Dollar Index (DXY) and silver prices is a well-trodden path for market participants. Currently, the DXY is exhibiting robust upward momentum, trading at 101.03 with a strong 100% bullish trend on the 1-hour timeframe and a 98% strength rating on the 4-hour. This dollar strength acts as a significant headwind for commodities priced in USD, including silver. When the dollar strengthens, it takes more dollars to buy an ounce of silver, making it more expensive for holders of other currencies and thus dampening demand. The market is clearly reacting to this dynamic, as evidenced by the sharp 2.37% daily drop in XAGUSD, bringing it down to $64.13. This inverse correlation is not just a theoretical concept; it's a tangible force driving price action, and until we see a decisive shift in the dollar's trend, silver will likely remain under pressure.
Navigating the Risk-Off Environment
Beyond currency dynamics, the prevailing market sentiment is a crucial determinant of asset performance, especially for commodities like silver, which can act as both an industrial metal and a safe-haven asset. Currently, the mood is decidedly 'risk-off.' This is reflected in the performance of major equity indices. The Nasdaq 100, for instance, shows a neutral trend on the 1-hour chart with a 50% strength rating, despite a bullish signal on the 4-hour and daily charts. The S&P 500, while showing a recent rise, has a strong 100% bearish trend on the daily timeframe, suggesting underlying weakness. This aversion to risk typically leads investors to seek safer havens, which traditionally include assets like gold, U.S. Treasuries, and sometimes, the U.S. dollar itself. However, the current situation is complex, as the dollar is simultaneously strengthening due to safe-haven demand and hawkish monetary policy expectations, creating a challenging environment for silver.
The impact of geopolitical shifts, while not explicitly detailed in the immediate market data provided, always looms large. Recent news highlights concerns about energy bottlenecks for AI, a potential indicator of broader supply chain and industrial demand shifts. While not directly about silver, such macro narratives can influence investor sentiment towards industrial commodities. Furthermore, the recent news about falling oil prices potentially offsetting Fed fears in the Dow Jones Industrial Average suggests a complex interplay of factors. When oil prices fall, it can ease inflationary pressures, potentially influencing central bank policy expectations. This, in turn, can affect the dollar and, consequently, silver. The market is essentially trying to price in a future where inflation might be less of a concern, which could reduce the appeal of commodities as an inflation hedge.
The current price action for XAGUSD on the 1-hour chart is particularly telling. We see a strong 100% bearish trend, but the Relative Strength Index (RSI) is sitting at 21.15. This is deep into oversold territory, a condition that historically often precedes a short-term bounce or consolidation. Similarly, the Stochastic Oscillator is at K=5.72 and D=6.76, also signaling extreme oversold conditions. The MACD is showing negative momentum, with the MACD line below the signal line, confirming the bearish sentiment, but the extremely low RSI and Stochastic readings suggest that the selling pressure might be exhausting itself in the very short term. The ADX at 39.29 further reinforces the strength of the prevailing downtrend, indicating that any upward movement might be a correction within a larger bearish structure rather than a sustained reversal.
Key Levels and Short-Term Outlook
Looking at the intraday levels, the immediate support for XAGUSD is pegged at 4169.87, followed by 4163.70 and then the critical psychological level of 4155.65. Resistance is seen at 4184.09, 4192.14, and 4198.31. Given the oversold indicators on the 1-hour chart, a short-term bounce towards the immediate resistance levels is plausible, especially if the dollar shows any signs of pausing its ascent. However, the overall market sentiment and the strong bearish trend indicated by the ADX suggest that any such bounce might be a 'dead cat bounce' – a temporary recovery within a larger downtrend. The general signal across all timeframes for silver is overwhelmingly 'SELL,' with 6 'SELL' signals and 0 'BUY' signals on the 1-hour chart, and 8 'SELL' signals on the 4-hour and daily charts.
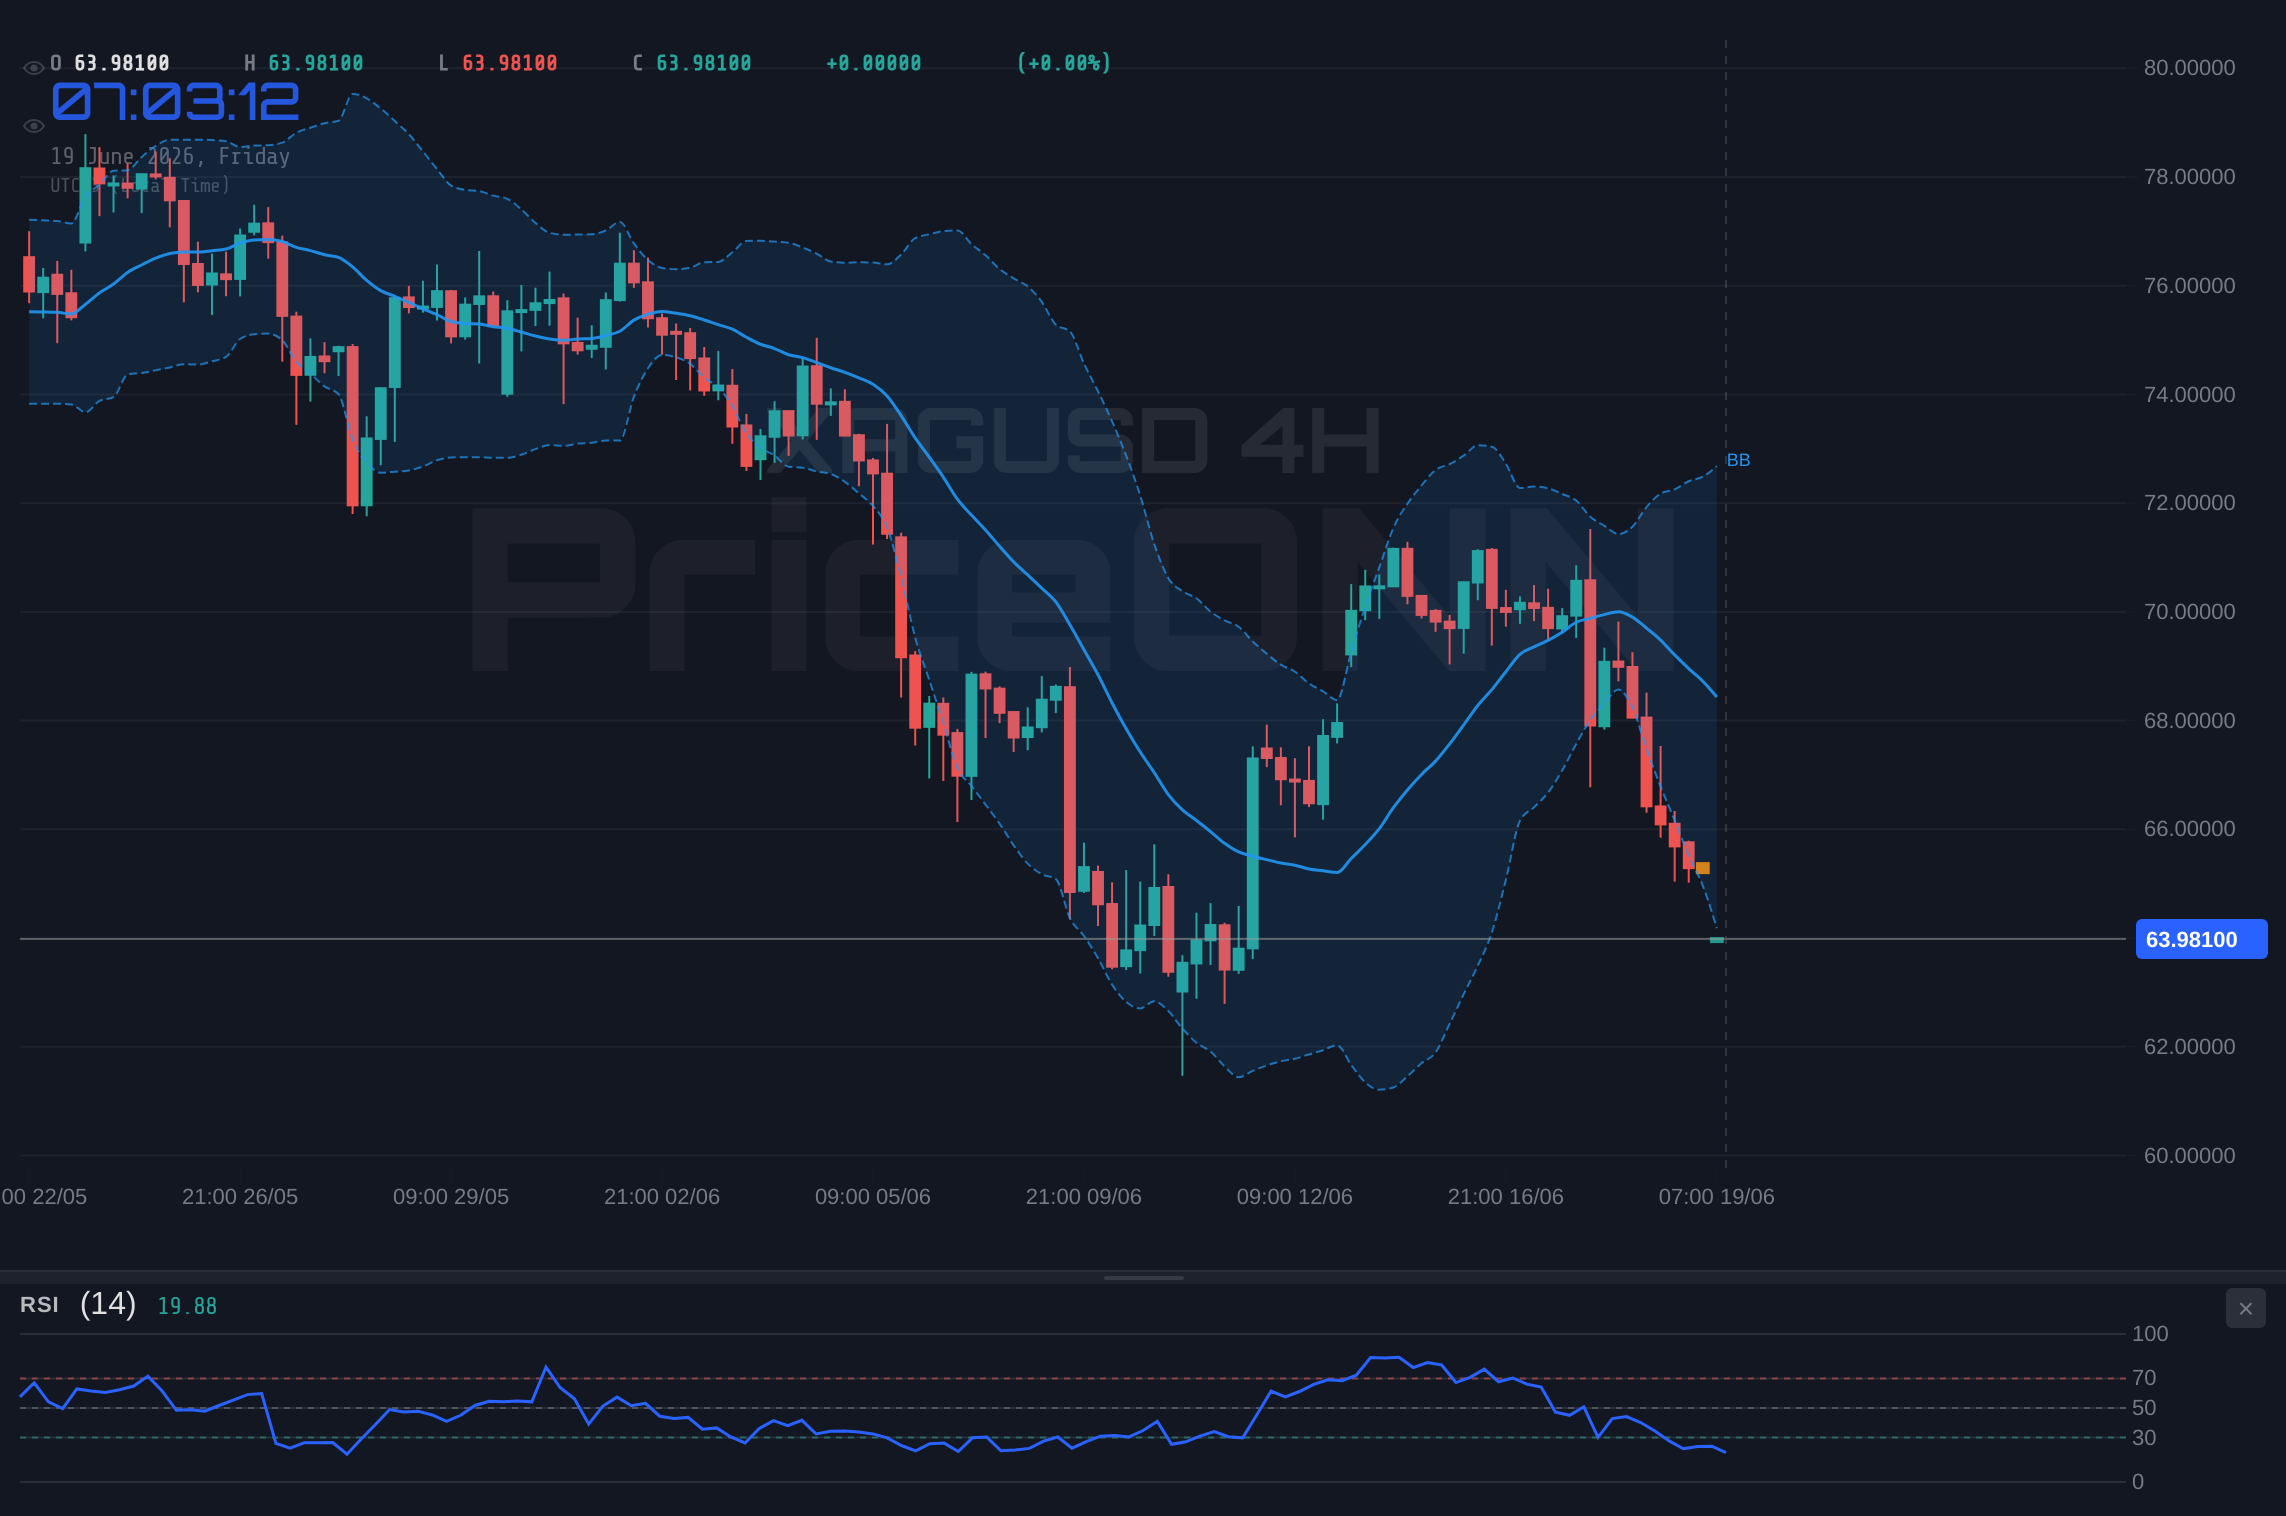
The 4-hour timeframe presents a slightly less bearish, though still cautious, picture. The trend is marked as 'Neutral' with a 50% strength rating, a slight divergence from the stronger bearish trends seen on other timeframes. Support levels are identified at 4195.99, 4183.07, and 4164.60, while resistance lies at 4227.38, 4245.85, and 4258.77. The RSI here is at 32.74, still in oversold territory but less extreme than on the 1-hour chart. The MACD remains negative, and the Stochastic Oscillator is showing K=2.42 and D=25.99, a clear bearish signal with the %K well below %D. The ADX at 25.56 indicates a trend, albeit less intense than on the shorter timeframe. The Bollinger Bands are also below the lower band, signaling oversold conditions or a potential breakdown. This mixed picture suggests consolidation might be occurring on this timeframe, but the overall bias remains downwards.
Zooming out to the daily timeframe, the bearish sentiment is firmly re-established. The trend is classified as 'Bearish' with a 98% strength rating. Immediate support is found at 4163.76, followed by 4118.59, and a more significant level at 4035.66. Resistance is overhead at 4291.86, 4374.79, and 4419.96. The RSI at 35.6 is in the neutral zone but trending downwards, indicating room for further decline before hitting oversold conditions. MACD continues to show negative momentum, and the Stochastic Oscillator's %K (46.42) is just below %D (46.63), hinting at a potential continuation of the downward move. The ADX at 36.55 confirms a strong downtrend. The Bollinger Bands are below the middle band, reinforcing the bearish bias. The consistent 'SELL' signals across all timeframes are a stark warning for any potential buyers.
The $63.88 Line in the Sand
The critical support level for XAGUSD, as indicated by the data, hovers around $63.88 on the daily chart. This level represents a significant psychological and technical barrier. A break below this point could trigger further significant selling pressure, potentially leading to a cascade towards the next major support at $62.07 and subsequently $59.09. The aggressive bearish signals across all timeframes, particularly the strong ADX readings (45.77 on 1H, 23.16 on 4H, and 30.17 on 1D), suggest that the bears are firmly in control. The RSI readings, while deeply oversold on shorter timeframes (21.15 on 1H, 29.85 on 4H), hint at a potential for a short-term technical bounce. However, the overall trend, especially on the daily chart, remains decidedly bearish, making any upward movements suspect.
The broader commodity market context also plays a role. While crude oil prices (WTI and Brent) are also showing bearish trends, their movements are influenced by different factors, including OPEC+ decisions and geopolitical tensions in energy-producing regions. The recent news about the first new oil sands project in Alberta starting production in a decade might add to bearish oil sentiment, potentially easing some inflation concerns. However, the 'AI is creating a depreciation time bomb' narrative suggests that underlying demand for industrial inputs could remain robust in the long run, creating a complex backdrop. For silver, its dual nature as an industrial metal and a safe-haven asset means its price can be influenced by both economic growth expectations and geopolitical uncertainty. Currently, the latter seems to be gaining prominence, pushing investors towards the dollar.
Considering the confluence of a strong dollar, risk-off sentiment, and overwhelmingly bearish technical signals across multiple timeframes, the path of least resistance for XAGUSD appears to be downwards. The oversold conditions on the 1-hour chart offer a glimmer of hope for a short-term bounce, perhaps to retest the immediate resistance levels around $64.88 to $65.48. However, any such rally would need to overcome the strong bearish momentum and the prevailing macro headwinds. A sustained move above the 4-hour resistance at $66.34 would be required to signal a potential shift in sentiment, but this seems unlikely in the current environment. Therefore, traders should remain cautious, looking for potential selling opportunities on any corrective rallies or for a clear break below the $63.88 support level to confirm further downside.
Bearish Scenario: Downside Continues
70% ProbabilityNeutral Scenario: Consolidation and Choppiness
20% ProbabilityBullish Scenario: Short-Term Bounce
10% ProbabilityFrequently Asked Questions: XAGUSD Analysis
What happens if XAGUSD breaks below the critical $63.88 support level?
A decisive break below $63.88, confirmed by a 1-hour candle close, would likely trigger further selling pressure. This could lead to a rapid decline towards the next support levels at $62.07 and potentially $59.09, as indicated by the daily chart's bearish outlook.
Should I consider buying XAGUSD at the current $64.13 level given the oversold RSI?
While the 1-hour RSI at 21.15 signals oversold conditions, the overall trend remains strongly bearish across multiple timeframes. A 70% probability scenario suggests further downside. It's advisable to wait for a confirmed bullish setup, such as a break above immediate resistance or a clear reversal pattern, rather than buying into a strong downtrend.
Is the RSI at 21.15 on the 1-hour chart a reliable buy signal for XAGUSD?
An RSI reading of 21.15 indicates extreme oversold conditions on the 1-hour chart, suggesting a potential for a short-term bounce. However, it is not a standalone buy signal, especially when juxtaposed with strong bearish trends on higher timeframes and a strengthening DXY. Confirmation from price action and other indicators is crucial.
How will the current DXY strength at 101.03 affect XAGUSD's trajectory this week?
The DXY's current level of 101.03 and its strong upward momentum create significant headwinds for silver. This inverse correlation suggests that continued dollar strength will likely keep downward pressure on XAGUSD, making a sustained rally difficult unless the dollar reverses its trend or geopolitical events dramatically shift safe-haven flows.
Technical Outlook Summary
| Indicator | Value | Signal | Interpretation |
|---|---|---|---|
| RSI (14) | 21.15 | Oversold | Potential for short-term bounce, but trend remains bearish. |
| MACD Histogram | -1.50 | Negative Momentum | Sellers are in control, but momentum may be slowing. |
| Stochastic | K:5.72 D:6.76 | Extreme Oversold | Suggests immediate exhaustion of sellers. |
| ADX | 39.29 | Strong Trend | Confirms a powerful bearish trend on 1H. |
| Bollinger Bands | Lower Band | Below Band | Indicates oversold conditions or breakdown. |
Track markets in real-time
AI-powered analysis, technical indicators and real-time price data.
Join Our Telegram Channel
Breaking market news, AI analysis and trading signals instantly.
Join Channel