The relentless tug-of-war between bulls and bears in the silver market has reached a critical juncture, with XAGUSD currently hovering precariously around the $67.30 mark. This pivotal price point is more than just a number; it represents a battleground where fundamental forces and technical signals are clashing, dictating the short-to-medium term trajectory of the precious metal. For traders and investors alike, understanding the intricate dance between macroeconomic drivers, geopolitical shifts, and the technical underpinnings of silver's price action is paramount. As the dust settles from recent market volatility, the question on everyone's mind is whether current levels offer a potential buying opportunity or signal further downside. This analysis delves into the 'why' behind silver's current predicament, exploring the data that supports both bullish and bearish arguments, and ultimately, what the charts are telling us about the path forward.
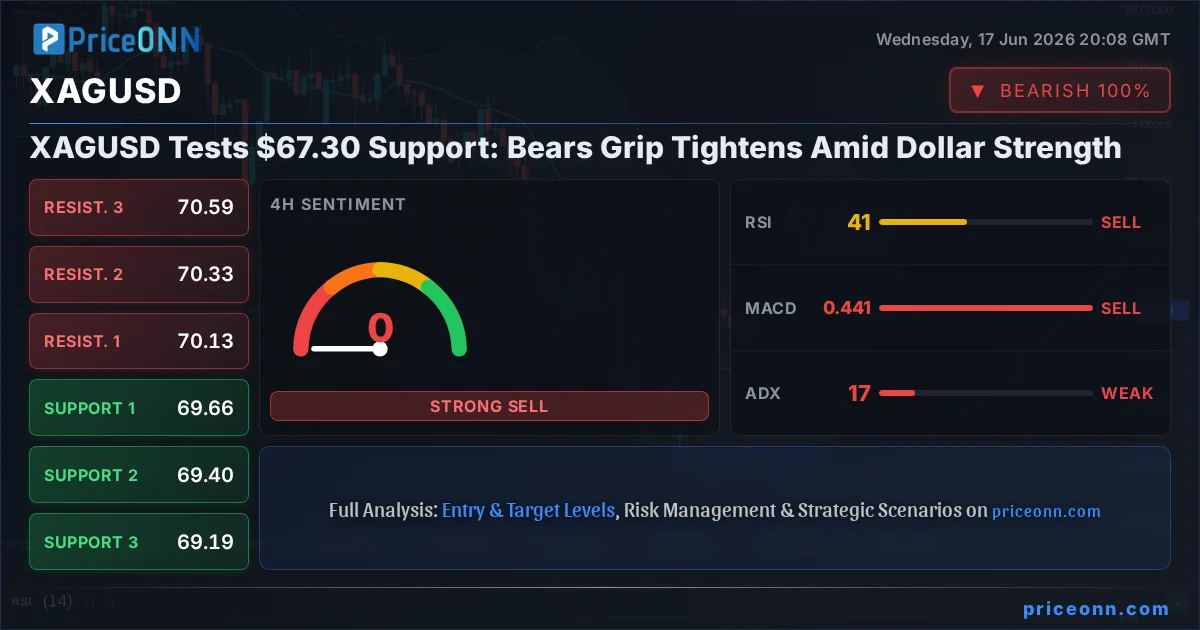
- Silver's RSI(14) is currently at 29.22 on the 1H timeframe, signaling oversold conditions and a potential short-term buying opportunity.
- The ADX on the 1H chart is 18.41, indicating a weak trend, suggesting consolidation or a lack of strong directional conviction among market participants.
- Critical support levels for XAGUSD are identified at $67.03 and $65.42, while resistance lies at $70.72 and $72.33.
- The strengthening US Dollar Index (DXY), currently at 100.57, is exerting downward pressure on XAGUSD, a common correlation observed in the market.
The Bearish Case: Why $67.30 Could Be Just the Beginning
Dollar Dominance and Macroeconomic Headwinds
The primary narrative weighing on silver prices, currently trading at $67.30, is the resurgent strength of the US Dollar. The Dollar Index (DXY) has surged by 1% today, reaching 100.57. This upward movement, often inversely correlated with commodities like silver, suggests that the greenback is regaining its footing, potentially driven by a combination of risk aversion and shifting interest rate expectations. While the market data indicates that the 1-hour RSI is deep in oversold territory at 29.22, this alone is not enough to reverse the broader bearish trend, especially when faced with a strong dollar. Higher interest rates, or the anticipation thereof, tend to make non-yielding assets like silver less attractive, as investors can earn a better return on dollar-denominated assets. Furthermore, any signs of cooling inflation or a less hawkish stance from the Federal Reserve could further bolster the dollar and put additional pressure on precious metals.
The recent market news, such as the DOW hitting a record high due to falling oil prices offsetting Fed fears, paints a complex picture. While falling oil prices (WTI is down 0.69% to $76.10, Brent down 1.13% to $79.05) might typically be seen as disinflationary and thus bearish for commodities, the context here is crucial. If oil prices fall due to weakening global demand, it signals a broader economic slowdown, which would naturally reduce demand for industrial metals like silver. JP Morgan’s note that falling oil prices could be a “massive tailwind for global stock markets” suggests a potential rotation out of commodities and into equities, further diminishing silver’s appeal in the short term. This macro backdrop, characterized by dollar strength and potential demand concerns, creates a challenging environment for silver, pushing its price towards the $67.30 level and potentially lower.
Technical Signals Pointing South
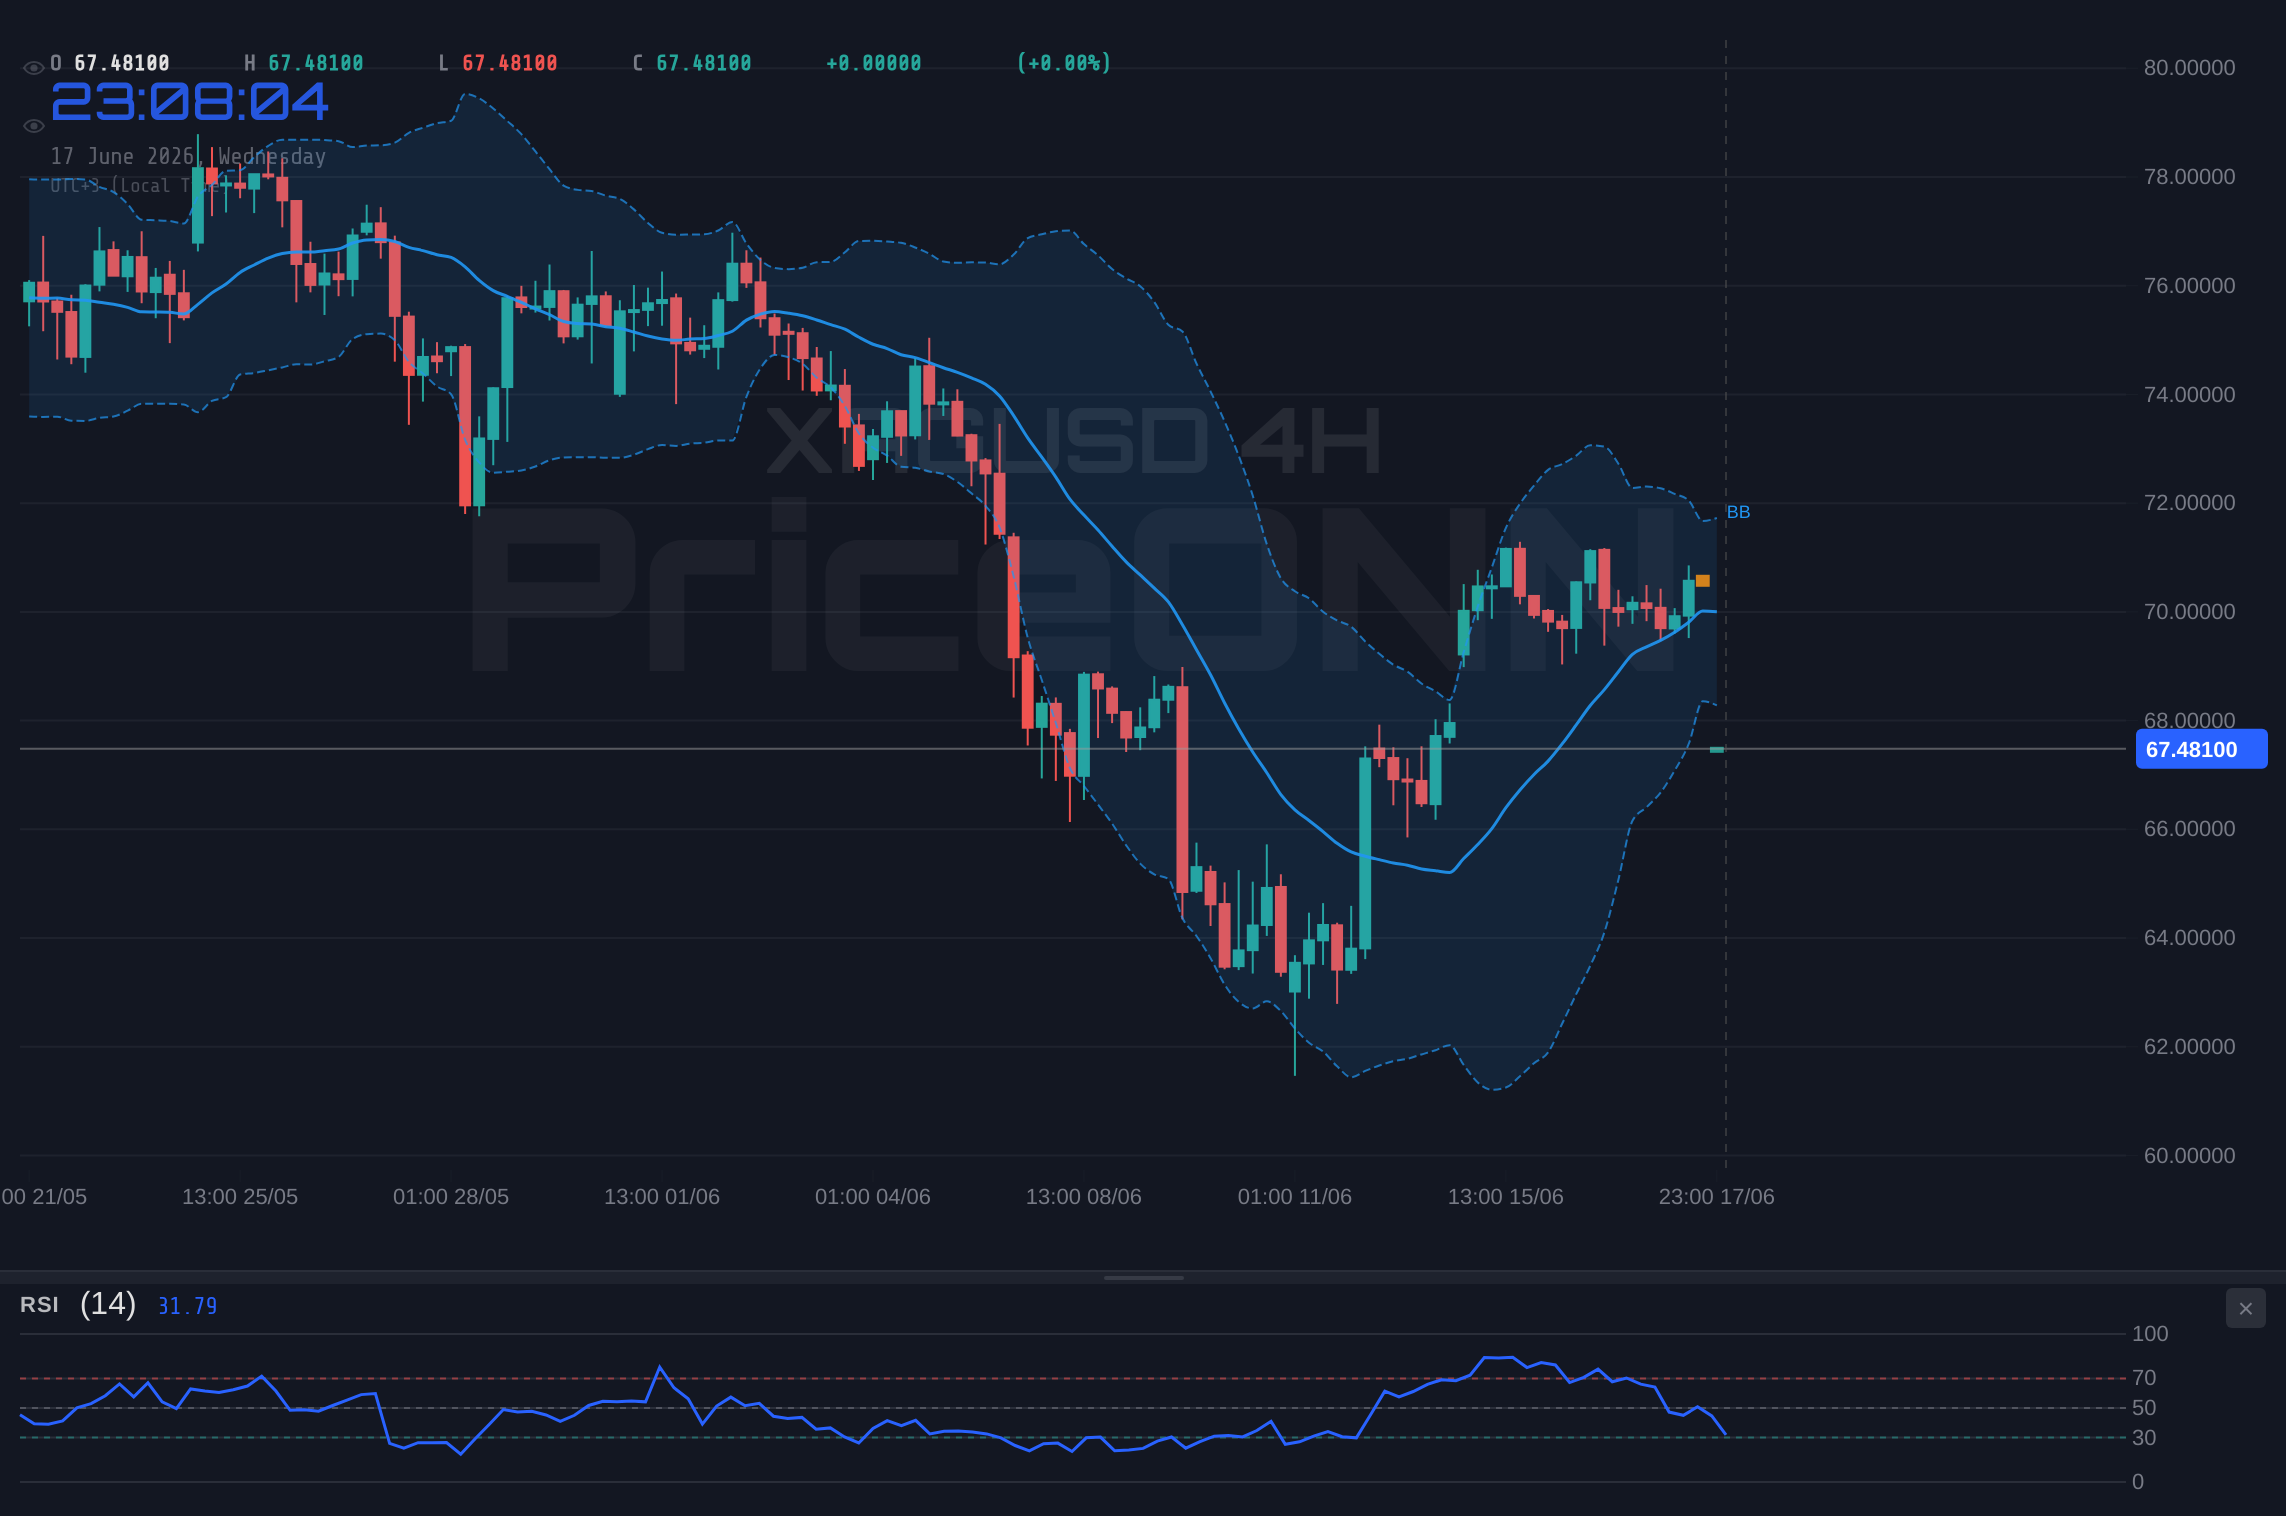
Delving into the technicals, the picture for XAGUSD at $67.30 is predominantly bearish across multiple timeframes. On the 1-hour chart, while the RSI at 29.22 screams oversold, the ADX reading of 20.16 indicates only a medium-strength downtrend, suggesting that the current selling pressure might not yet have reached its peak. The MACD is firmly below its signal line, confirming negative momentum. Bollinger Bands are also showing price action below the lower band, a classic sign of strong bearish momentum or potential capitulation. The Stochastic Oscillator, with K at 41.18 and D at 72.55, further supports a bearish outlook, as the K line is below the D line, indicating a downward trajectory. The overall signal for the 1H timeframe is a strong 'SELL'.
The 4-hour timeframe echoes this sentiment, though with slightly less conviction. The trend is still marked as 'Uptrend' with 86% strength, but the RSI at 40.86 and MACD below its signal line point towards weakening upward momentum or a continuation of the downtrend. The Stochastic K line (31.39) is below the D line (45.64), reinforcing the bearish bias. The ADX at 21.85 confirms a medium-strength downtrend. However, it's the daily chart that paints the most concerning picture for silver bulls. The trend is definitively 'Downtrend' with 98% strength. RSI at 39.53, MACD below signal, and Bollinger Bands below the middle band all scream caution. The ADX at 35.48 indicates a strong downtrend. While the daily Stochastic shows a potential buy signal (%K > %D), it often lags in strong downtrends and can be a false signal. The overwhelming consensus from the technical indicators across these timeframes, particularly the daily chart's strong downtrend signal, suggests that the pressure is firmly on the bears to push XAGUSD below the $67.30 level and towards lower support points.
For XAGUSD, the immediate support level to monitor is $67.03. A decisive break below this could open the door for a test of the next significant support at $65.42. Conversely, failure to hold these levels might signal a deeper correction.
Geopolitical Tensions and Their Dampening Effect
While geopolitical tensions often act as a catalyst for safe-haven assets like gold, their impact on silver can be more nuanced. Recent news suggests a tentative US-Iran deal and potential easing of Middle East tensions, which could reduce the 'fear premium' often embedded in commodity prices. While Financial Times reported that the ECB believes an Iran peace deal won't erase Europe's energy price shock, the very prospect of de-escalation can dampen demand for safe havens. If geopolitical risks subside, investors might feel more comfortable moving capital away from perceived safe assets and into riskier, higher-yielding investments, which would be detrimental to silver prices. The analyst report highlighting Barrick Mining (a gold producer) as a top metals pick suggests a focus on gold as the primary beneficiary of any safe-haven demand, potentially leaving silver to be driven more by industrial demand and broader market sentiment, which currently appears weak.
The Bullish Counter-Argument: Is Silver Poised for a Rebound?
The Allure of Oversold Conditions and Potential Rate Cuts
Despite the prevailing bearish sentiment, the technical indicators on the shorter timeframes present a compelling case for a potential silver rebound from current levels around $67.30. The 1-hour RSI at 29.22 is deeply entrenched in oversold territory, a condition that historically precedes bounces, especially after sharp declines. Similarly, the 4-hour RSI at 40.2, while not oversold, is far from overbought, suggesting room for upward movement. The Stochastic Oscillator on the daily chart, with %K at 56 and %D at 33.32, even shows a bullish signal (%K > %D), indicating that the selling momentum might be exhausted. This divergence between the strong daily downtrend signal and the potential daily Stochastic buy signal warrants attention.
The fundamental backdrop, while currently dollar-supportive, could shift if central banks, particularly the Federal Reserve, begin to pivot towards looser monetary policy. If inflation shows signs of sustained cooling – perhaps influenced by the falling oil prices mentioned earlier – the Fed might be compelled to signal or enact interest rate cuts sooner than anticipated. Such a move would typically weaken the dollar and boost non-yielding assets like gold and silver. While the immediate data doesn't strongly support this, market participants are always looking ahead, and any hint of a dovish shift from the Fed could trigger a significant short-covering rally in silver. The fact that the DOW is rising despite Fed fears, as reported, suggests that markets are pricing in some form of economic resilience or perhaps a 'soft landing' scenario where rate cuts become feasible without a severe recession, which could eventually benefit industrial metals.
Historical Precedents and Industrial Demand Factors
Historically, silver has often seen sharp V-shaped recoveries after significant sell-offs, particularly when oversold conditions align with a shift in macroeconomic sentiment. The current price action around $67.30, with its deep RSI readings on shorter timeframes, could be the precursor to such a recovery. Furthermore, the long-term outlook for silver remains fundamentally strong, driven by its critical role in industrial applications. As the world transitions towards green energy, the demand for silver in solar panels, electric vehicles, and advanced electronics is expected to surge. While current macroeconomic headwinds might be overshadowing this long-term demand story, any significant improvement in global growth prospects or a de-escalation of geopolitical tensions could quickly bring industrial demand back into focus, providing a solid floor for prices.
The analyst report mentioning Barrick Mining as a top metals pick, while focused on gold, does indicate a sector-wide interest in precious metals. If gold continues its upward trajectory, as some reports suggest (XAUUSD up 2% since week opening), silver often follows suit, albeit with higher volatility. The current price spread between gold and silver could also present an arbitrage opportunity, potentially drawing in buyers to silver if it becomes relatively undervalued compared to gold. While the ADX at 20.16 on the 1H chart suggests a weak trend, this can also be interpreted as a period of consolidation before a potential upward move, especially given the oversold RSI. The key for bulls will be to defend the $67.03 support and aim for a convincing break above the $70.72 resistance.
A sustained close above the 1-hour resistance at $70.72, coupled with a break of the 4-hour middle Bollinger Band, could signal the start of a short-term recovery, especially if the DXY shows signs of stalling.
The Role of Market Sentiment and Liquidity
Market sentiment is currently skewed towards bearishness, as evidenced by the strong 'SELL' signals across most timeframes. However, sentiment can shift rapidly, especially if key economic data surprises to the upside or if central banks signal a more dovish stance. The current weakness in oil prices, if interpreted as a sign of economic resilience rather than a harbinger of recession, could boost risk appetite and indirectly support industrial metals like silver. Furthermore, liquidity conditions are crucial. If major market participants are holding significant short positions, a catalyst could trigger a rapid short-covering rally, pushing prices higher quickly. The deep oversold readings on the 1-hour chart suggest that such a rally could be sharp, even if it lacks long-term conviction without fundamental changes. Traders will be closely watching for any signs of capitulation on the downside or a decisive shift in intraday momentum as confirmation of a potential reversal.
The Verdict: Navigating the Uncertainty at $67.30
Weighing the Evidence: Bears Have the Edge, But Watch for Reversals
When weighing the evidence, the bears currently hold a more convincing argument for XAGUSD trading at $67.30. The daily chart’s strong downtrend signal, coupled with the persistent strength of the US Dollar Index (DXY at 100.57), creates significant headwinds. The macroeconomic environment, characterized by concerns over global demand (as suggested by falling oil prices) and the potential for higher-for-longer interest rates, does not favor commodities. The technical picture on the daily timeframe is overwhelmingly bearish, with RSI below 40 and MACD showing negative momentum. While shorter timeframes present oversold conditions (1H RSI at 29.22), these are often temporary pauses within a larger downtrend, particularly when the dominant trend is so strong.
However, to dismiss the possibility of a short-term bounce would be imprudent. The deep oversold readings on the 1-hour chart, combined with the potential for a Fed pivot if inflation data surprises, could lead to a quick snap-back rally. Such a move would likely target the nearest resistance levels, such as $70.72. The key for traders is to remain vigilant and manage risk effectively. The current ADX readings suggest that while a downtrend is in place, it's not necessarily accelerating with extreme force across all timeframes, leaving room for volatility and potential reversals. The $67.03 support level is critical; a failure to hold it would likely confirm the bearish thesis and open the door for further declines towards $65.42. Conversely, a strong bounce from $67.30, especially if accompanied by a weakening DXY, could signal a temporary reprieve for silver bulls.
Forward-Looking Commentary: What's Next for Silver?
The immediate future for XAGUSD hinges on several key factors. Firstly, the direction of the US Dollar will be paramount. Any sign of weakness in the DXY, perhaps triggered by upcoming economic data or central bank commentary, could provide immediate relief for silver. Secondly, upcoming economic releases, such as inflation figures (CPI) or employment data (NFP), will be crucial in shaping expectations for Federal Reserve policy. A softer inflation print or a weaker jobs report could increase the probability of Fed rate cuts, which would be bullish for silver. Conversely, hotter-than-expected data would likely reinforce dollar strength and keep silver prices under pressure.
Geopolitically, while major escalations might be priced out, any renewed flare-ups in key regions could reignite safe-haven demand for precious metals. However, the current narrative seems to be shifting away from pure geopolitical risk towards economic fundamentals and monetary policy. For traders, the strategy should be one of caution and patience. Waiting for clear confirmation of a trend reversal or a decisive break of key support/resistance levels is advisable. The $67.30 level represents a battleground, and while the bears currently have the upper hand, the oversold conditions on shorter timeframes suggest that a bounce is plausible. Monitoring price action around $67.03 and $70.72 will be crucial in determining the next directional move.
Frequently Asked Questions: XAGUSD Analysis
What happens if XAGUSD breaks below the $67.03 support level?
A break below $67.03 would confirm the bearish sentiment, likely triggering further selling pressure. The next significant support level to watch would be $65.42, and a move towards this level would signal a deeper correction in the silver market.
Is RSI at 29.22 a buy signal for XAGUSD at current $67.30 levels?
An RSI of 29.22 on the 1-hour chart indicates oversold conditions, suggesting a potential short-term bounce. However, on the daily chart, the RSI is still around 39.53, showing a prevailing downtrend. Therefore, while a bounce is possible, it's not a strong standalone buy signal without further confirmation.
What does the ADX reading of 18.41 tell us about the XAGUSD trend analysis?
An ADX value of 18.41 signifies a weak trend. This suggests that the current market conditions are not strongly directional, meaning price movements might be more range-bound or prone to reversals. It implies that neither bulls nor bears have firm control, and consolidation could be likely until a stronger trend emerges.
How will the upcoming NFP data affect XAGUSD this week, given the current $67.30 price?
Stronger-than-expected NFP data could boost the US Dollar and put further downward pressure on XAGUSD, potentially pushing it below $67.30. Conversely, weaker NFP results might weaken the dollar and support a silver rebound towards resistance levels like $70.72.
Track markets in real-time
AI-powered analysis, technical indicators and real-time price data.
Join Our Telegram Channel
Breaking market news, AI analysis and trading signals instantly.
Join Channel