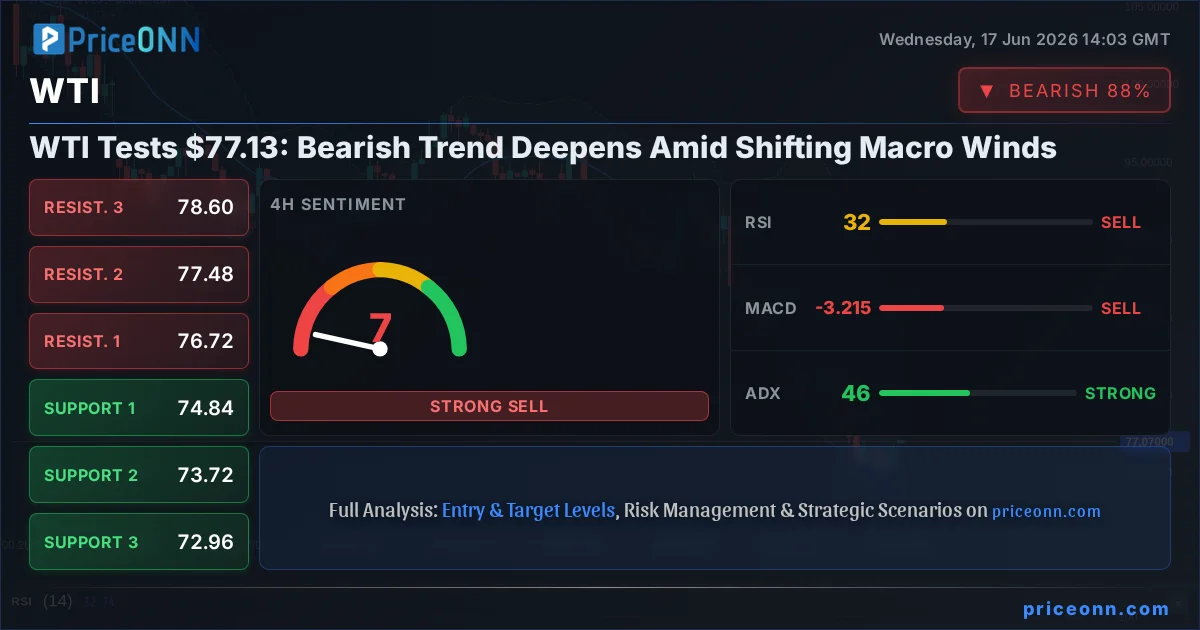
The tug-of-war in the oil markets continues, with WTI crude currently trading at $77.13. This price point is more than just a number; it's a battleground where the forces of a strengthening dollar, waning risk appetite, and persistent geopolitical undertones clash. While short-term technicals show some signs of life, the overarching trend on longer timeframes paints a decidedly bearish picture, suggesting that the recent price action might be a bear market rally rather than a sustainable recovery. Understanding the interplay between macroeconomic drivers and the fundamental supply/demand dynamics is crucial for navigating this complex landscape.
- WTI crude is trading at $77.13, with the 1-hour chart showing a neutral trend but the 4-hour and daily charts indicating a strong bearish bias.
- The US Dollar Index (DXY) at 99.68 is strengthening, putting pressure on dollar-denominated commodities like WTI.
- Weakening risk appetite, evidenced by SP500's neutral 4H and bearish 1D trends, suggests a flight to safety, not commodities.
- RSI on the 4H (32) and 1D (31.05) charts for WTI points towards oversold conditions, potentially signaling a short-term bounce, but the ADX on these timeframes (45.56 and 19.59 respectively) indicates strong bearish trends or consolidation.
- Geopolitical tensions, while present, are currently overshadowed by macroeconomic concerns, particularly the Federal Reserve's stance and inflation data.
The Bear Case: Macroeconomic Headwinds Mount
The most significant headwind for WTI crude at $77.13 is the strengthening US Dollar Index (DXY), currently at 99.68. Historically, a rising DXY often spells trouble for oil prices, as oil is priced in dollars. When the dollar strengthens, it becomes more expensive for holders of other currencies to purchase oil, thus dampening demand. This inverse correlation is a well-established market dynamic, and with the DXY showing a strong bullish signal on the 1-hour and 4-hour charts, and a neutral yet firm stance on the daily, this trend is likely to persist, adding downward pressure on WTI.
Furthermore, the broader market sentiment, as indicated by major equity indices, leans towards caution rather than exuberance. The SP500, a key barometer of risk appetite, exhibits a neutral trend on the 4-hour chart (62.83 RSI) but a decidedly bearish trend on the daily chart (45.35 RSI). Similarly, the Nasdaq100 shows bearish signals on the 1-hour and 4-hour charts. This risk-off environment typically leads investors to shy away from riskier assets like commodities and seek refuge in safer havens. The fact that WTI is not seeing significant safe-haven buying despite geopolitical undertones, as suggested by the Brent 4H and 1D charts being deeply bearish, underscores the dominance of macroeconomic fears over immediate supply disruption concerns.
The Federal Reserve's monetary policy remains a critical factor. While specific Fed meeting minutes or rate hike probabilities weren't provided in the market data, the general expectation of a hawkish stance or a prolonged period of higher interest rates globally impacts growth expectations. Higher interest rates increase borrowing costs for businesses and consumers, potentially slowing economic activity and, consequently, reducing demand for energy. This macroeconomic backdrop is a powerful force suppressing oil prices, making any upside rallies in WTI appear more like tactical bounces within a larger downtrend rather than the start of a new bull cycle.
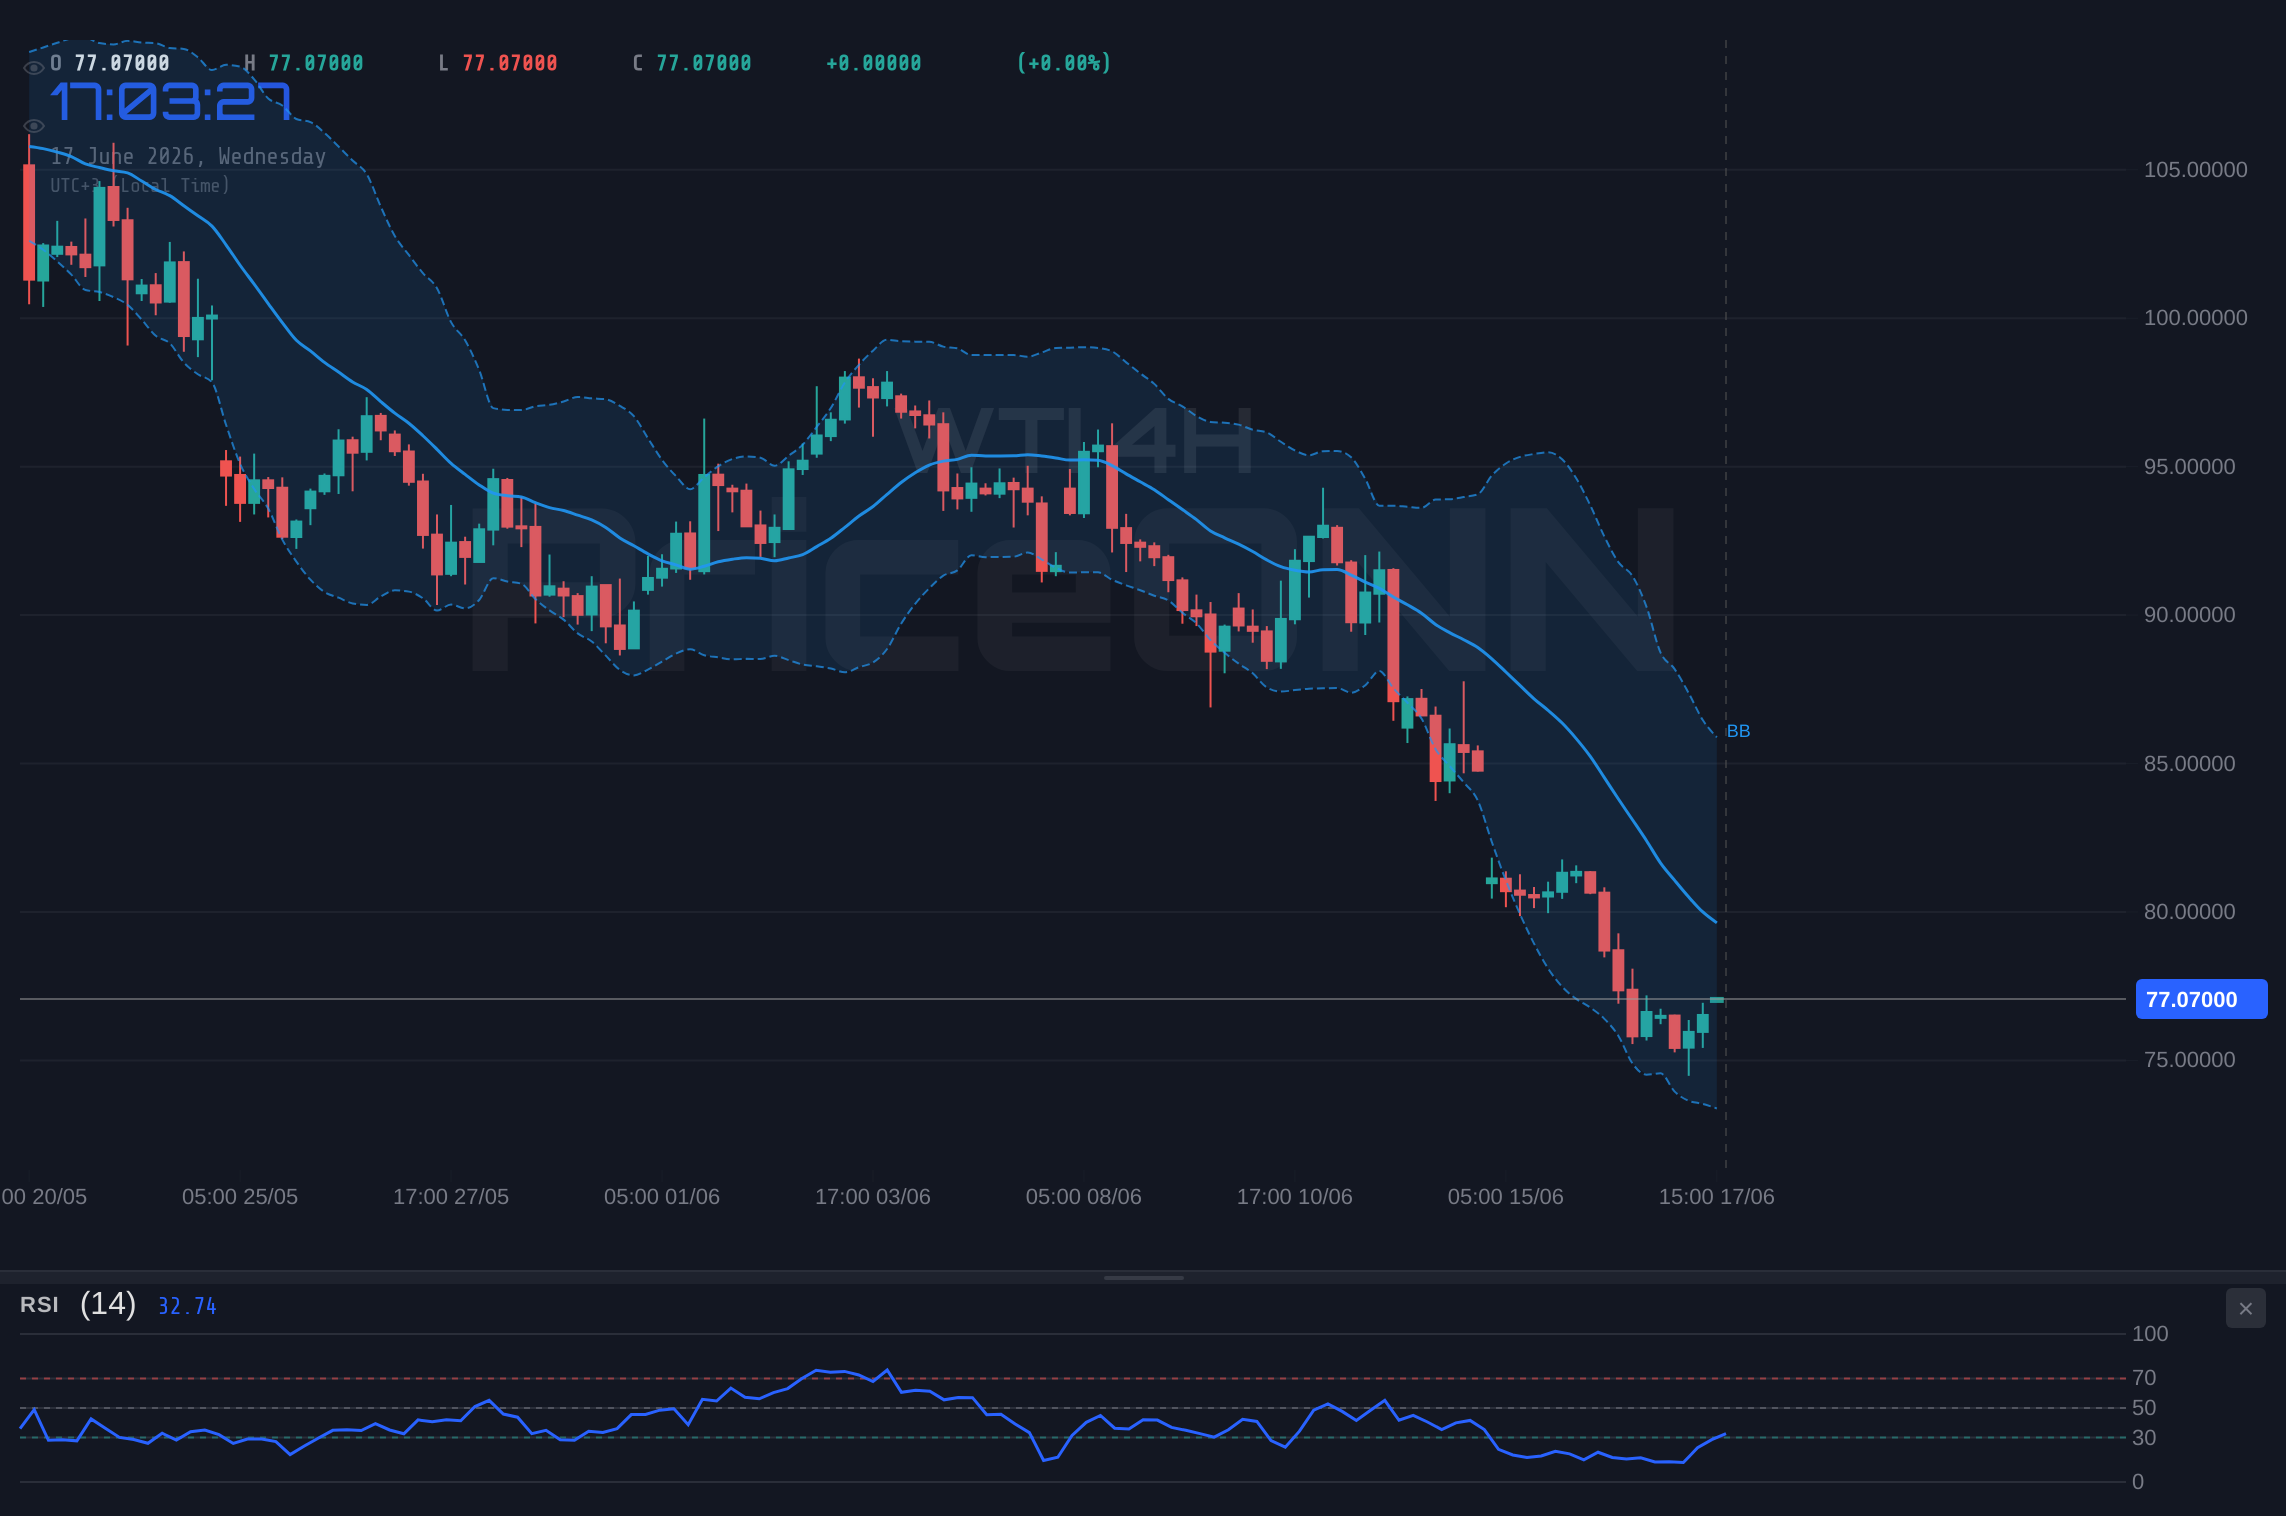
Looking at the technical indicators on WTI, the longer-term charts (4H and 1D) reinforce the bearish narrative. The ADX on the 4-hour chart stands at a robust 45.56, indicating a strong bearish trend. While the 1D ADX is lower at 19.59, it still suggests a trend is in play. The RSI on the 1D chart at 31.05 is indeed in oversold territory, which might suggest a near-term bounce. However, the MACD on both the 4H and 1D charts shows negative momentum, with the MACD line below the signal line, confirming the bearish pressure. The Bollinger Bands on the daily chart are also below the middle band, indicating a bearish bias. This confluence of bearish signals across multiple timeframes, driven by macro factors, presents a formidable challenge for any bullish resurgence.
The Bull Case: Technical Bounces and Geopolitical Wildcards
Despite the prevailing bearish sentiment, there are arguments to be made for a potential rebound in WTI, particularly from a short-term technical perspective. The 1-hour chart for WTI shows a neutral trend with a relatively strong ADX of 36.85, but the RSI at 52.16 and Stochastic K line above D (90.44 vs 75.3) suggest some upward momentum building. The price is trading above the middle Bollinger Band on this timeframe, and the MACD has positive momentum. This setup, while fragile, could lead to a short-term move higher, testing resistance levels around $76.73 or even $76.94.
Moreover, the longer-term daily charts for WTI do show RSI values in the oversold territory (31.05). Historically, readings below 30 on the RSI can signal an impending reversal or at least a significant bounce. While the ADX on the 1D chart is weaker at 19.59, suggesting a lack of strong trend direction, the oversold RSI could be a precursor to a short-covering rally. Traders looking for opportunities might see this as a potential entry point, anticipating a reversion to the mean or a technical correction. The Stochastic indicator on the 1D chart also shows a bullish signal with %K (8.25) crossing above %D (17.32), further supporting the idea of a potential short-term upswing.
Geopolitical risks, though currently subdued by macroeconomic concerns, remain a potent wildcard. The provided news snippets mention ongoing tensions in the Middle East and a tentative U.S.-Iran deal. While the latter might suggest easing supply risks, any escalation or unexpected development in regions critical for oil production can rapidly shift market sentiment. Reports of potential disruptions, even if not immediately materializing into supply shortages, can trigger sharp price spikes as traders price in the risk premium. The Brent crude data, with its deeply bearish longer-term trends, might suggest that the market is currently discounting these risks, but a sudden geopolitical flare-up could quickly invalidate this assumption and send WTI prices soaring.
Furthermore, the sheer extent of the bearish technical setup on longer timeframes, particularly for Brent crude, might be creating an environment ripe for a contrarian trade. When indicators reach extreme oversold levels, as seen with Brent's RSI at 28.73 on the daily chart, the probability of a snap-back increases. If WTI were to follow suit and experience a sharp technical bounce, it could catch many short-sellers off guard. This dynamic, combined with the possibility of a short-covering rally fueled by short-term technical signals, presents the core of the bullish argument, however tenuous it may appear against the backdrop of macroeconomic headwinds.
Bridging the Divide: What the Data Tells Us
When we reconcile the bullish and bearish arguments, the data strongly favors the bears, especially on medium to long-term horizons. The consistent strength of the DXY, the risk-off sentiment reflected in equities, and the bearish technicals on the 4-hour and daily charts for WTI itself all point towards continued downward pressure. The 1-hour chart's bullish signals are currently being overwhelmed by the dominant bearish trends on higher timeframes. This is a classic scenario where short-term noise is drowned out by the louder signal of macroeconomic fundamentals.
The ADX values are particularly telling. On the 4-hour chart, the ADX at 45.56 signifies a very strong bearish trend. While the 1D ADX is lower at 19.59, indicating a less defined trend, it doesn't negate the overall bearish momentum. The RSI readings in the oversold zone on longer timeframes are indeed a point of caution for bears, suggesting that aggressive shorting might be risky without confirmation of trend continuation. However, in the current macro environment, oversold conditions can persist for extended periods. The MACD on the 1D chart, despite showing positive momentum, has the MACD line below the signal line, indicating bearish pressure is still in play.
The interplay between WTI and other markets is also key. The fact that SP500 and Nasdaq are showing bearish tendencies suggests that capital is moving away from risk assets, which typically includes commodities like oil. If these indices were showing strong bullish trends, it might provide a tailwind for WTI, but the opposite is currently true. The provided news about falling oil prices potentially easing pressure on India's trade deficit also hints at a supply-side narrative that might be more dominant than demand-driven inflation fears at this moment, further supporting a bearish outlook for prices.
Ultimately, while short-term traders might find opportunities for tactical long positions based on the 1-hour chart's oversold indicators, the broader market structure and macroeconomic environment suggest that any rallies are likely to be met with selling pressure. The current price of $77.13 for WTI sits within a range where significant resistance is expected on higher timeframes, and the fundamental drivers are not yet aligned for a sustained bullish reversal. The focus remains on inflation data, central bank policy, and geopolitical stability, all of which currently lean towards a more subdued or bearish outlook for oil prices.
Navigating the Current Landscape: What to Watch
For traders and investors monitoring WTI, the $77.13 level represents a critical juncture. The immediate focus should be on the strength of the US dollar and the sentiment in major equity indices. A continued rise in the DXY above 99.73, coupled with further weakness in the SP500 below its 4-hour support at 6533.23, would likely reinforce the bearish trend for WTI. Conversely, a significant shift in risk appetite or a dovish surprise from central banks could provide a reprieve, but current data does not strongly support this scenario.
Technically, the key levels to watch on the downside are the 4-hour support at 74.84 and the 1-day support at 74.26. A break below these levels would confirm the deepening of the bearish trend and open the door for further declines. On the upside, immediate resistance lies at the 1-hour level of 76.73, followed by the more significant 4-hour resistance at 80.15. A sustained move above the 4-hour resistance would be needed to invalidate the current bearish outlook, but this seems unlikely given the macro environment.
The RSI on the daily chart, currently at 31.05, is a point of interest. A sustained move above 40 would be the first sign of potential weakening of the bearish momentum. Similarly, on the 4-hour chart, the ADX at 45.56 indicates a strong bearish trend that needs to break down significantly before any bullish thesis can be seriously considered. Until then, any upward movements should be treated with caution, as they are likely to be short-lived and potentially offer better selling opportunities within the prevailing downtrend.
The geopolitical situation remains a background risk. While the market seems to be discounting immediate supply disruptions, any sudden escalation in global conflicts or unexpected production outages could quickly alter the price trajectory. However, based on the current data and the overwhelming influence of macroeconomic factors, the path of least resistance for WTI crude appears to be downwards. Traders should remain vigilant, manage their risk exposure carefully, and await clearer signals of a trend reversal before committing to long positions.
Bearish Scenario: Trend Continuation
70% ProbabilityNeutral Scenario: Consolidation Around $77
20% ProbabilityBullish Scenario: Technical Bounce
10% ProbabilityFrequently Asked Questions: WTI Analysis
What happens if WTI breaks below $74.26 support?
A break below $74.26 on the daily chart would confirm the deepening bearish trend, invalidating any short-term bullish arguments and likely triggering further downside towards the $71.90 support level. This would signal that macroeconomic headwinds are overpowering any minor technical bounces.
Should I consider buying WTI at current levels around $77.13 given the oversold RSI?
Buying purely based on an oversold RSI around $77.13 carries significant risk due to the strong bearish trend indicated by the ADX and MACD on higher timeframes. While a technical bounce is possible, it's advisable to wait for confirmation, such as a sustained close above $80.15 resistance, or to target short-term moves with tight risk management.
Is the RSI at 31.05 on the daily chart a sell signal for WTI?
An RSI of 31.05 on the daily chart is considered oversold, which typically suggests a potential for a bounce rather than an immediate sell signal. However, in a strong downtrend, oversold conditions can persist. The bearish MACD and ADX readings suggest that while a bounce might occur, the overall trend remains down.
How will continued DXY strength affect WTI prices this week?
Continued strength in the US Dollar Index (DXY), currently at 99.68, is expected to exert downward pressure on WTI prices. As the dollar strengthens, oil becomes more expensive for foreign buyers, potentially reducing demand and pushing WTI towards its support levels, especially if macroeconomic concerns continue to dominate market sentiment.
The battle at $77.13 for WTI crude is far from over, but the current data paints a cautious picture. While short-term traders may find fleeting opportunities on the 1-hour chart, the prevailing macroeconomic headwinds and longer-term technical indicators suggest that the bearish trend remains firmly in control. Patience and discipline will be key for navigating this market. Wait for clear signals of trend exhaustion or confirmation of a sustained move, rather than chasing short-term fluctuations. The market always provides opportunities for those who are prepared and manage their risk effectively.
Track markets in real-time
AI-powered analysis, technical indicators and real-time price data.
Join Our Telegram Channel
Breaking market news, AI analysis and trading signals instantly.
Join Channel