Silver's $69.85 price is currently hovering precariously close to a significant support level at $68.96. This critical juncture is drawing the attention of traders worldwide, as the metal navigates a complex technical landscape marked by conflicting signals across different timeframes. The question on everyone's mind is whether this support will hold, triggering a rebound, or if the bearish momentum will prevail, pushing prices lower. Understanding the interplay of technical indicators, market sentiment, and broader economic drivers is crucial for deciphering XAGUSD's next move.
- RSI at 46.32 on the 1H chart indicates a bearish trend, with room to fall before oversold territory.
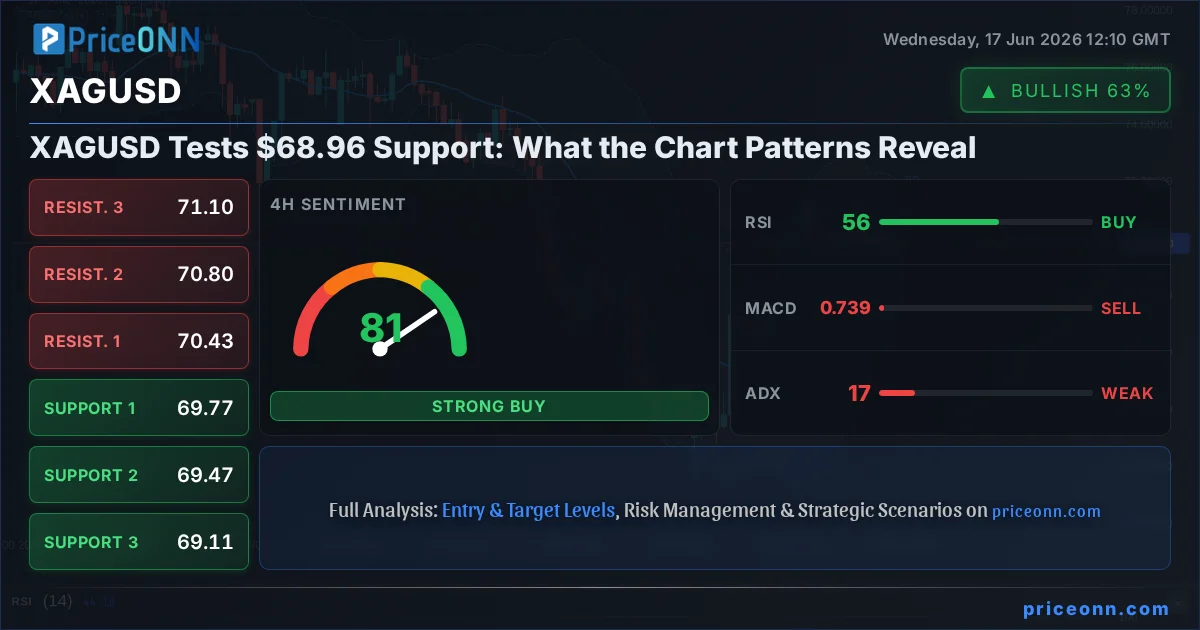
- Critical support sits at $68.96, a level that has historically acted as a floor for price action.
- The ADX at 15.33 on the 1H suggests a weak trend, implying potential for consolidation or a false breakout.
- The DXY at 99.72 is showing strength, often correlating with pressure on silver prices.
The Bear's Roadmap: Testing the $68.96 Line
Short-Term Pressure Mounts
On the 1-hour timeframe, silver (XAGUSD) is exhibiting clear signs of bearish pressure, currently trading at $69.85. The trend strength is a robust 83%, with the price finding itself below the middle Bollinger Band, a common indicator of downward momentum. The RSI(14) at 45.68, while not deeply oversold, leans towards a bearish outlook, suggesting sellers are in control for now. MACD readings further reinforce this sentiment, showing negative momentum with the MACD line below its signal line. The Stochastic oscillator, with K at 39.52 and D at 32.89, shows a slight bullish divergence (%K > %D), hinting at a potential short-term pause or bounce, but the overall trend remains firmly bearish in this immediate timeframe. The ADX at 12.42 signifies a weak trend, which could mean that any downside move might be choppy or face immediate consolidation rather than a sharp waterfall decline, making immediate breakout plays risky.
Daily Timeframe Signals Caution
Shifting to the daily chart, the narrative for XAGUSD remains predominantly bearish, with a strong trend strength of 92%. The current price of $69.85 sits below the middle Bollinger Band, and the RSI(14) at 43.59 reinforces the downward bias. However, here we see a divergence in signals. The MACD is showing positive momentum, with the MACD line above its signal line, contradicting the bearish RSI and Bollinger Band readings. Furthermore, the Stochastic oscillator presents a bullish signal, with K at 62.04 and D at 34.32 (%K > %D), indicating potential upward pressure building from oversold conditions. The ADX at 34.92 confirms a strong trend, but its specific direction in conjunction with the mixed signals from other indicators creates a complex picture. This conflict suggests that while the longer-term trend may still be downwards, there are underlying forces pushing for a potential correction or consolidation phase. The key support level to watch on the daily chart is $68.96, followed by $67.93 and $66.82. Resistance levels are seen at $71.10, $72.21, and $73.25.
The Role of the Dollar Index (DXY)
The strength of the US Dollar Index (DXY) is a critical factor influencing silver's price action. With the DXY currently trading at 99.72 and showing a positive daily change, it exerts downward pressure on commodities like XAGUSD. Historically, a stronger dollar makes dollar-denominated assets, such as silver, more expensive for holders of other currencies, thereby dampening demand. On the 1-hour chart, the DXY's trend is neutral with 50% strength, but its 1-hour signal is AL (Buy), indicating upward potential. The 4-hour trend for DXY is bearish (84% strength), but the signal is AL (Buy), suggesting a potential counter-trend move or a pause in the dollar's decline. The daily timeframe shows a neutral trend (50% strength) with a BUY signal, hinting that the dollar might be finding footing or preparing for a move higher. This aligns with the bearish sentiment seen in XAGUSD, as a rising dollar typically correlates with falling gold and silver prices. Traders are closely watching if the DXY can break above key resistance levels, which would likely add further headwinds for precious metals.
The Bull's Roadmap: Reclaiming the $70.00 Handle
Potential for a Technical Bounce
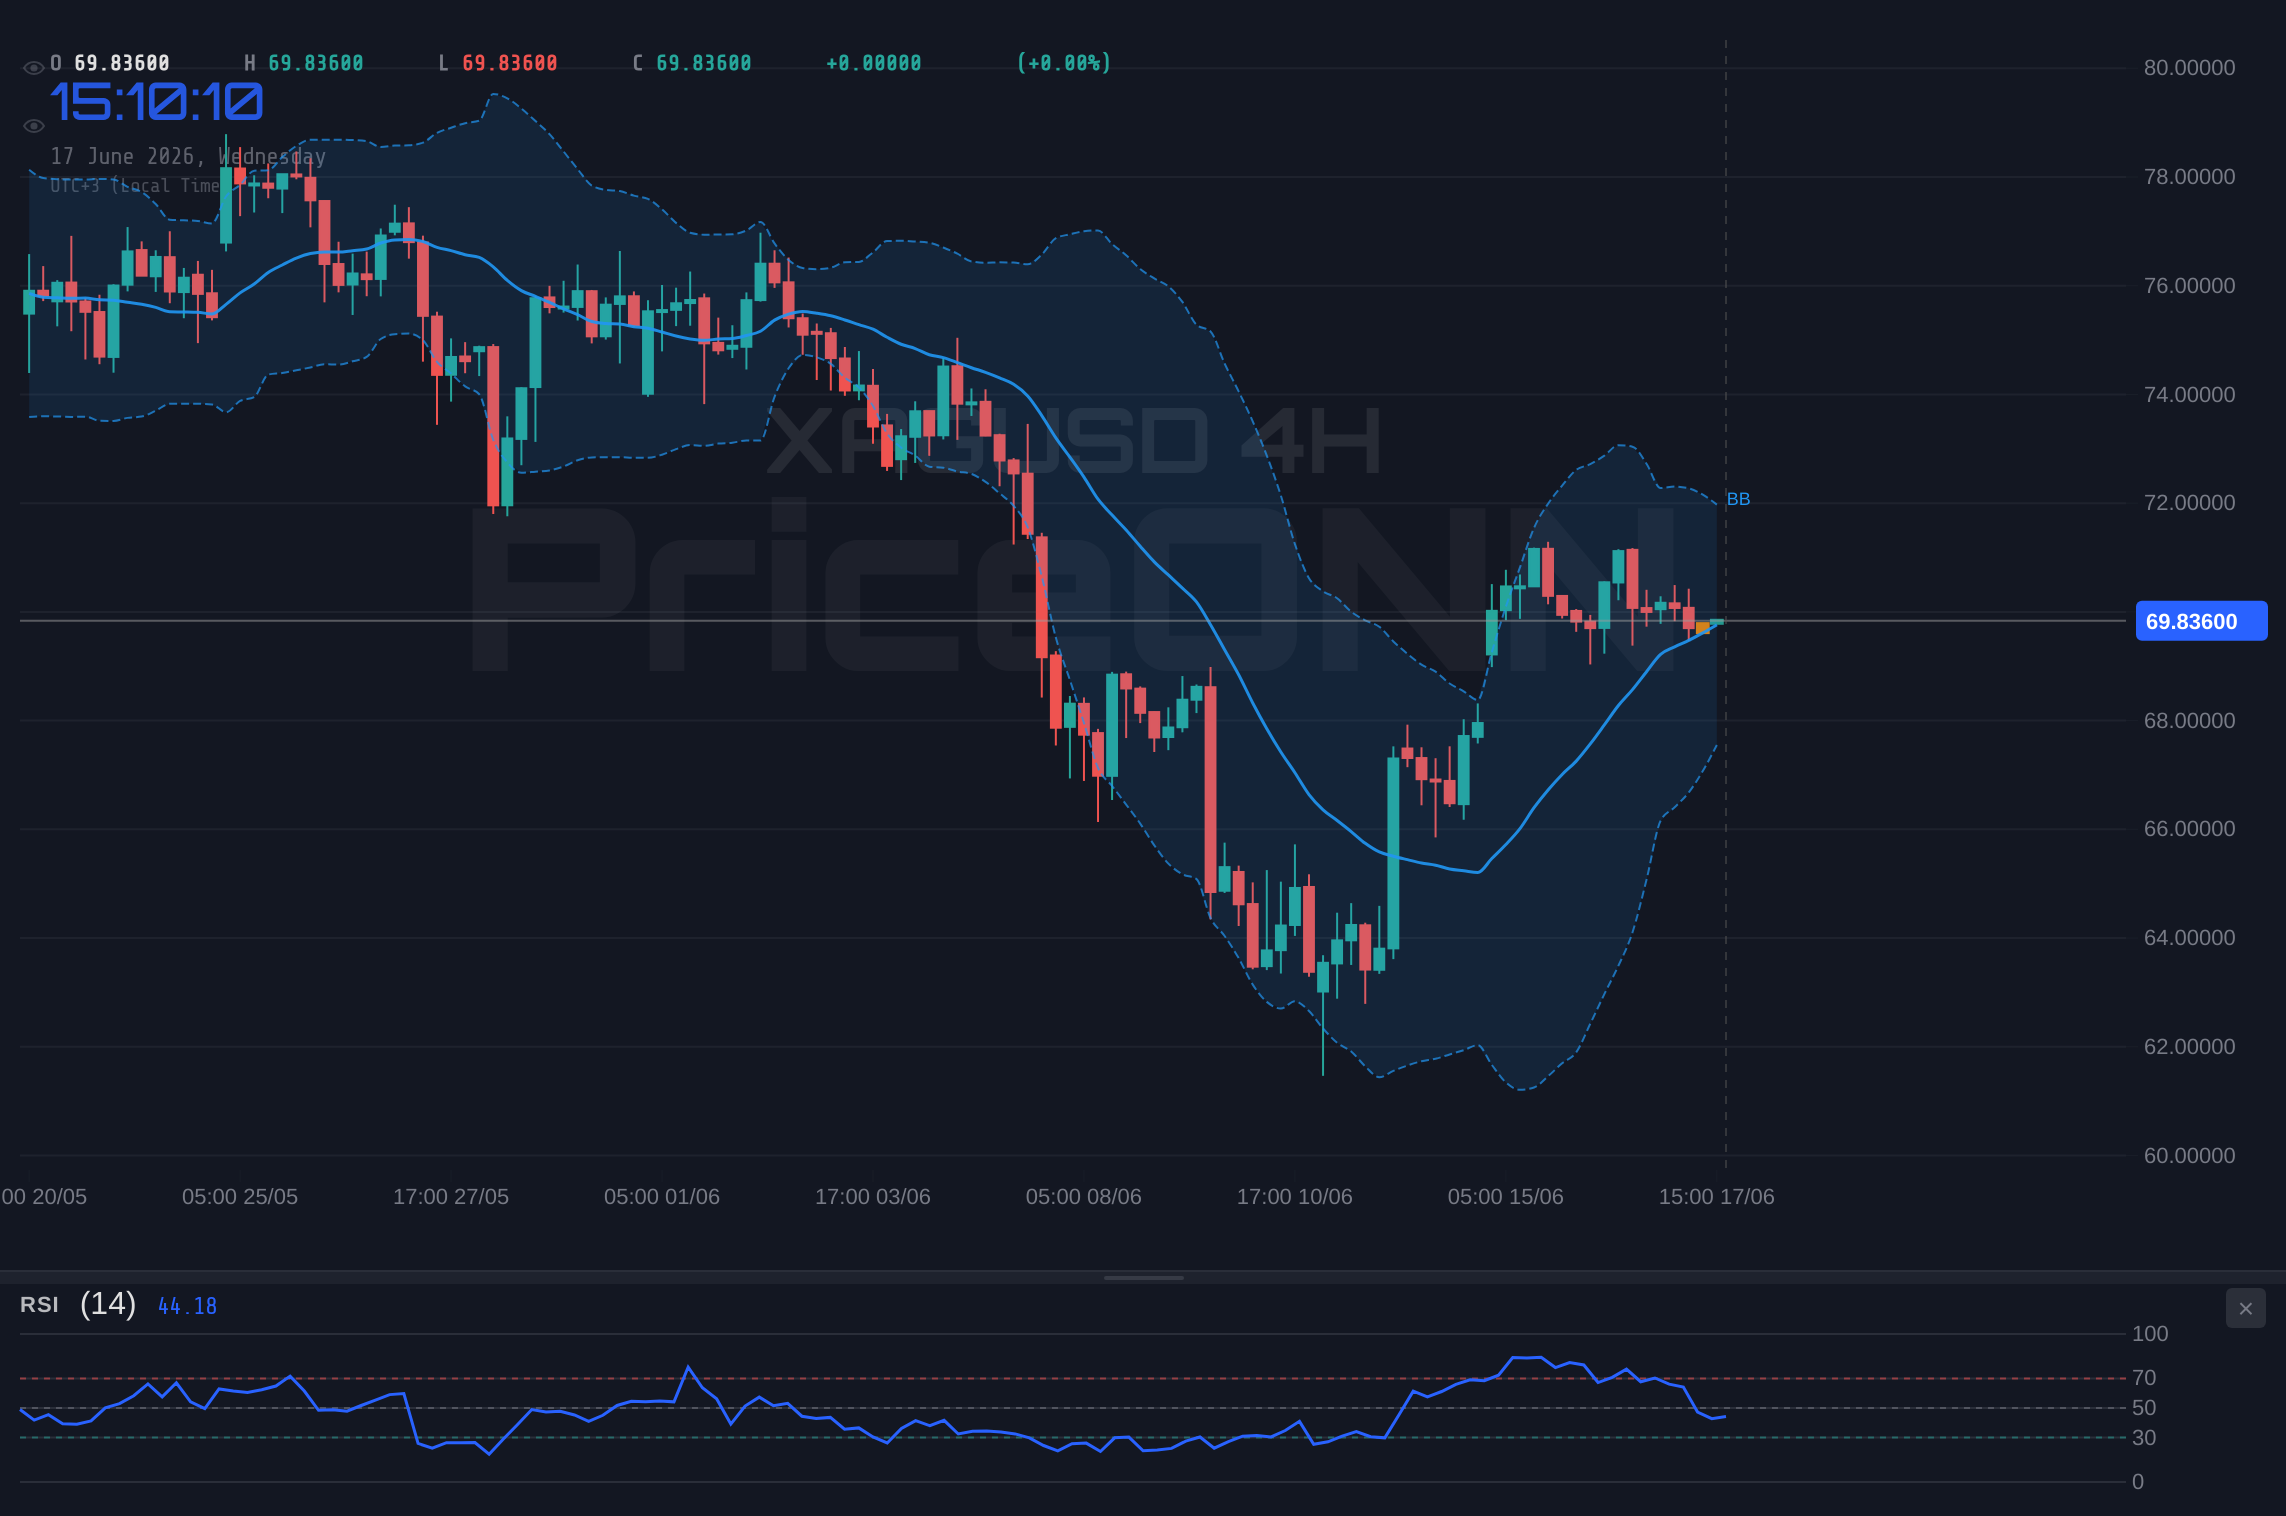
Despite the prevailing bearish sentiment on the 1-hour and daily charts, the 4-hour timeframe offers a glimmer of hope for silver bulls. Here, the trend is neutral with 50% strength, but the overall signal is AL (Buy). The RSI(14) at 56.51 is comfortably in the neutral zone, showing a slight upward eğilim, and importantly, the MACD is displaying positive momentum with the MACD line above its signal line. The Stochastic oscillator, however, presents a conflicting signal with K at 42.31 and D at 57.82 (%K
Consolidation Above Key Support
If silver fails to muster a strong rally, the next logical scenario is a period of consolidation. This would likely occur if price action fails to decisively break above immediate resistance levels like $70.06 and $70.43, but also fails to break down decisively below the critical support at $68.96. In such a scenario, we might see XAGUSD trade within a defined range. The 1-hour ADX reading of 12.42 supports this idea of a weak trend, suggesting that neither bulls nor bears have sufficient momentum to drive a significant move. Price might oscillate between the support at $69.57 and resistance at $70.30. This range-bound trading could persist until a significant catalyst emerges, such as a major economic data release or a geopolitical event, that forces a breakout in either direction. During such consolidation, traders might look for short-term opportunities within the range, focusing on the edges – buying near support and selling near resistance, provided risk management is strictly adhered to.
The Impact of Equities and Oil
The performance of major stock indices like the SP500 and Nasdaq, along with oil prices (Brent/WTI), can significantly influence silver's trajectory. The SP500 is currently showing a strong upward trend (100% strength on 1H) at 6572.87, indicating a generally positive risk appetite. However, the daily trend for SP500 is bearish (100% strength) at 6572.87, and its RSI at 45.35 suggests downward pressure. This mixed picture in equities can create uncertainty, potentially leading investors to seek safe-haven assets like gold and silver, or to reduce overall risk exposure. On the other hand, oil prices (Brent at $79.84, WTI at $76.58) are experiencing a bearish trend, particularly on the 4-hour and daily charts. Falling oil prices can sometimes ease inflation concerns, potentially reducing the appeal of silver as an inflation hedge. Conversely, if falling oil prices are seen as a sign of weakening global demand, it could also signal broader economic weakness, which would be bearish for silver. The correlation is not always straightforward; a sharp drop in oil could, in some scenarios, lead to a flight to safety which might benefit silver, but currently, the dominant narrative links falling oil to easing inflation fears.
Navigating the Uncertainty: Scenarios and Triggers
Scenario 1: Bullish Breakout
Trigger: A decisive close above the immediate 1-hour resistance at $70.06, followed by a strong push above the 4-hour resistance at $70.43. Confirmation would come from sustained buying volume and a positive shift in short-term indicators, particularly RSI moving above 50 and MACD showing strengthening positive momentum. The daily chart's conflicting signals could then resolve upwards if this momentum carries through.
Invalidation: A failure to break $70.06 convincingly, or a sharp reversal back below $69.57, would invalidate this bullish setup.
Target 1: $71.10 (Daily resistance level, first psychological target).
Target 2: $72.21 (Stronger daily resistance level, representing a significant recovery).
Probability: 30%
Scenario 2: Bearish Continuation
Trigger: A clear break and sustained hold below the critical 1-hour support at $69.57, followed by a decisive move through the 4-hour support at $69.77 and then the key daily support at $68.96. Confirmation would require RSI on the 1-hour and daily charts to trend lower towards oversold territory, and MACD to maintain negative momentum. A DXY strength continuation would also support this scenario.
Invalidation: Price holding firmly above $69.57 and showing signs of recovery, especially a bounce from the $68.96 level, would invalidate this bearish outlook.
Target 1: $68.96 (Key daily support level, the primary focus for bears).
Target 2: $67.93 (Further daily support, representing a deeper decline).
Probability: 55%
Scenario 3: Range-Bound Consolidation
Trigger: Price failing to break decisively above $70.06 resistance AND failing to break decisively below $68.96 support. This would likely be characterized by choppy price action, low volatility, and conflicting signals across timeframes, as seen with the weak ADX readings on the 1-hour chart (12.42).
Invalidation: A clear breakout above $70.43 resistance or a decisive breakdown below $68.96 support.
Target 1: The upper bound of the range, potentially around $70.43.
Target 2: The lower bound of the range, around $68.96.
Probability: 15%
Bearish Scenario: Downside Momentum
55% ProbabilityBullish Scenario: Rebound Potential
30% ProbabilityNeutral Scenario: Range-Bound Trading
15% ProbabilityWhat I'm Watching This Week
The immediate focus for XAGUSD traders remains squarely on the $68.96 support level. A decisive break below this would likely trigger further selling, potentially accelerating towards $67.93. Conversely, a strong bounce from $68.96, coupled with a break above the $70.06 resistance on the 1-hour chart, could signal a short-term recovery. Key economic releases, particularly any that influence the DXY or inflation expectations, will be crucial. For instance, upcoming speeches from Fed officials or any significant shifts in oil prices could provide the catalyst needed to break the current stalemate. The divergence in signals between the 1-hour and 4-hour charts, along with the conflicting readings on the daily timeframe, suggests a period of heightened sensitivity. Traders should exercise caution and wait for clear confirmation before committing to a significant position. The ADX readings across timeframes, particularly the weak trend on the 1-hour (12.42) and moderate strength on the 4-hour (22.69), indicate that the market is not yet strongly trending, increasing the risk of false moves.
Frequently Asked Questions: XAGUSD Analysis
What happens if XAGUSD breaks below the critical $68.96 support level?
A break below $68.96 on the daily chart would invalidate any near-term bullish hopes and likely trigger further downside momentum. The next significant support level to watch would be $67.93, with a potential acceleration towards $66.82 if selling pressure intensifies.
Should I buy XAGUSD at current levels near $69.85, given the mixed signals?
Buying at current levels carries significant risk due to the bearish lean on shorter timeframes and the proximity to key support. A more prudent approach would be to wait for a confirmed bounce from $68.96 or a decisive break above $70.06 resistance, indicating stronger bullish conviction.
Is the RSI at 46.32 a sell signal for XAGUSD on the 1-hour chart?
An RSI of 46.32 on the 1-hour chart leans bearish, indicating that momentum is not strongly to the upside and sellers have some control. However, it's not yet in oversold territory, suggesting that while selling pressure exists, there's room for further decline or consolidation before a potential reversal.
How will the strengthening DXY at 99.72 affect XAGUSD's price this week?
A DXY at 99.72, showing a positive daily change, generally exerts downward pressure on silver (XAGUSD). If the dollar continues to strengthen, it could hinder any attempts by silver to rally and potentially contribute to a move towards the $68.96 support level.
| Indicator | Value | Signal | Interpretation |
|---|---|---|---|
| RSI (1H) | 45.68 | Bearish | Neutral zone, leaning down |
| MACD (1H) | Negative | Bearish | Below signal line |
| Stochastic (1H) | K:39.52, D:32.89 | Bullish Divergence | %K > %D |
| ADX (1H) | 12.42 | Weak Trend | Choppy action likely |
| RSI (1D) | 43.59 | Bearish | Neutral zone, leaning down |
| MACD (1D) | Positive | Bullish | Above signal line |
| Stochastic (1D) | K:62.04, D:34.32 | Bullish | %K > %D |
Track markets in real-time
AI-powered analysis, technical indicators and real-time price data.
Join Our Telegram Channel
Breaking market news, AI analysis and trading signals instantly.
Join Channel