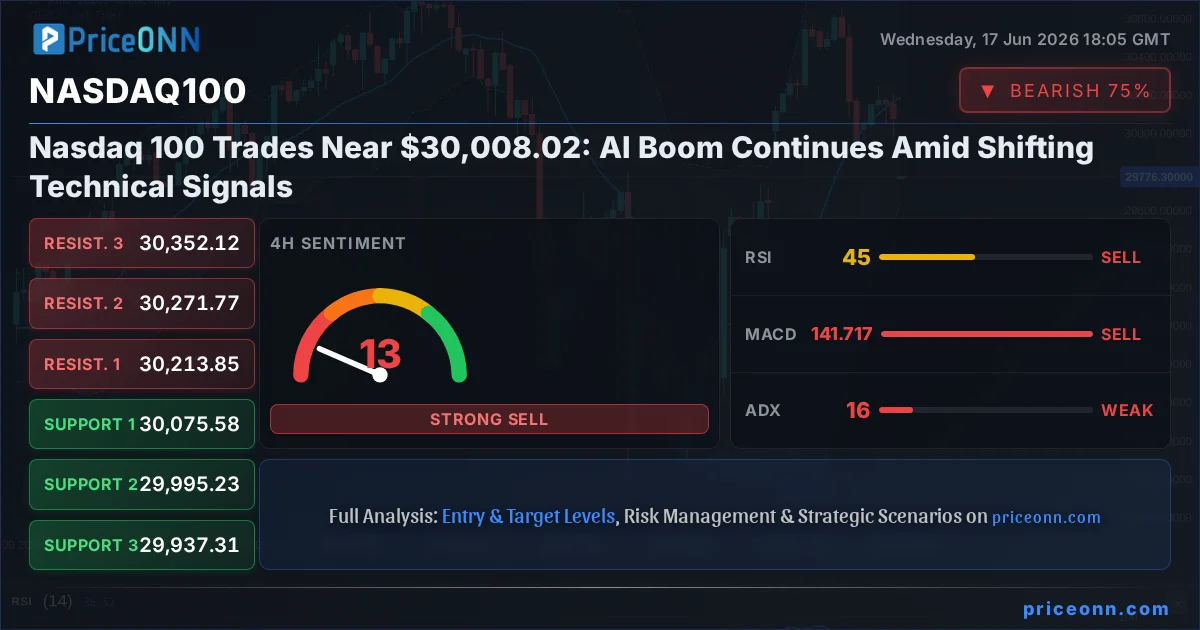
The relentless march of artificial intelligence continues to dominate market narratives, fueling extraordinary gains in tech-centric indices like the Nasdaq 100. As the index currently trades around the $30,008.02 mark, the question on every trader's mind is whether this AI-driven ascent is sustainable or if a technical correction is due. While the fundamental tailwinds of AI innovation remain strong, a closer look at the charts reveals a complex interplay of forces, with conflicting signals demanding careful consideration.
- The Nasdaq 100 is trading near $30,008.02, with the AI boom providing strong fundamental support.
- Technical indicators present a mixed picture: RSI at 40.14 (1H) suggests bearish momentum, while the 1D chart shows a bullish trend with RSI at 56.29.
- Key resistance for the Nasdaq 100 is identified at $30,200.48 on the 1H chart and $31,146.08 on the 1D chart.
- Support levels are critical, with the 1H chart showing immediate support at $30,052.08 and the 1D chart indicating a more significant level at $29,714.42.
- Correlation analysis with the DXY (currently at 99.94) suggests potential headwinds if the dollar continues its upward trajectory, impacting risk assets.
The AI revolution, once a futuristic concept, is now a tangible economic force, reshaping industries and driving unprecedented growth in semiconductor stocks, cloud computing, and related technologies. Companies at the forefront of AI development have seen their valuations soar, pulling the Nasdaq 100 to new heights. This narrative is powerful, and for many, it suggests a continuation of the upward trend. However, as Rıdvan Kara, I must emphasize that markets are not solely driven by narratives; they are rigorously tested by price action and technical indicators. The current price of $30,008.02 for the Nasdaq 100 represents a critical juncture where the bullish AI story confronts the reality of technical resistance and the ever-present possibility of profit-taking.
On the 1-hour chart, the Nasdaq 100 is showing signs of bearish momentum. The RSI(14) is sitting at 40.14, a reading that typically indicates a lack of buying pressure and a potential for further downside. This is further corroborated by the MACD, which is displaying negative momentum with the MACD line below its signal line. The Bollinger Bands are also below the middle band, suggesting the price action is currently subdued and potentially trending downwards in this short-term timeframe. The ADX at 30.45 confirms a strong downtrend on this 1-hour chart, indicating that sellers have a firm grip in the immediate term. This short-term bearish signal is a crucial data point, suggesting that any immediate upward moves might face selling pressure.
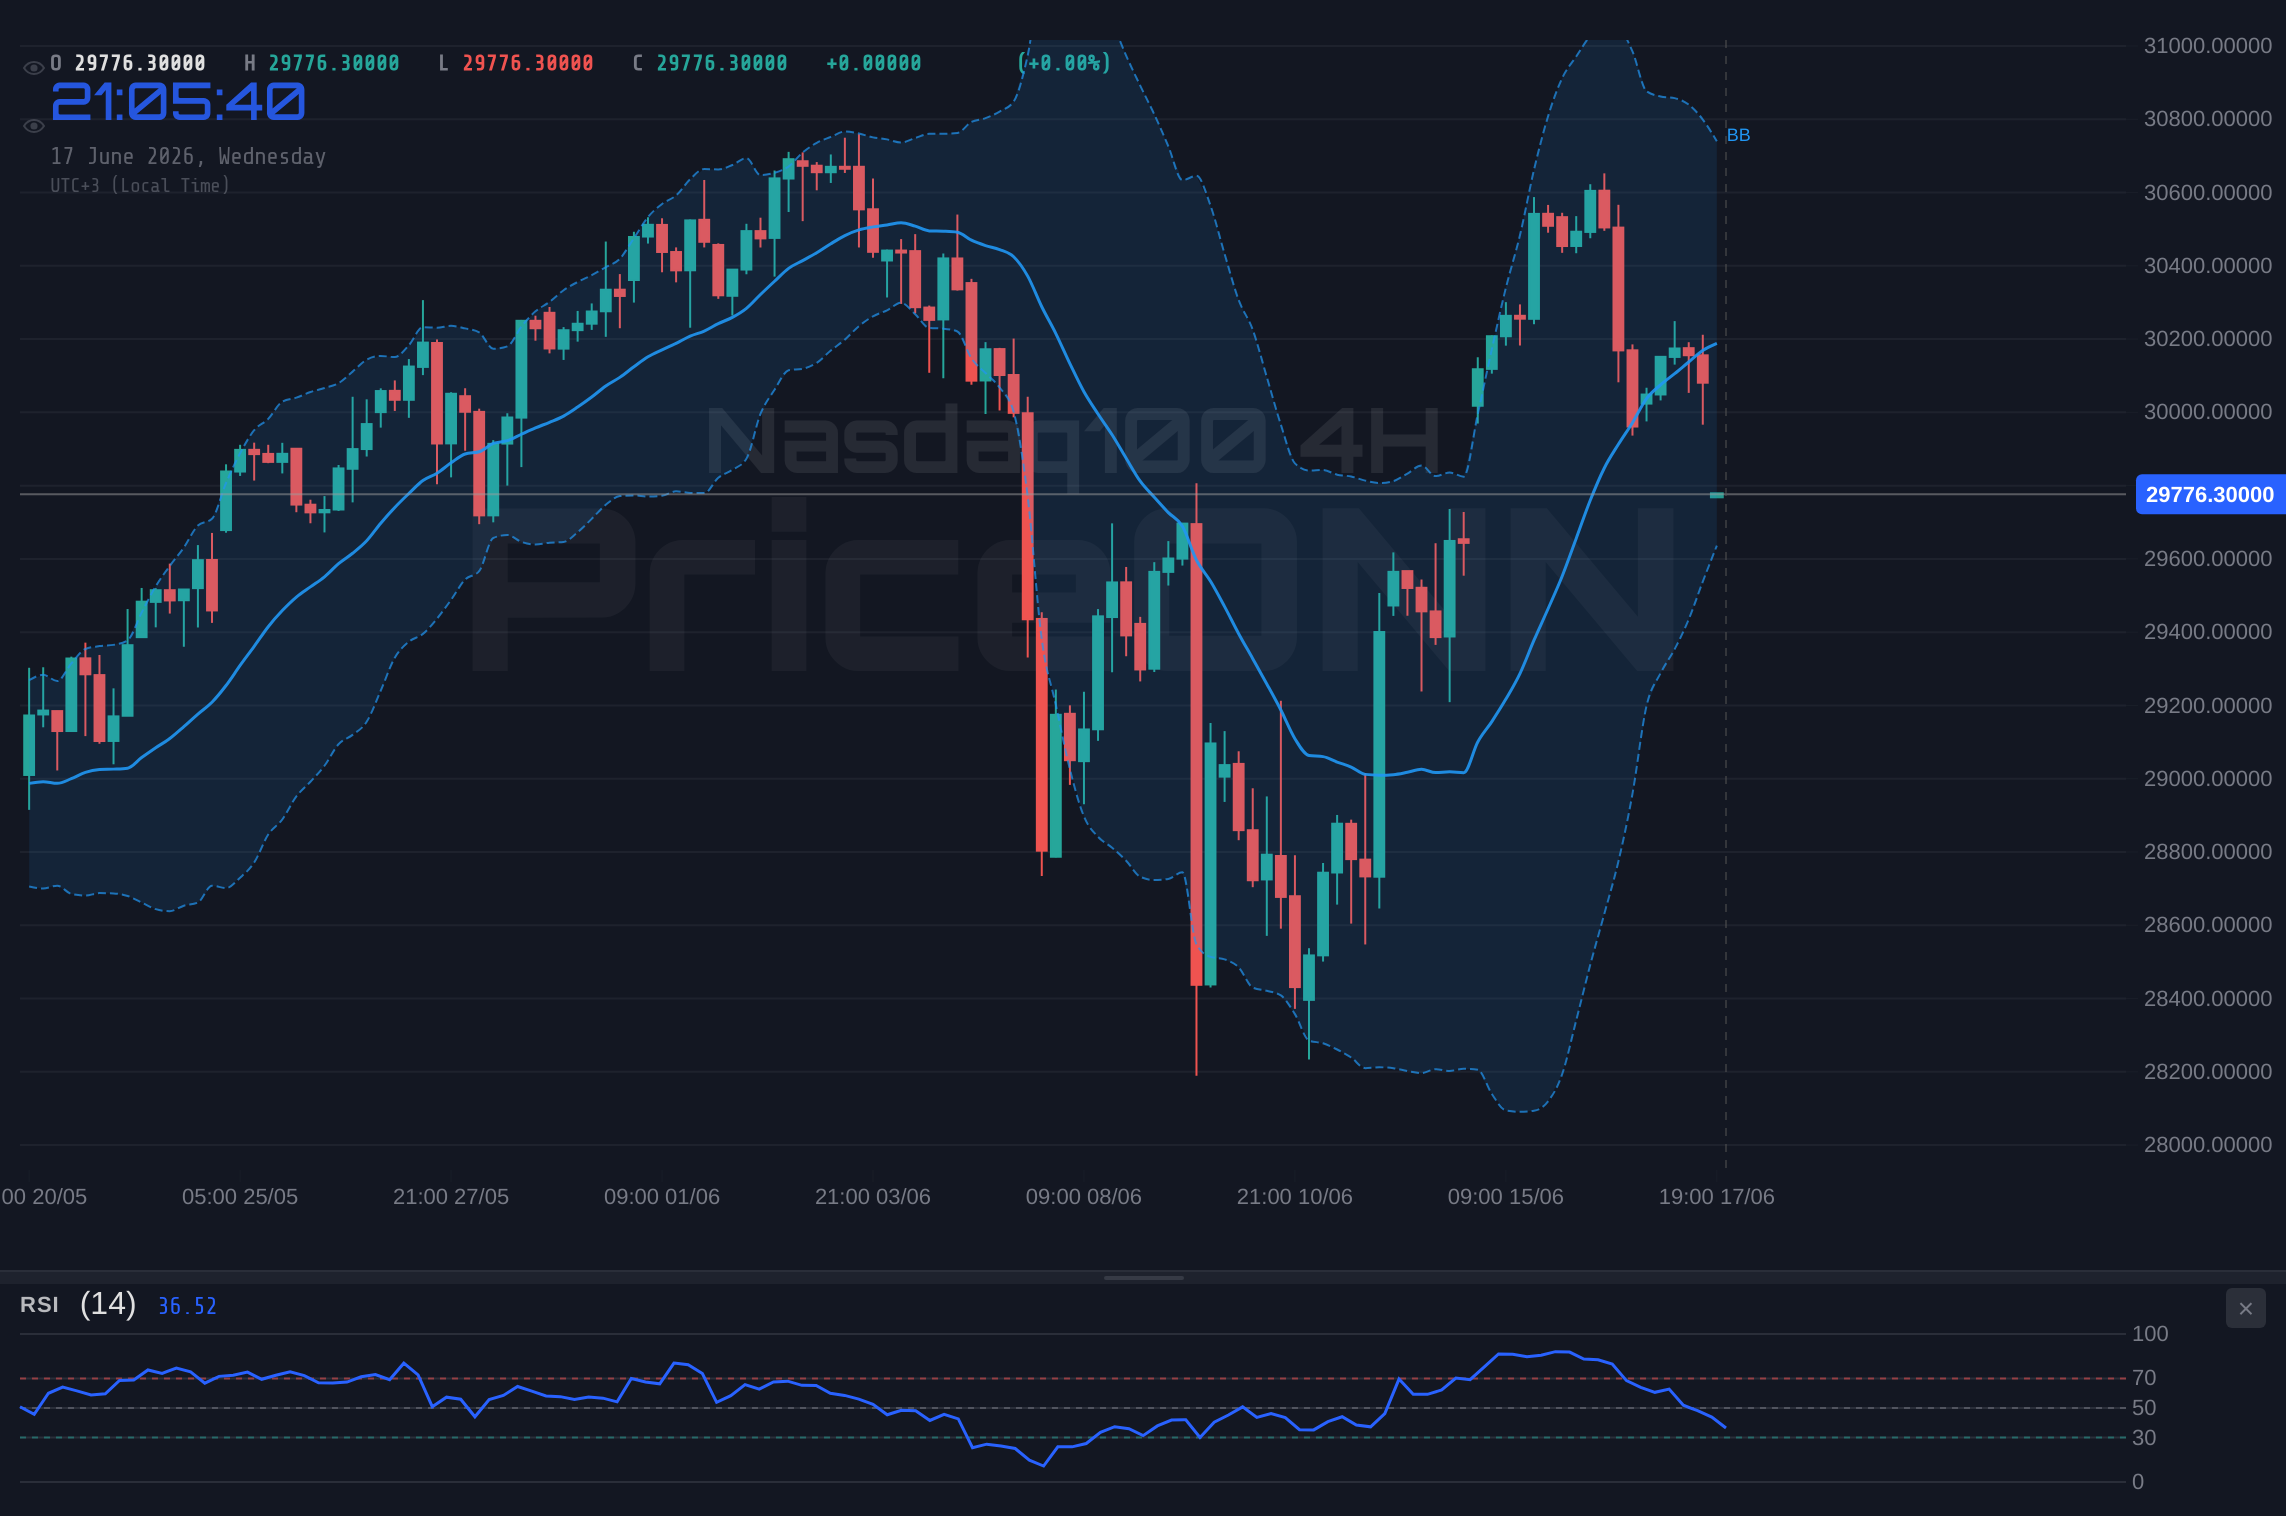
However, broadening our perspective to the 4-hour timeframe, the picture becomes more nuanced. Here, the Nasdaq 100 shows a trend strength of 83% in an upward direction. While the MACD still indicates negative momentum, the RSI at 51.09 is hovering around the neutral zone, suggesting a balance between buyers and sellers. The Stochastic indicator, with %K at 24.62 and %D at 23.44, is showing a bullish signal as %K is above %D, and it's emerging from oversold territory. The ADX at 15.43 signifies a weak trend, which can often precede a significant move as volatility builds. This suggests that while the immediate 1-hour chart might be showing weakness, the medium-term outlook on the 4-hour chart is still leaning towards a potential recovery, albeit in a choppy market environment.
The daily chart paints a different, yet equally important, picture. Here, the Nasdaq 100 exhibits a strong bullish trend with a power of 89%. The RSI(14) is at 56.29, comfortably in the neutral zone and showing a rising tendency, which is a positive sign for the bulls. The MACD is currently displaying negative momentum, but it's running above its signal line, indicating that while recent momentum might have slowed, the underlying trend is still supported. The Bollinger Bands are above the middle band, aligning with the overall bullish trend. The Stochastic indicator, with %K at 78.69 and %D at 51.72, is showing a strong bullish signal, indicating upward momentum is building and nearing overbought conditions. The ADX at 27.53 confirms a strong upward trend on the daily timeframe. This longer-term perspective is vital; it suggests that the short-term weakness seen on the 1-hour chart might be a temporary pause rather than a reversal.
The correlation with the US Dollar Index (DXY) cannot be overlooked. With the DXY currently trading at 99.94 and showing a strong upward trend on the 1-hour and daily charts, it presents a potential headwind for risk assets like the Nasdaq 100. Typically, a strengthening dollar puts pressure on equities, as it makes US assets more expensive for foreign investors and can signal tighter monetary policy or increased global uncertainty. The DXY's upward move on the 1-hour chart, with an RSI at 71.96 nearing overbought territory, suggests that dollar strength might continue in the short term. This dynamic creates a challenging environment where the AI narrative must be strong enough to overcome the dollar's gravitational pull.
Looking at specific price levels, the Nasdaq 100 faces immediate resistance on the 1-hour chart at $30,126.28, followed by $30,171.62 and $30,200.48. A sustained break above these levels, particularly $30,200.48, would be a significant bullish signal, potentially reigniting upward momentum. Conversely, immediate support on the 1-hour chart lies at $30,052.08, $30,023.22, and $29,977.88. A close below $30,052.08 would suggest a short-term bearish continuation, aligning with the 1-hour technical readings. These levels are crucial for traders trying to navigate the intraday volatility.
On the daily chart, the resistance levels are considerably higher, with the first significant barrier at $30,430.25, followed by $30,899.22, and a more distant target at $31,146.08. These higher resistance levels indicate the potential for a larger upward move if the bullish trend reasserts itself. However, the support levels on the daily chart are also substantial. The first key support is identified at $29,714.42. A break below this level would signal a more significant shift in the trend and could lead to further downside, potentially testing the subsequent support at $29,467.56 and even $28,998.59. These daily levels define the broader trading range and the long-term trend's integrity.
The interplay between these timeframes and the broader market context is where the real analysis lies. The strong bullish sentiment on the daily chart, driven by the AI narrative and robust tech sector performance, is currently being challenged by short-term bearish signals on the 1-hour chart and the strengthening dollar. This creates a 'choppy' market environment, as indicated by the weak ADX readings on the 4-hour and 1-hour charts, suggesting a lack of clear direction and potential for whipsaws. Traders must be particularly cautious, managing risk effectively and looking for clear confirmation before committing to positions.
The recent news flow, while often positive on the AI front, also highlights some underlying tensions. Reports of tech giants fighting over power and resources in the AI space underscore the competitive landscape, which can lead to increased volatility. While falling oil prices might offer a tailwind for the broader market by reducing inflationary pressures, as noted by JP Morgan, its direct impact on the Nasdaq 100 is less pronounced compared to its influence on energy-dependent economies or inflation-sensitive assets. The Fed's stance, often a driver for equity markets, remains a key focus, with market participants closely watching for any shifts in monetary policy expectations that could impact growth stocks.
Considering the technical indicators, the RSI readings are a prime example of the conflicting signals. While the 1-hour RSI at 40.14 is bearish, the daily RSI at 56.29 is neutral-to-bullish. This divergence means that short-term traders might see opportunities to sell rallies, while longer-term investors might view dips as buying opportunities, trusting the daily trend. Similarly, the MACD shows negative momentum on the 1-hour and 4-hour charts, yet the daily MACD is positive. This suggests that while the immediate price action might be under pressure, the underlying trend is still holding ground. The Stochastic indicator's behavior, showing bullish signals across multiple timeframes as it moves out of oversold or neutral zones, adds another layer of complexity, hinting at potential upward bounces.
The ADX indicator, particularly its readings around 15.43 (4H) and 30.45 (1H), highlights the current market's indecision. A low ADX suggests a lack of a strong trend, making it difficult to rely on breakout strategies. Conversely, a very high ADX on the 1-hour chart indicates a strong trend, but its conflict with the daily trend signals the potential for a trend reversal or consolidation. This environment is often described as 'choppy' or 'ranging', where price can move erratically, testing both support and resistance levels multiple times before a decisive move occurs. For traders, this means employing strategies that account for increased volatility and the possibility of false breakouts.
The AI boom is undeniably the primary fundamental driver supporting the Nasdaq 100. Companies like NVIDIA, at the heart of AI development, continue to report strong earnings and provide optimistic outlooks, which directly translates into higher valuations for the index. However, the sustainability of these valuations hinges on continued innovation, increasing adoption, and robust earnings growth across the sector. Any sign of slowing adoption, increased competition, or regulatory headwinds could quickly dampen this enthusiasm and trigger a significant correction. Therefore, while the AI narrative is compelling, it must be viewed through the lens of market realities and technical validation.
The current price action around $30,008.02 presents a critical test for the Nasdaq 100. The conflict between short-term bearish technicals and a longer-term bullish trend, exacerbated by a strengthening dollar and a choppy market environment, requires a disciplined approach. Traders must pay close attention to the key support and resistance levels identified across different timeframes. A decisive move above the 1-hour resistance at $30,200.48 could signal a continuation of the bullish trend, while a break below the daily support at $29,714.42 would indicate a more significant trend shift. Until then, expect volatility to remain elevated as the market digests these conflicting signals.
What happens if the Nasdaq 100 breaks above the $30,200.48 resistance level?
A confirmed break above $30,200.48 on the 1-hour chart, supported by increasing volume and positive momentum, would likely trigger further upside. This could see the index target the next daily resistance level around $30,430.25, potentially reigniting bullish sentiment driven by the AI narrative.
Should I consider selling the Nasdaq 100 at current levels around $30,008.02 given the 1-hour RSI at 40.14?
While the 1-hour RSI at 40.14 suggests bearish momentum, it's not an extreme oversold reading. Selling at current levels without further confirmation, such as a break below the 1-hour support at $30,052.08, might be premature given the strong daily bullish trend. A more prudent approach would be to wait for clearer signals or retest of support levels.
Is the ADX reading of 30.45 on the 1-hour chart a strong sell signal for the Nasdaq 100?
An ADX of 30.45 indicates a strong trend on the 1-hour timeframe, but it doesn't specify the direction. Combined with the bearish RSI and MACD on the same timeframe, it reinforces the idea of downward pressure in the short term. However, it's crucial to compare this with the daily ADX of 27.53, which confirms a strong uptrend, highlighting the conflicting signals across timeframes.
How will the strengthening DXY at 99.94 affect the Nasdaq 100's outlook this week?
The DXY's current level of 99.94 and its upward trend, especially with RSI nearing overbought, suggests potential headwinds for risk assets like the Nasdaq 100. A persistently strong dollar can dampen international investor appetite for US equities, potentially capping upside or even triggering pullbacks, especially if the AI narrative falters.
Track markets in real-time
AI-powered analysis, technical indicators and real-time price data.
Join Our Telegram Channel
Breaking market news, AI analysis and trading signals instantly.
Join Channel