ETHUSD at $1,659.42; Will Bears Defend $1,664 as Daily RSI Crashes to 26?
ETHUSD is trading at $1,659.42 with daily RSI hitting extreme oversold levels of 26.44, but a powerful ADX of 53.62 keeps the downtrend firmly intact. The $1,664.56 resistance wall is the line that separates a recovery from continued decline.
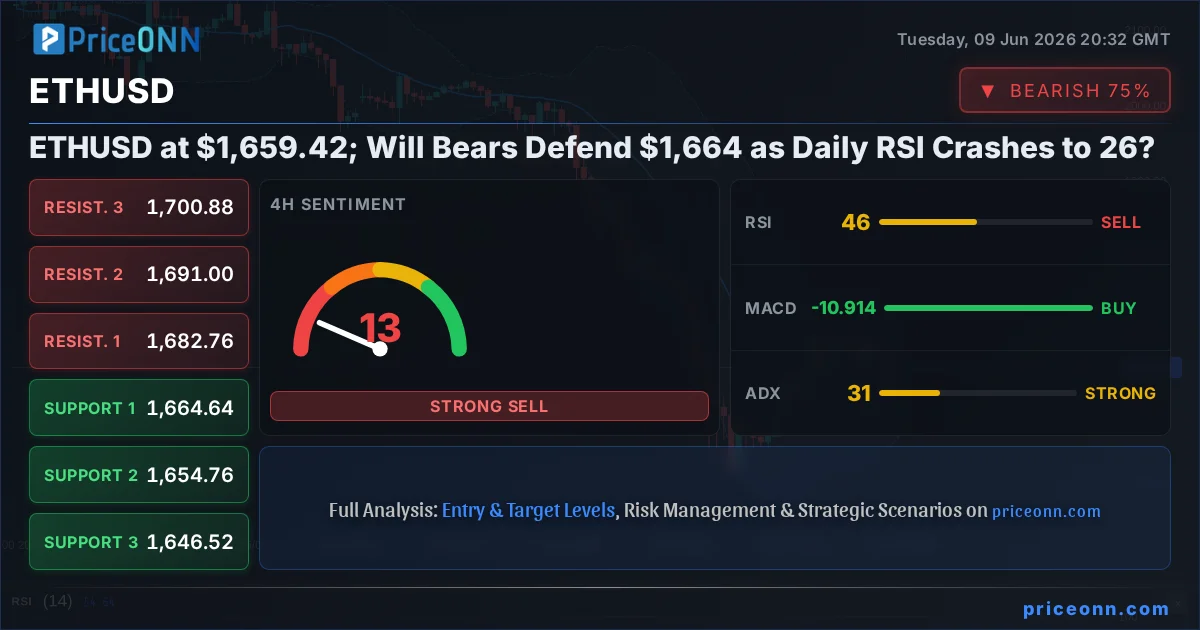
Two forces are colliding in ETHUSD right now, and neither is willing to blink first. Daily RSI has collapsed to 26.44, well into oversold territory, while the ADX sits at a commanding 53.62, confirming one of the strongest downtrends across major crypto pairs. At $1,659.42, Ethereum is navigating a treacherous narrow corridor: critical resistance at $1,664.56 is just five dollars above, while the structural downtrend threatens to reassert itself at any moment. This is the bull vs bear debate traders cannot afford to ignore.
- ETHUSD today analysis: price at $1,659.42, up 2.07% intraday, but facing immediate daily resistance at $1,664.56 - just $5.14 above current levels.
- Daily RSI at 26.44 signals extreme oversold conditions historically associated with mean-reversion bounces, but timing in high-ADX environments is unpredictable.
- ADX at 53.62 on the daily chart is one of the strongest downtrend readings across crypto markets right now - oversold signals carry less weight at these ADX levels.
- ETHUSD key levels to watch: a daily close above $1,664.56 opens the door toward $1,703.43; failure to hold $1,640.71 keeps bears firmly in control.
The Battle at $1,659: Context First
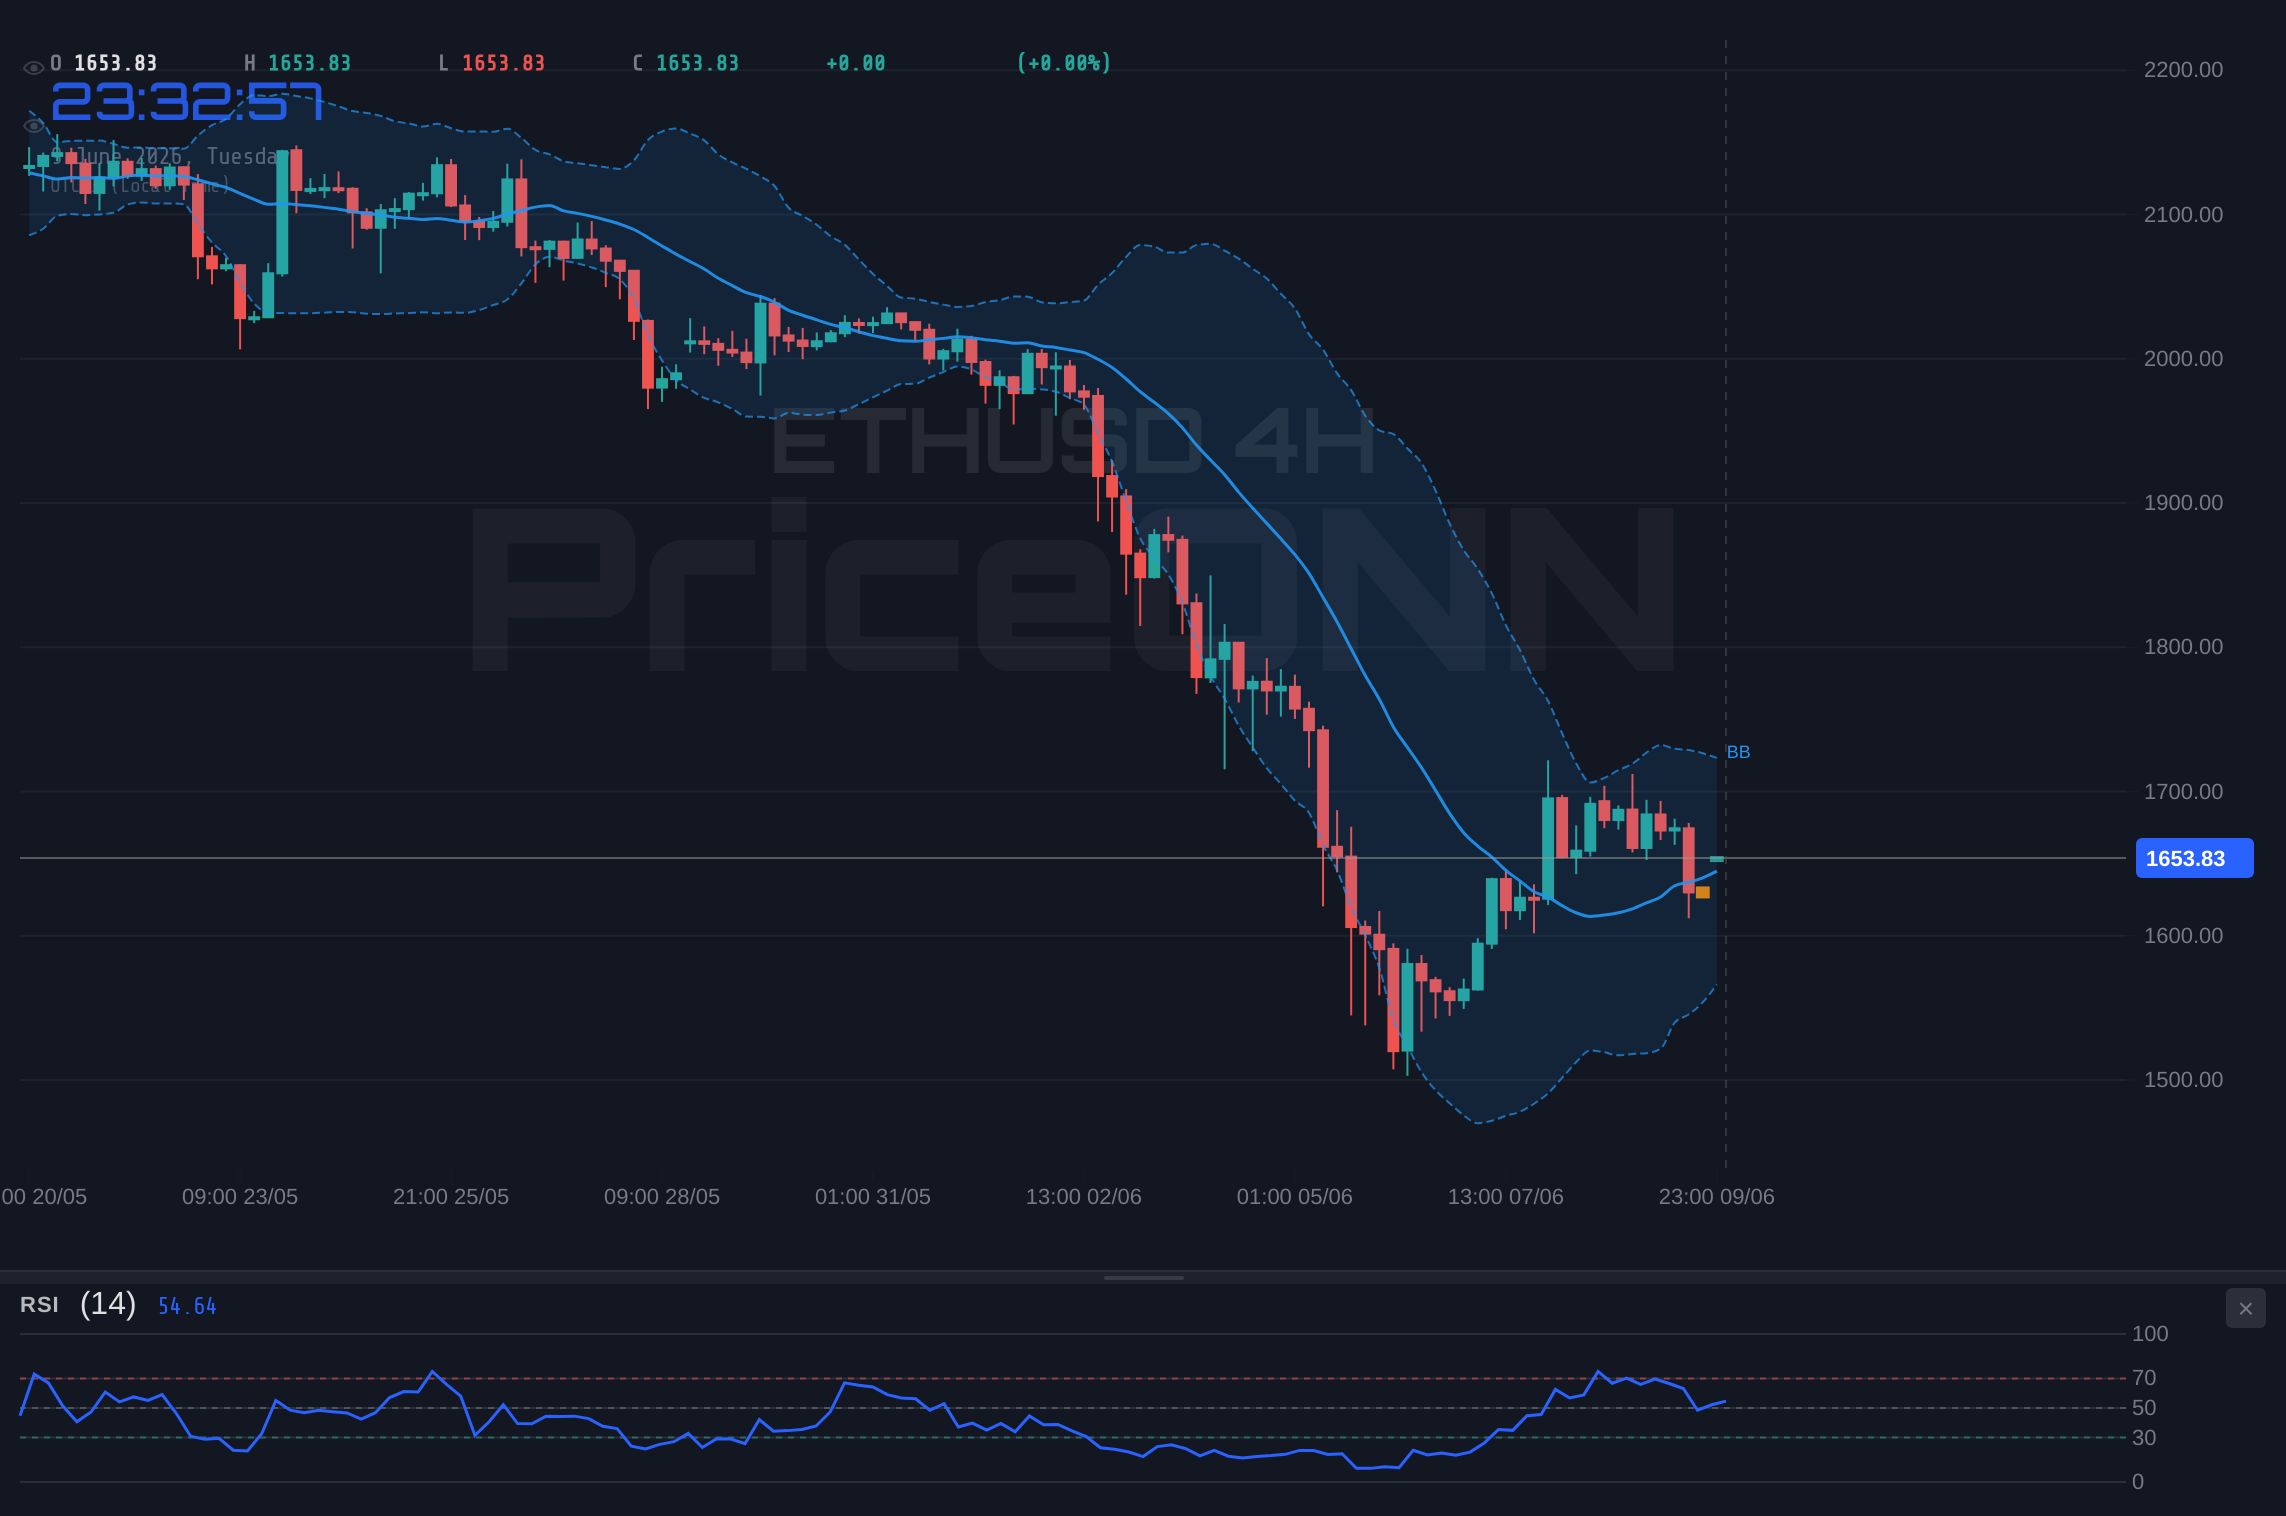
ETHUSD trend analysis at this moment captures a confrontation between technical exhaustion and trend momentum. Today's session has been instructive: price opened near the session low of $1,621.38, climbed strongly through the day to reach as high as $1,721.66, but then pulled back to settle around $1,659.42. That intraday reversal from the highs - shedding roughly $62 from peak to current before stabilizing - says something important. Buyers tried to push higher. Sellers pushed back hard, and they succeeded.
The broader market context adds layers to this picture. Bitcoin is trading at $62,173, up a modest 0.48% on the session, providing a muted tailwind for the crypto complex. The S&P 500 is printing $6,572.87, gaining 0.74% - a sign that risk appetite in broader equities is cautiously constructive. The DXY dollar index sits at 99.69, down 0.10% on the day. On paper, these conditions should be supportive for ETH. The fact that ETHUSD has failed to hold its intraday highs despite a positive macro backdrop tells you something about the structural selling pressure that remains in this market.
The Bull Case: RSI Floor and Short-Term Momentum Shift
The bull argument for ETHUSD starts with one number that is difficult to argue with: 26.44. That is the daily RSI reading, and it places Ethereum in a zone of extreme oversold conditions. When daily RSI falls to this level, it signals that sellers have been dominant for a sustained period - often long enough that the market has already priced in significant future downside. Historically, ETH at daily RSI 26 has attracted accumulation from longer-term participants who recognize the asymmetric risk profile: at extreme oversold readings, the probability-weighted downside is often smaller than the potential upside of a mean-reversion move back toward neutral RSI territory.
The daily stochastic deepens the bull narrative in a meaningful way. With K at 20.71 and D at 13.33, both components are at extreme lows - but the setup for a bullish stochastic divergence is visibly forming. K is beginning to turn upward from below D at these depths, and when stochastic components start crossing upward from below 20, that crossover has historically been one of the more reliable short-term recovery signals for Ethereum. The crossover is not yet confirmed, but the formation is there.
Drop to the 1-hour chart and the short-term picture is already shifting in bulls' favor. The 1H stochastic has fired a clear bullish signal: K at 55.01 is running well above D at 28.34. This divergence helped power today's intraday bounce from $1,621.38, and it suggests that immediate selling pressure has at least temporarily stabilized. The 1H ADX at 21.11 is in the moderate range - not confirming a powerful new downtrend on the hourly, which gives bulls some working room before the next round of structural selling.
The macro backdrop provides one more layer of support for the bull case. Risk appetite measured by the S&P 500 at $6,572.87 gaining 0.74% is cautiously constructive, and historically positive equity sessions have correlated with reduced selling pressure in major crypto assets. Reuters has reported that traders are actively repositioning ahead of the upcoming US CPI release, and some of that hedging activity has likely generated short-covering pressure that has supported ETH's intraday bounce. The DXY at 99.69 softening slightly removes a small but real headwind from risk-sensitive assets.
Daily RSI at 26.44 combined with a forming stochastic divergence and a confirmed 1H bullish stochastic cross creates the conditions for at least a technical relief bounce. A daily close above $1,664.56 would confirm buyers are absorbing overhead supply with enough conviction to change the short-term trend character.
The Bear Case: A Downtrend That Refuses to Quit
Here is where the bear argument becomes genuinely difficult to dismiss. An ADX reading of 53.62 on the daily chart is not merely strong trend territory - it is exceptional. Most technical analysts consider ADX above 25 as trend confirmation, above 40 as a powerful trend, and above 50 as rare, typically seen only in markets driven by structural momentum rather than short-term volatility. At 53.62, ETHUSD is in the kind of sustained downtrend where even sharp intraday bounces, like today's move from $1,621.38, get systematically absorbed by sellers before the close. Today proved exactly that: price reached $1,721.66 intraday and gave back the majority of that gain.
The 4-hour chart reinforces the structural bear case. ADX at 30.87 confirms the intermediate downtrend is well-established across a meaningful timeframe, not just a short-term blip. The 4H MACD remains in negative territory, with histogram below the signal line - this is not a setup that flips quickly. The 4H stochastic is showing a bearish cross with K at 48.18 running below D at 59.95, confirming that intermediate momentum still favors sellers. The 4H Bollinger band structure adds another layer: price is trading below the middle band, reinforcing that the path of least resistance on the 4H chart remains lower.
Then there is the resistance architecture immediately overhead. The daily chart's first resistance sits at $1,664.56 - just $5.14 above the current price of $1,659.42. This proximity is the crux of the bear argument. When a strong downtrend produces a short-term oversold bounce, the first meaningful test of that bounce is almost always the nearest overhead resistance level. Bears do not need to manufacture new selling pressure from scratch - they simply need to defend $1,664.56 and let the trend resume. With ADX at 53.62, history says that defense succeeds more often than it fails.
The daily MACD confirms the structural bearish bias with cold precision. Negative histogram, MACD line trading below its signal line - this is not a setup that resolves in a session or two. MACD transitions on the daily chart typically require multiple sessions to shift, meaning the MACD will remain a bearish drag on any recovery attempt well into the coming week. Bulls trying to push through $1,664.56 are fighting not just price resistance, but a momentum indicator that is firmly aligned against them on the most important timeframe.
The Bollinger band breakdown on the daily adds one more data point to the bear arsenal. Price printed below the lower Bollinger band, which in the context of a 53.62 ADX reading is more indicative of a breakdown extension than a simple oversold snap-back. This is a market where the bands themselves are expanding to accommodate a structurally lower price range - the expansion of the bands during a downtrend is a confirmation of trend persistence, not a reversal warning.
With daily ADX at 53.62, ETHUSD is in a statistically rare group of strongly trending instruments. In these environments, oversold RSI readings can persist for days or weeks. The $1,664.56 resistance ceiling has not been cleared on any daily close, and until it is, every bounce - including today's - is a potential selling opportunity for bears who are working with the trend.
The $1,664 Line: Where the Verdict Gets Written
ETHUSD support and resistance analysis across all three timeframes converges on a single conclusion: the $1,664.56 daily resistance level is the key battleground where this bull vs bear debate will be decided. This is not an arbitrary level - it is the first daily pivot resistance above current price, representing the precise zone where sellers have previously reasserted control after short-term bounces.
A daily close above $1,664.56 would change the character of the current move in a fundamental way. It would shift the narrative from bouncing in a powerful downtrend to potential trend exhaustion at a meaningful resistance inflection. The next target after that break would be the 4H resistance cluster at $1,682.76, and beyond that, the daily R2 at $1,703.43 - representing nearly a 3% move from current levels and beginning to challenge the structural downtrend narrative that has dominated this pair for weeks.
Conversely, a rejection at $1,664.56 - particularly a rejection accompanied by elevated volume - would confirm the bear case with high confidence. Under that scenario, the 1H support cluster at $1,640.71 becomes the immediate target. Below that lies $1,631.32 and $1,624.93 from the 1H chart, and if those give way, the daily S1 at $1,568.04 comes into focus. That would represent a 5.5% drawdown from current levels - painful but consistent with what a 53.62 ADX downtrend can produce.
The upcoming US CPI data is the critical macro wildcard that traders cannot ignore in this context. Reuters has reported that traders are actively taking profits and repositioning ahead of what is widely described as a high-stakes inflation release. For ETHUSD, the binary nature of the CPI outcome maps directly onto the two scenarios above. A hotter-than-expected reading would strengthen the DXY above its current 99.69 level, pressure risk assets, and likely accelerate ETH's decline toward the $1,568.04 support. A cooler reading could be the external catalyst that finally gives bulls the conviction to push through $1,664.56 and sustain a break. Either way, entering a large position in a 53.62 ADX downtrend ahead of a binary macro event is a risk management problem, not a trading opportunity. The WATCH_ZONE designation is exactly right here.
What Different Trader Profiles Should Watch
ETHUSD trading signals carry different implications depending on your time horizon, and mapping that out explicitly helps cut through the noise of conflicting indicators.
Scalpers operating on the 1H chart have the most immediate and workable framework. The 1H stochastic bullish cross - K at 55.01 above D at 28.34 - provides a short-term tailwind, but the 1H ADX at 21.11 means the immediate trend has not committed to a firm direction. Scalpers should treat the $1,662.88 level as a near-term target and be prepared to take profits quickly there. Stops belong below $1,640.71, where the 1H support cluster begins. The risk/reward is acceptable for the scalp precisely because the entry is near a structural extreme, but size should remain modest given the broader trend context.
Swing traders working on the 4H chart face a clearer but more demanding picture: wait. The 4H ADX at 30.87 confirms a well-established downtrend on the intermediate timeframe. The 4H MACD histogram remains negative. The 4H stochastic bearish cross - K at 48.18 below D at 59.95 - confirms momentum still favors sellers on this timeframe. None of these signals support entering a meaningful long position on the 4H chart yet. The swing trader's trigger is a confirmed 4H close above $1,682.76, the 4H resistance level that would be the first real sign that intermediate trend structure is breaking down. Until that close happens, the swing trade is speculative, not systematic.
For position traders watching the daily chart, the setup is paradoxically the most interesting of the three. Daily RSI at 26.44 combined with the stochastic beginning to turn from extreme depths - K at 20.71 moving upward from D at 13.33 - represents the kind of extreme oversold reading that longer-term accumulation zones are historically built around. But the 100% downtrend strength on the daily chart and ADX at 53.62 demand extraordinary patience. A weekly close above the daily R2 at $1,703.43 would be far more compelling as a long-term accumulation trigger than the current daily price action. The oversold conditions are noted; acting on them prematurely in a trend this powerful is how accounts get ground down by incremental losses.
ETHUSD Scenario Analysis
Bearish Scenario: Bears Defend the $1,664 Wall
55% ProbabilityBullish Scenario: Oversold Bounce Clears the Ceiling
30% ProbabilityNeutral Scenario: Consolidation Range Forms Pre-CPI
15% ProbabilityFrequently Asked Questions: ETHUSD Analysis
What happens to ETHUSD if it breaks above the $1,664.56 resistance level?
A confirmed daily close above $1,664.56 would shift the short-term narrative from bouncing in a downtrend to potential trend exhaustion at a key inflection point. The next meaningful target would be the 4H resistance at $1,682.76, followed by the daily R2 at $1,703.43. However, given daily ADX at 53.62, traders should require a confirmed daily close rather than an intraday spike before treating this as a genuine bullish reversal signal - spikes without closes in strong downtrends are often stop hunts rather than real breaks.
Is ETHUSD RSI at 26.44 a reliable buy signal when ADX is at 53.62?
Daily RSI at 26.44 signals extreme oversold conditions, but it is not a standalone buy signal when paired with a daily ADX of 53.62 confirming a very powerful downtrend. In strong trends, RSI can remain suppressed for extended periods and price can continue falling even from oversold levels. The confirmation trigger is a price close above $1,664.56, not the RSI reading alone - until that level clears, risk/reward does not favor aggressive long positioning.
Why does the daily ADX at 53.62 change how ETHUSD support and resistance levels should be treated?
ADX at 53.62 places ETHUSD in a statistically rare group of strongly trending assets where support levels break more easily and resistance levels hold more stubbornly than in lower-ADX markets. The $1,640.71 support should be treated as fragile rather than robust, while the $1,664.56 resistance deserves genuine respect as a barrier until a daily close clears it with volume confirmation. This ADX reading is precisely why the trade decision here is WATCH_ZONE rather than an active setup.
How will the upcoming US CPI release affect ETHUSD this week?
The US CPI data is the highest-impact macro catalyst for crypto markets this week, and it creates a clear binary outcome for ETHUSD. A hotter-than-expected reading would likely strengthen the DXY above its current 99.69 level and pressure risk assets, potentially driving ETH below $1,640.71 and toward the $1,568.04 daily support. A cooler-than-expected CPI could weaken the dollar and provide the external catalyst bulls need to push ETHUSD through $1,664.56, opening a path toward $1,703.43 over subsequent sessions.
The verdict on ETHUSD is one of structured patience. The downtrend has been powerful - ADX at 53.62 and daily trend strength at 100% leave no ambiguity about who has controlled this market. But RSI at 26.44, with stochastics turning upward from extreme depths on both the 1H and daily, is exactly the configuration where patient, risk-aware positioning begins to make sense. Do not force a trade before CPI resolves the macro uncertainty. Watch $1,664.56 as the single most important number on the chart. A daily close above it changes everything; a rejection confirms the bears remain in command. Until then, the tape belongs to the sellers, and the smart trade is the one you do not take.
Track markets in real-time
AI-powered analysis, technical indicators and real-time price data.
Join Our Telegram Channel
Breaking market news, AI analysis and trading signals instantly.
Join Channel