Time Horizon: This analysis covers short-to-medium term BTCUSD price action across 1H, 4H, and Daily timeframes.
When RSI dives to 24.97 on the daily chart, the question every trader is asking stops being "where is Bitcoin going?" and becomes something more urgent: is this an execution-level capitulation, or the final shakeout before a bounce? BTCUSD today analysis finds the market sitting at $61,611 after a brutal 2.96% session decline, and the charts are screaming conflicting signals from every direction. This is not a simple trade.
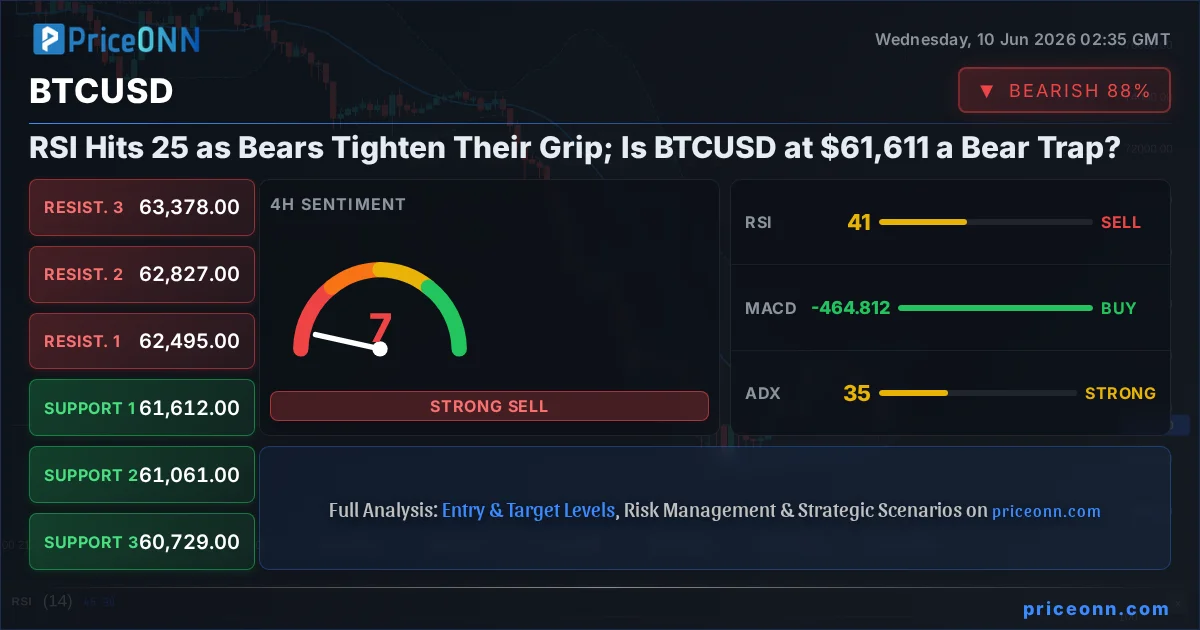
- BTCUSD is trading at $61,611, down 2.96% on the day, with the daily RSI collapsing to 24.97; one of the most extreme oversold readings in recent memory for this asset.
- The daily ADX sits at 44.78, confirming an exceptionally strong downtrend; trend-followers have no technical justification to step in front of this selling pressure without confirmation.
- Critical 4H support at $61,061 is being tested actively; a clean close below that level opens the path to $60,545 and potentially the $59,436 daily support floor.
- The upcoming US CPI release is the dominant macro wildcard; a hot inflation print would reinforce Fed rate hike expectations and could accelerate BTC losses significantly.
The tension building in this market is palpable. Bears have been in full control across multiple sessions, and ADX at 44.78 on the daily timeframe is not a number any serious trader dismisses. That reading confirms the sellers are organized, committed, and not yet exhausted. Yet RSI at 24.97 is whispering something else entirely: the sellers might be running out of fresh ammunition at current levels. This is the core of the BTCUSD bull vs bear debate right now, and it deserves a thorough examination from both sides before any capital commitment is considered.
Why RSI at 24.97 Might Signal the Sellers Are Running Out of Fuel
Let's build the bull case honestly, because it genuinely deserves a fair hearing. Daily RSI at 24.97 puts Bitcoin in territory it rarely occupies for extended periods. When a market reaches this zone, the mechanical reality is clear: recent selling sessions have been extreme relative to any buying activity. Mean-reversion setups emerge from these levels historically, and the statistical edge for a relief bounce is real. The daily Stochastic adds an interesting wrinkle to this picture: K=21.08 has crossed above D=14.72, generating a bullish crossover signal from deep oversold ground. That crossover, even in isolation, is the kind of early recovery signal that experienced swing traders flag in their watchlists as a potential setup developing.
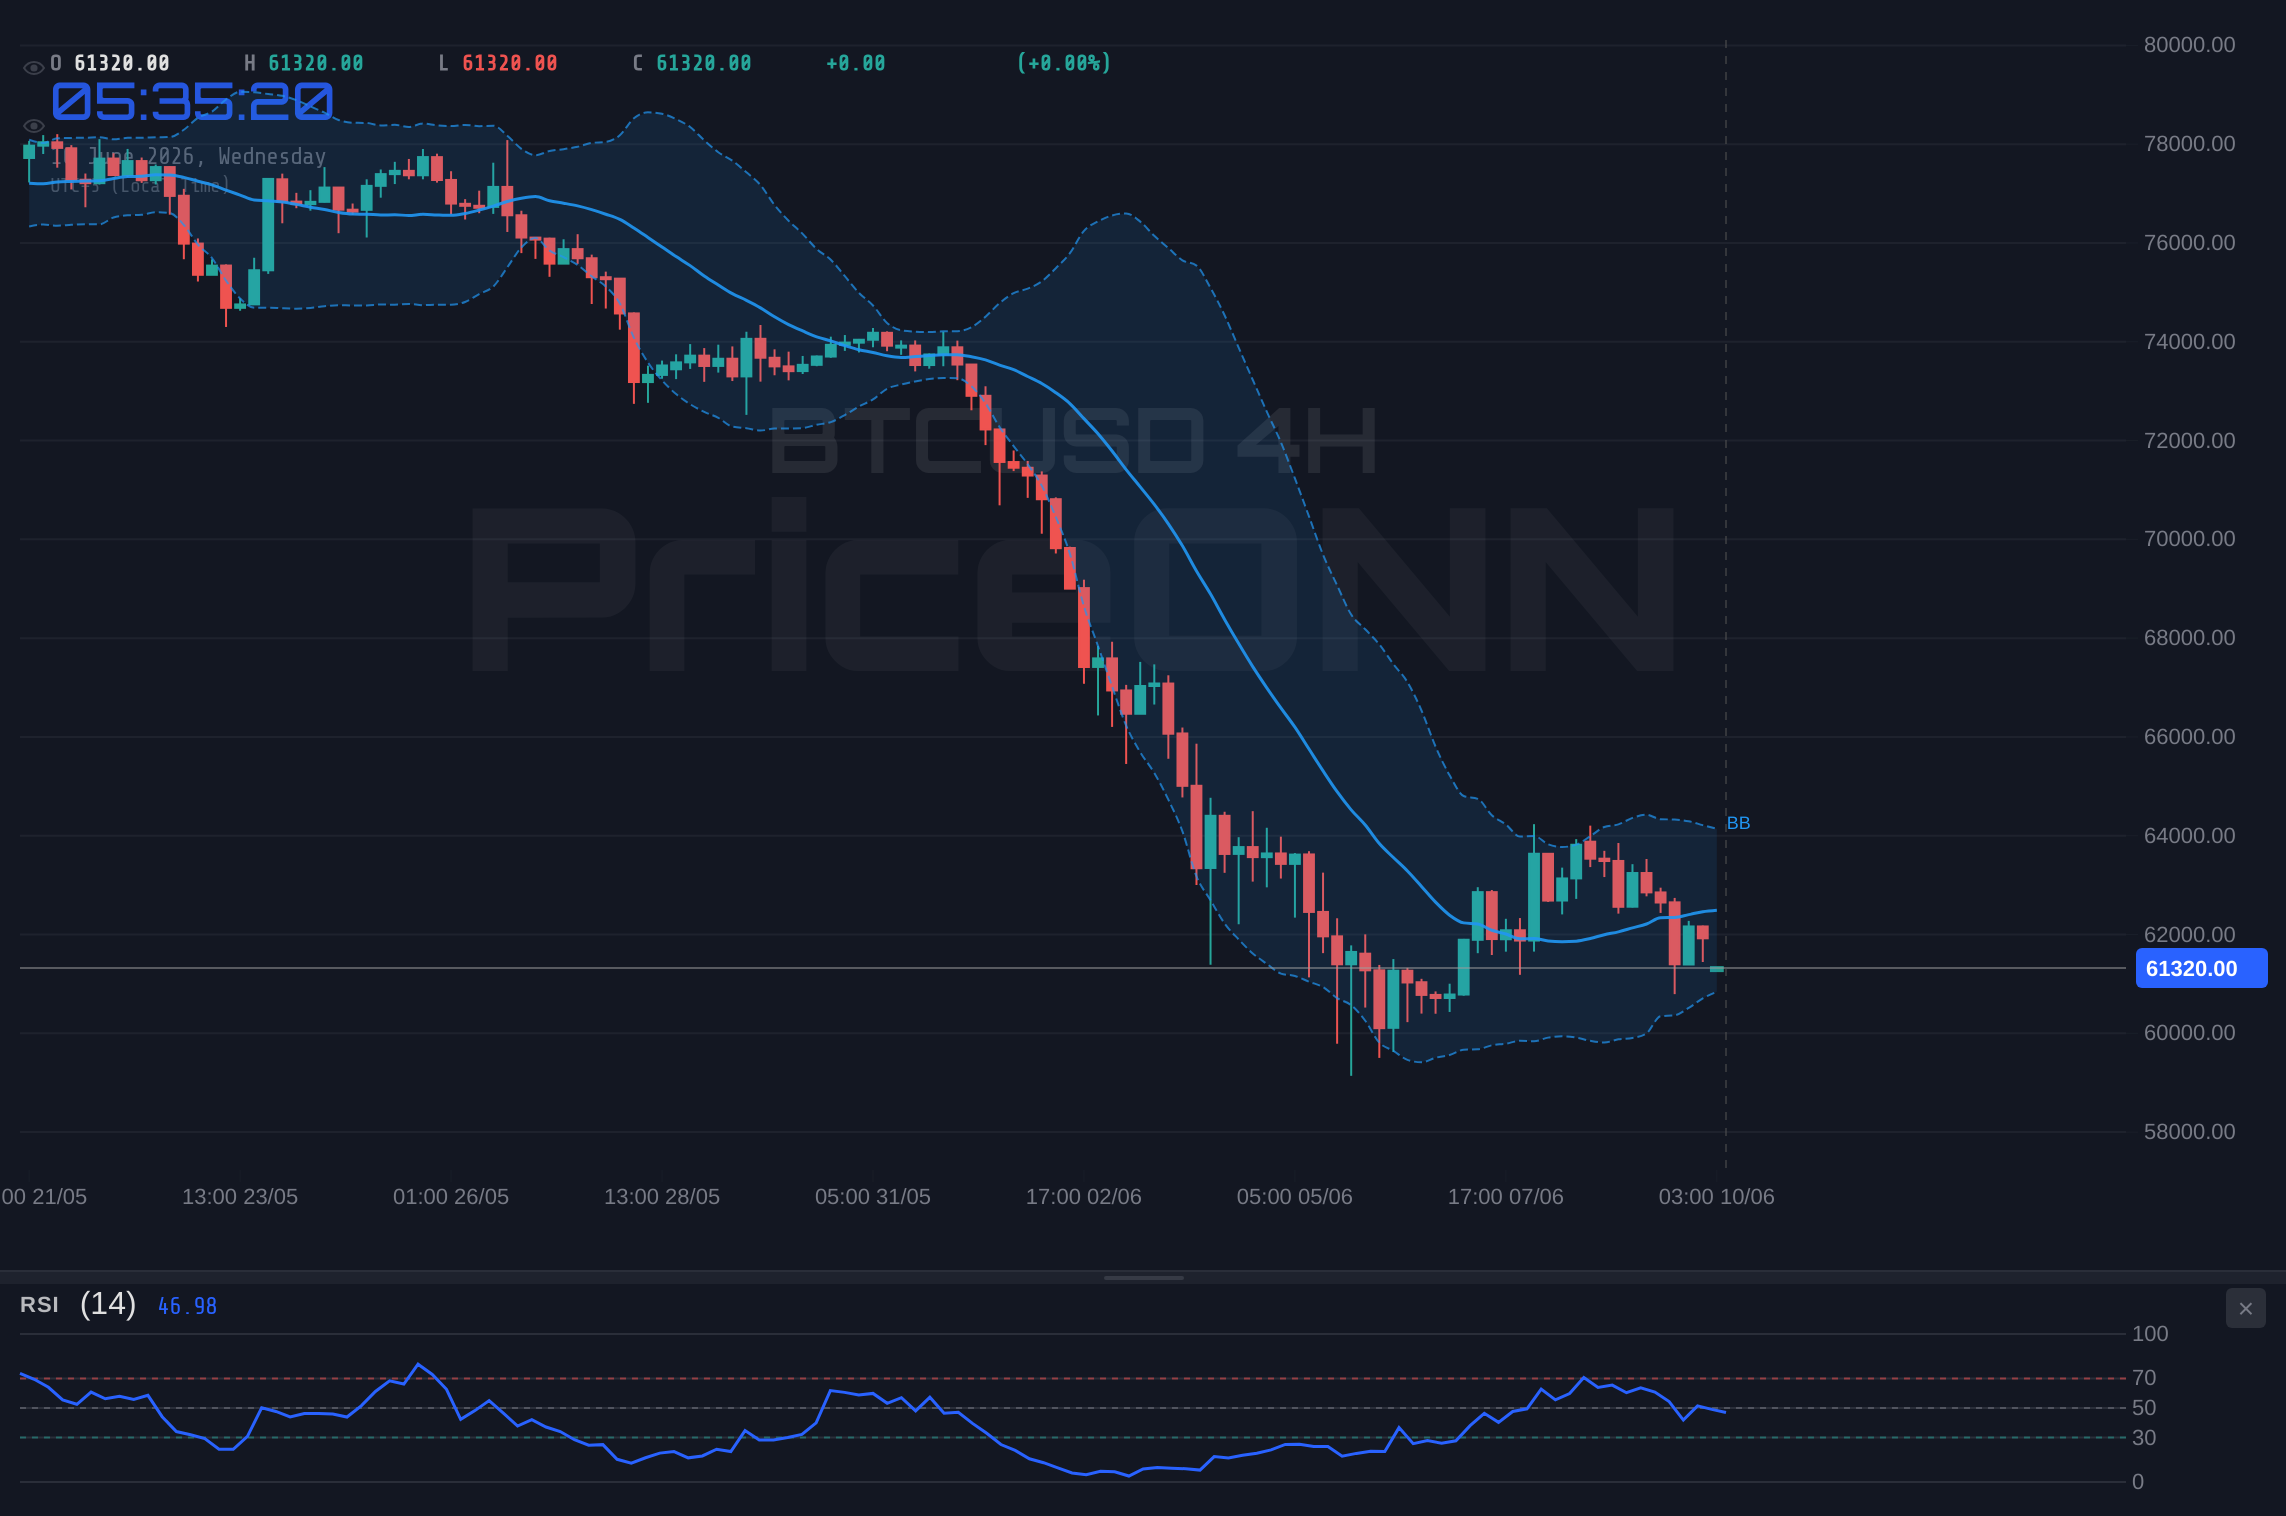
On the 4H chart, the MACD has turned positive, indicating at least a short-term momentum rotation away from the most aggressive selling impulse. This matters because it suggests the sharpest phase of the recent selling leg may be losing its structural grip at current prices. The 4H RSI at 41.95, while not screaming oversold on its own, sits in neutral territory that frequently precedes relief bounces when the daily timeframe is this stretched. The divergence between daily oversold conditions and 4H neutral momentum is a setup worth monitoring closely.
The daily price range today tells an important story on its own terms. BTCUSD printed a session low of $60,793 before recovering back toward $61,611. That represents roughly an $818 intraday recovery from the lows; not a dramatic reversal, but demonstrable evidence that buyers stepped in at a specific price. The $61,061 4H support level has served as a key reference zone during this decline, and the 1H support cluster at $61,275 and $61,108 has seen repeated touches without collapsing. When a level absorbs multiple tests without giving way, it accumulates structural significance in the order book.
For the bullish thesis to gain meaningful traction and shift the technical picture, BTCUSD would need a confirmed hourly close above $62,090. That level represents the immediate line in the sand for intraday sentiment. Above it sits a resistance cluster at $62,257 and $62,581 that must also be cleared to challenge the 4H bearish trend structure. The more ambitious target in a genuine recovery scenario sits at $62,827 and eventually $63,378, based on 4H resistance architecture.
Daily Stochastic K/D bullish crossover at 21.08/14.72, combined with 4H MACD turning positive, suggests at minimum a short-term relief bounce is developing. The $60,793 session low holding intraday is a small but real sign of buyer participation at these levels.
Why the Trend Is a Loaded Gun Pointed at BTC Bulls Right Now
Here is where the bear case becomes genuinely uncomfortable for anyone hoping for a V-shaped recovery. The daily ADX at 44.78 is not a reading that allows for casual dismissal. That is a very strong trending environment by any standard technical classification, and historically, when ADX climbs this high in a bearish direction, RSI oversold conditions can persist far longer than most traders anticipate or can tolerate. "Oversold" does not automatically translate to "due for a bounce immediately." In a trending market with this kind of momentum behind the sellers, oversold RSI is a caution flag, not a buy trigger.
The daily Bollinger Band position confirms the severity of the move: price is trading below the lower band. In strong trending conditions, this signals a breakout continuation move lower rather than a textbook mean-reversion buy. The 4H Stochastic tells a similar story of persistent selling pressure: K=27.28 has crossed below D=39.20, a clear bearish signal that intermediate-timeframe sellers retain the structural advantage. And the 1H timeframe? Eight out of eight indicators pointing to sell with zero buy signals registering. That kind of unanimous consensus does not materialize in a healthy base-building environment.
The sell-off from the session high of $63,853 to the current $61,611 represents a move exceeding $2,200 in a single trading day. That is not a technical dip. That is directional conviction with momentum behind it. Strong US employment data referenced in recent market reports applied broad pressure across risk assets: non-farm payrolls coming in robustly above expectations raised fears that the Federal Reserve would maintain its hawkish posture and potentially deliver additional rate hikes. When rate hike expectations strengthen, Bitcoin historically faces the dual headwind of tightening liquidity and declining risk appetite simultaneously.
The BTCUSD trend analysis across multiple timeframes creates a lopsided picture: the daily trend is bearish at 100% strength, the 4H trend is bearish at 87% strength, and only the 1H is showing neutral readings with tentative divergence signals. This multi-timeframe alignment on the bearish side is significant. It means that even if the 1H produces a bounce, that bounce faces overhead resistance from both 4H and daily trend forces pushing in the opposite direction. Bounces in this environment tend to be shallow and short-lived without a meaningful catalyst.
The critical line for bears is unambiguous: if BTCUSD loses the $61,061 4H support with a confirmed close below that level, the next meaningful structural floor sits at $60,545 from daily support, and below that the $59,436 zone becomes the next tactical target. A close below today's session low of $60,793 on a daily basis would confirm the bear trend is actively resuming after only a brief consolidation pause.
ADX at 44.78 on the daily chart is a critical warning sign that trend momentum is firmly bearish. RSI oversold conditions in high-ADX environments have historically persisted through multiple sessions before any meaningful reversal materializes. Premature counter-trend long positions carry elevated risk here.
What BTCUSD Market Sentiment Analysis Says About the Macro Backdrop
BTCUSD does not trade in a vacuum, and the macro backdrop right now is not providing the tailwinds that bulls need. The DXY dollar index is sitting at 99.73, with the daily signal firmly pointing to buy at 8 out of 8 indicators. A strengthening dollar and a risk-off crypto environment typically move in lockstep, and that correlation is playing out with precision today. DXY daily RSI at 63.9 still has room to run before reaching overbought territory, meaning dollar strength may not be exhausted yet. When the dollar catches a sustained bid, Bitcoin historically struggles for meaningful oxygen on the upside.
The broader equity picture adds further nuance. SP500 is showing a split personality: the 1H chart registers a strong uptrend with ADX at 49.72, yet the daily timeframe remains in a bearish trend at 100% strength. Nasdaq 100 is down 1.44% to 28,967 in today's session, with its 4H ADX at 33.51 confirming a strong downtrend that has been developing over recent weeks. Recent market commentary has described the Nasdaq as potentially entering a meaningful correction phase, with weak market breadth and Fed rate hike fears cited as primary drivers. Bitcoin's correlation to growth assets like Nasdaq tends to tighten precisely during these risk-off episodes, amplifying the selling pressure.
The dominant macro catalyst this week is the US CPI release. According to reports from the past 48 hours, traders have been taking profits and positioning cautiously ahead of this high-stakes inflation data event. Market commentary notes that Fed rate hike expectations have been building specifically on the back of robust employment data that came in well above consensus. If the upcoming CPI prints above expectations, the "higher for longer" rate narrative accelerates aggressively, and the risk-off pressure on Bitcoin deepens. A softer CPI print, on the other hand, could provide the macro catalyst needed to trigger the oversold bounce that the daily RSI is technically primed for.
$61,275 and $62,090; The Exact Lines Where This Trade Gets Decided
BTCUSD support and resistance levels form a clear tactical map for the sessions ahead. The immediate 1H support cluster at $61,599, $61,275, and $61,108 is doing the heavy lifting for any short-term stabilization attempt. The fact that price is hovering right at the first layer of this support tells us we are in a live decision zone. Every session that passes without a clean break lower is a marginal point for the bulls trying to build a base from which a relief rally can develop.
On the resistance side, $62,090 is the first meaningful ceiling that bulls need to reclaim to shift the intraday narrative. That level represents a clean move from current prices that is achievable in a single momentum spike, but only if volume supports the move convincingly. The $62,495 4H resistance is the more significant ceiling: clearing that level would begin to challenge the 87% strength bearish trend that has dominated the 4H timeframe throughout this decline. A daily close above $62,827 would start to seriously question whether the primary bearish thesis remains intact.
Three Scenarios; One Market, One Decision Point
Continuation Lower; Bears Complete the Breakdown
60% ProbabilityConsolidation; Market Waits for the CPI Catalyst
27% ProbabilityThe Bear Trap; Oversold Bounce Ignites Short-Cover Rally
13% ProbabilityScalpers, Swing Traders, and Long-Term Buyers; Same Data, Different Playbooks
One of the most important dimensions of this BTCUSD analysis is recognizing that the same technical data means fundamentally different things to traders operating on different time horizons. For a scalper working the 1H chart, the neutral trend with tentative stochastic crossover signals creates potential for small bounce trades targeting the $62,090 resistance. But execution discipline is non-negotiable: stops must sit below $61,108, and the moment price fails to sustain above $61,599, the trade is closed. The risk/reward is marginal unless the entry is precise and position sizing is appropriately conservative.
For a swing trader operating on the 4H timeframe, the picture is clearer and significantly less appealing for long positions. The 87% bearish trend strength and ADX at 34.58 communicate a straightforward message: do not fight this trend without explicit confirmation of a reversal. Swing traders should be evaluating short entries on bounces toward the $62,090 to $62,257 resistance zone, with targets at $61,061 and $60,545, using a stop above $62,581 for clean invalidation. That setup offers a favorable risk/reward ratio that aligns with the dominant trend direction.
The long-term accumulator perspective is where the RSI reading becomes most strategically relevant. On a multi-week or multi-month basis, RSI at 24.97 is a statistical outlier that has historically preceded meaningful recoveries in Bitcoin's price history. If you are operating without leverage and your time horizon extends well beyond the current CPI noise and rate hike speculation cycle, the zone between $60,793 and $62,000 may genuinely represent a multi-week accumulation opportunity. But that thesis demands patience and the conviction to sit through potential further weakness toward $59,436 daily support before any sustained recovery becomes visible.
The BTCUSD breakout level that would fundamentally change the technical picture is $63,378. A clean reclaim of that upper 4H resistance would signal that the bears have genuinely lost structural control of the intermediate trend. That level sits approximately 2.87% above current prices and requires a meaningful catalyst to reach. The US CPI print is the most obvious near-term trigger with the power to provide that catalyst in either direction within the current week.
Frequently Asked Questions: BTCUSD Analysis
What does BTCUSD's daily RSI at 24.97 actually mean for price at $61,611?
A daily RSI of 24.97 places BTCUSD in extreme oversold territory, signaling that recent selling pressure has been historically intense relative to any buying activity. However, with ADX at 44.78 confirming a very strong downtrend, this oversold reading does not automatically signal an immediate reversal. In high-ADX trending environments, RSI can remain oversold across multiple sessions, making a confirmed close above $62,090 resistance the essential prerequisite before treating this as a actionable buy signal.
Should I buy BTCUSD at $61,611 given the oversold RSI ahead of the US CPI release?
The oversold RSI creates a statistical case for a relief bounce, but buying ahead of a high-stakes CPI release carries elevated uncertainty that most risk frameworks would flag. If CPI prints above expectations, the Fed rate hike narrative strengthens and Bitcoin typically faces renewed selling pressure. A more disciplined approach is waiting for a confirmed close above $62,090 after the CPI release before initiating long positions, with stop loss defined below $61,275.
If BTCUSD breaks below $61,061 support, where is the next key price level?
A confirmed 4H close below the $61,061 support level would open the path toward the $60,545 daily support zone, which represents the next meaningful structural floor. Below that, the $59,436 daily support is the last significant demand reference before the market enters more technically open territory. The daily ADX at 44.78 confirms the sellers have sufficient momentum to test these levels if $61,061 breaks cleanly without a recovery volume spike.
How will the upcoming US CPI data affect BTCUSD price action this week?
The US CPI release is the dominant macro catalyst for BTCUSD this week, with traders already repositioning cautiously by taking profits ahead of the print. A hot CPI reading reinforcing the higher-for-longer rate narrative would likely accelerate Bitcoin's decline toward $60,545 and potentially $59,436. A softer CPI print could provide the macro catalyst needed to trigger the oversold bounce the daily RSI is technically primed for, potentially driving price toward the $62,495 to $62,827 resistance band.
BTCUSD is at a genuinely critical inflection point, and the data is honest about the difficulty of the call. The bears hold the structural advantage with ADX at 44.78, multi-timeframe trend alignment, and macro headwinds from dollar strength and rate hike expectations. The bulls hold one powerful card: RSI at 24.97 is the kind of reading that has historically marked points where risk/reward begins to shift for patient, long-horizon investors. The CPI release is the decisive near-term catalyst. Until that data resolves the macro uncertainty, the most disciplined position is knowing exactly where you stand, defining your levels, and letting the market show its hand first.
Track markets in real-time
AI-powered analysis, technical indicators and real-time price data.
Join Our Telegram Channel
Breaking market news, AI analysis and trading signals instantly.
Join Channel