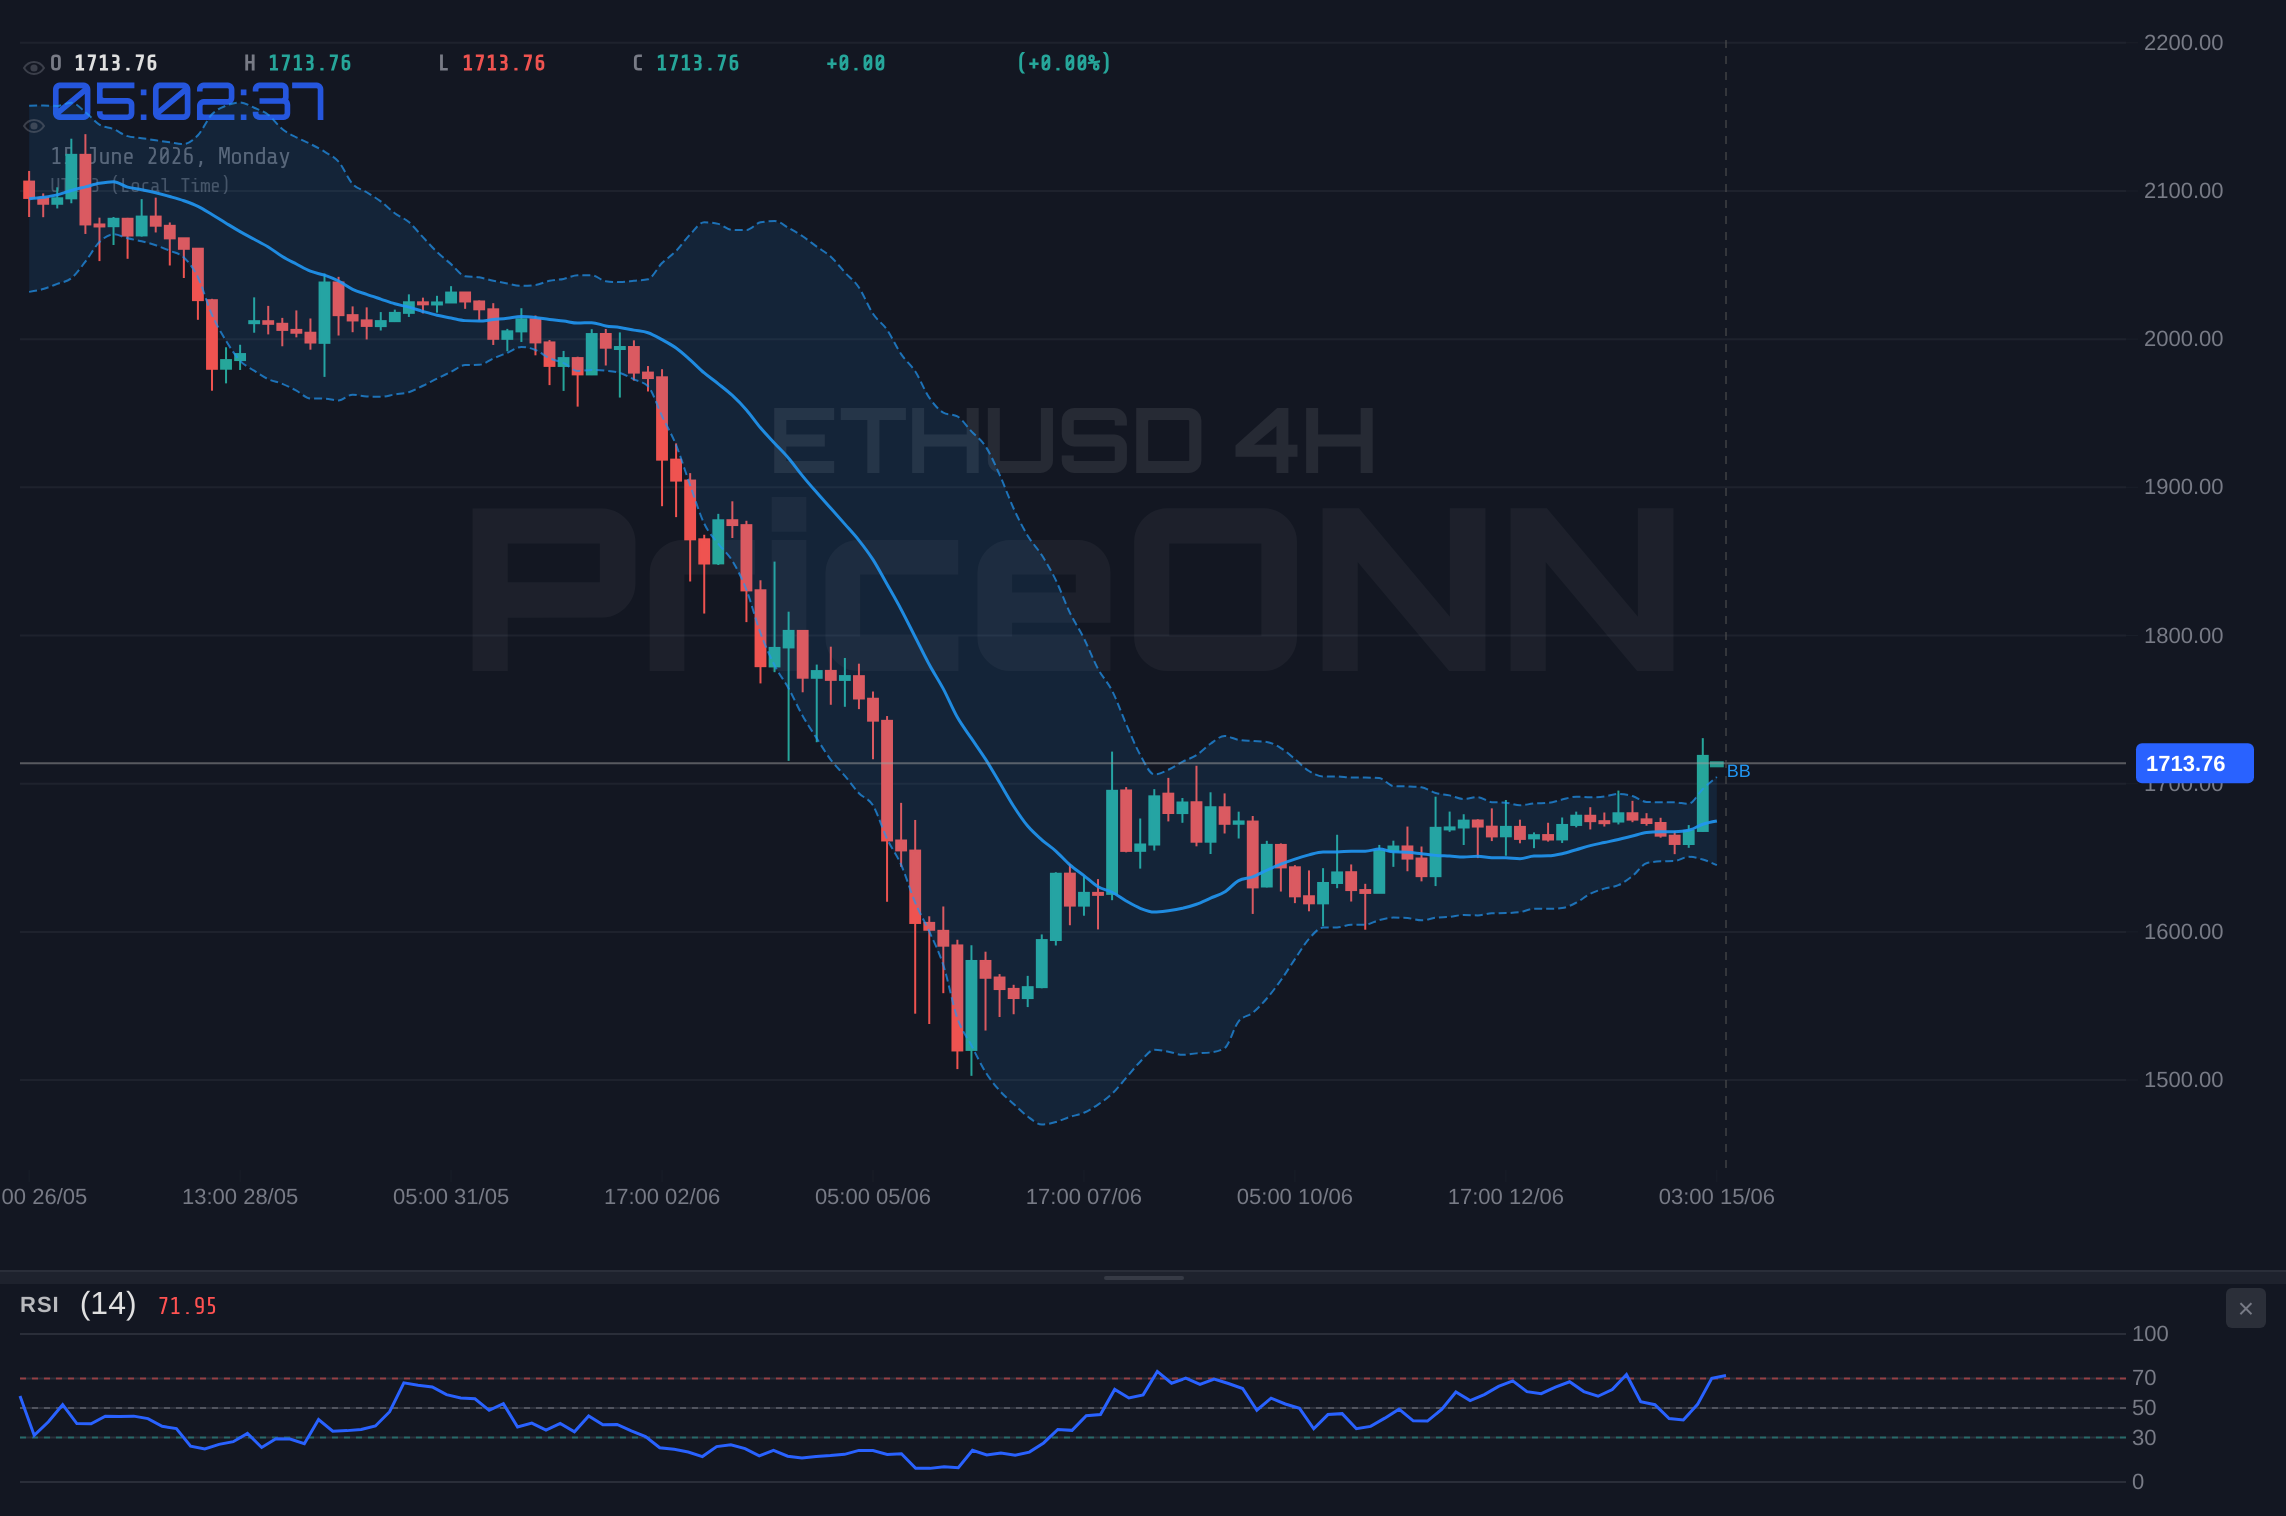
Is ETHUSD's recent push towards the $1,700 level a sign of sustained recovery, or are lingering inflation fears poised to put a damper on crypto's leading altcoin? With ETHUSD currently hovering around $1,715.07, the market is at a critical juncture. The 1-hour chart shows a bullish trend with RSI at 71.78, indicating overbought conditions might soon trigger some profit-taking. However, the 1-day chart paints a different picture, showing a bearish trend with RSI at 37.29, suggesting that while the short-term momentum is up, the longer-term outlook remains cautious. This divergence highlights the conflicting signals traders are navigating. The question on everyone's mind is whether the current upward momentum can overcome macroeconomic headwinds and unlock further upside, or if this is merely a temporary reprieve before a renewed downdraft.
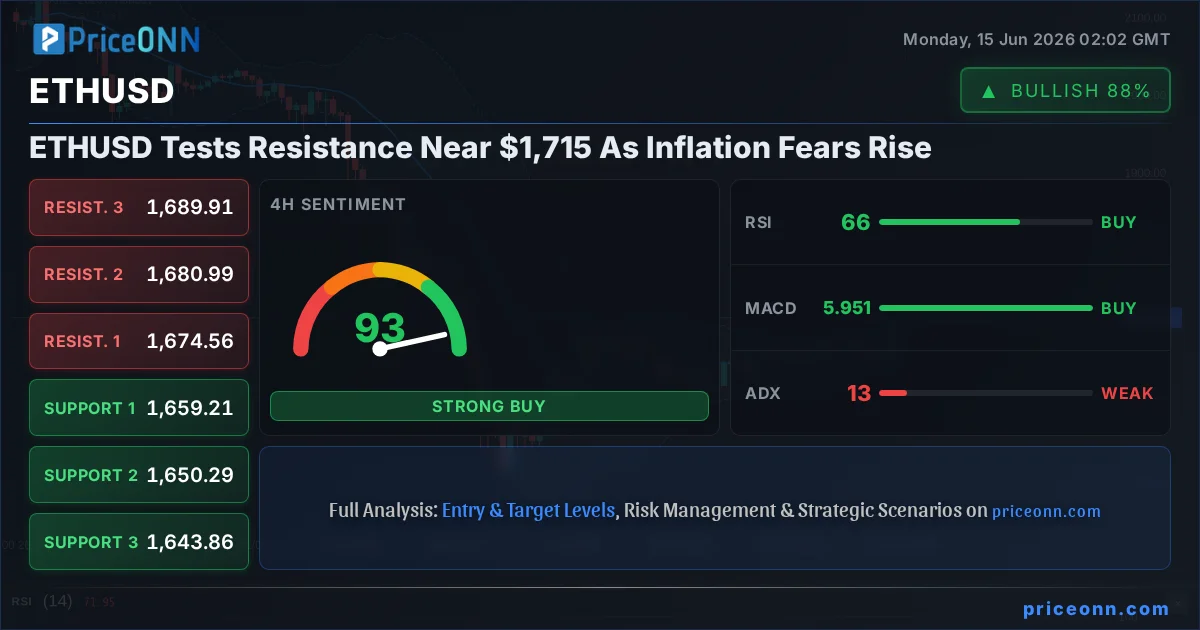
- ETHUSD is currently trading at $1,715.07, facing resistance near $1,727.17 on the 1H chart.
- Persistent inflation fears, indicated by rising energy prices and a strengthening DXY at 99.6, pose a significant risk to crypto assets.
- The 1-hour RSI is at 71.78 signaling overbought conditions, while the 1-day RSI sits at 37.29, suggesting a bearish undertone.
- Key levels to watch: Support at $1,700.69 and resistance at $1,727.17 for short-term direction.
The Bull's Roadmap: Navigating the $1,700 Threshold
ETHUSD Today Analysis: Breaking the Chains of Doubt
The current price action for ETHUSD, hovering around $1,715.07, presents an intriguing scenario for bulls. On the 1-hour timeframe, the trend is decidedly bullish, supported by an ADX reading of 32.8, which signifies a strong trend. The MACD is also showing positive momentum, sitting above its signal line, and the Stochastic oscillator is in bullish territory with %K at 84.63, surpassing %D. This confluence of indicators on the shorter timeframe suggests that short-term traders might find opportunities on the buy-side. The immediate resistance level to clear is $1,727.17. A decisive break and hold above this level, accompanied by increasing volume, could signal the start of a more sustained upward move, potentially targeting the next resistance at $1,735.57. The overall signal on the 1H chart is AL (Buy), with 7 out of 8 indicators suggesting a buy. This short-term strength is what bulls are clinging to, hoping it can override the broader market concerns.
However, the enthusiasm must be tempered by a look at the longer-term picture. The 1-day chart presents a starkly different view. Here, the trend is classified as bearish, with an ADX of 52.43 indicating a very strong downward trend, despite the current positive momentum on shorter timeframes. The RSI at 37.29 is in neutral territory but trending downwards, and the MACD is below its signal line, reinforcing the bearish sentiment. The Stochastic, while showing a rising %K at 68.25, is still below %D on some interpretations, and the Bollinger Bands are below the middle band. This conflict between short-term bullish signals and longer-term bearish indicators is precisely what creates the 'watch zone' scenario. It suggests that while there might be tactical short-term trades to be made, the overarching trend is still a concern for significant upside.
When Bears Take Control: The Inflationary Headwinds
ETHUSD Price Forecast: The Shadow of Macroeconomics
The macroeconomic backdrop is currently dominated by persistent inflation fears, which are casting a long shadow over risk assets like Ethereum. The provided data shows the DXY (Dollar Index) at 99.6, with a 1-hour trend indicating a potential move higher, and a 4-hour trend that is neutral but poised for a move down. A strengthening dollar typically exerts downward pressure on commodities like gold and, by extension, riskier assets such as cryptocurrencies. The data also shows Brent crude oil and WTI crude oil experiencing significant daily drops, down 6.83% and 6.84% respectively. While falling oil prices might seem like a deflationary signal, the underlying narrative is often more complex. This sharp decline could be a reaction to demand concerns amidst a slowing global economy, or it could be a temporary correction in a still-inflationary environment. The fact that energy prices have been volatile and generally elevated over recent periods means that inflation remains a central bank concern. This is crucial for ETHUSD because higher inflation often leads to tighter monetary policy – higher interest rates – which increases the cost of capital and reduces the attractiveness of speculative investments.
The S&P 500 and Nasdaq are showing mixed signals, with the S&P 500 trading at 6572.87 (up 0.74%) and the Nasdaq at 30147.88 (up 2.54%). While these gains are positive, the 1-day trend for both indices is bearish, suggesting that the underlying sentiment might still be cautious. If risk appetite falters and these indices turn sharply downwards, it's highly probable that ETHUSD will follow suit. The correlation between tech stocks and ETHUSD is well-established; a broad market sell-off would likely drag Ethereum down with it, regardless of its own internal technical strength. The 1-day ADX for SP500 is 47.51 and Nasdaq is 30.54, indicating strong trends. The fact that ETHUSD's 1-day ADX is also high at 52.43, but in a bearish trend, underscores the prevailing bearish sentiment in the broader market that is likely influencing ETHUSD's longer-term trajectory.
The Waiting Game: Consolidation and Uncertainty
ETHUSD Key Levels: Caught Between Two Worlds
The current technical setup for ETHUSD, with conflicting signals across different timeframes, points towards a potential period of consolidation or range-bound trading. The immediate support level on the 1-hour chart is $1,700.69, followed by $1,690.9, and then $1,650.29 on the 4-hour chart. Conversely, immediate resistance is found at $1,727.17, with further levels at $1,735.57 and $1,740.41 on the 1-hour timeframe. The 4-hour chart shows resistance at $1,680.99 and $1,689.91. This proximity of support and resistance levels, coupled with the mixed signals from indicators like RSI and ADX across different timeframes, suggests that ETHUSD might struggle to establish a clear directional trend in the short to medium term. Traders are likely waiting for a more definitive catalyst – either a strong macroeconomic data release that solidifies the inflation narrative and central bank policy, or a significant shift in risk sentiment – to break this stalemate.
On-chain data, while not provided in the live API feed, would be crucial here. For instance, a significant increase in active addresses or whale movements could signal conviction behind a potential move. Similarly, large inflows to exchanges might suggest selling pressure, while outflows could indicate accumulation. Without this on-chain context, we must rely on price action and macro indicators. The current situation is akin to a market holding its breath. The $1,700 level acts as a psychological and technical pivot. A hold above this level on the 1D chart might provide some temporary relief, but the overarching bearish trend indicated by the 1D ADX of 52.43 suggests that any rallies might be met with selling pressure as traders look to de-risk.
Which Scenario is Most Likely? A Probabilistic Approach
ETHUSD Trading Signals: Gauging the Odds
Assessing the probabilities for ETHUSD's immediate future requires weighing the conflicting signals. The 1-hour chart, with its strong bullish trend and buy signals across most indicators, presents a compelling case for a short-term bounce. If ETHUSD can decisively break above the $1,727.17 resistance, targeting $1,735.57 and potentially $1,740.41, this bullish scenario could play out. This would likely be fueled by a temporary easing of inflation fears or a dovish surprise from a central bank, or simply by short-term traders capitalizing on the positive momentum. I'd assign a 35% probability to this scenario playing out in the next 24-48 hours, contingent on breaking key resistance.
However, the prevailing macroeconomic concerns and the bearish technicals on the 1-day chart cannot be ignored. The persistent inflation narrative, a strengthening dollar (DXY at 99.6), and potential weakness in equity markets (SP500 and Nasdaq showing bearish 1D trends) create a strong headwind. If ETHUSD fails to break decisively above $1,727.17, or if it breaks below the immediate 1-hour support at $1,700.69, the bearish scenario becomes more probable. A close below $1,700.69 could open the door for a swift move towards the 4-hour support at $1,650.29, and potentially even lower towards the 1-day support levels around $1,631.59. I assign a 55% probability to this bearish scenario unfolding, especially if macroeconomic data continues to point towards sustained inflation and tighter monetary policy. This is the path of least resistance given the current macro environment and the 1D technicals.
The neutral or consolidation scenario, where ETHUSD trades within the range defined by the immediate support at $1,700.69 and resistance at $1,727.17, is also a distinct possibility, especially if key economic data releases offer no clear direction. This scenario would likely persist until a more significant catalyst emerges. I estimate a 10% probability for this ranging market scenario to dominate the next few days, as the strong ADX readings on both the 1H and 1D charts suggest that the market is leaning towards a directional move, rather than a prolonged sideways chop.
The Bear's Grip: Downside Risk Dominates
55% ProbabilityThe Bull's Gambit: A Short-Term Rally?
35% ProbabilityThe Sideways Shuffle: Range-Bound Trading
10% ProbabilityWhat I'm Watching This Week: Key Triggers for ETHUSD
ETHUSD Market Sentiment: Watching the Macro Clock
As we navigate this uncertain market, several key triggers will dictate ETHUSD's next significant move. Firstly, I'll be closely monitoring macroeconomic data releases, particularly anything related to inflation. If upcoming reports show inflation remaining sticky or even re-accelerating, it would likely reinforce the case for tighter monetary policy, strengthening the DXY and putting pressure on ETHUSD. Conversely, any signs of inflation cooling significantly could lead to a reassessment of central bank hawkishness, potentially boosting risk assets. The DXY's movement will be a critical barometer; a sustained push above 100.00 would be a bearish signal for ETHUSD.
Secondly, the price action around the $1,700.69 support and $1,727.17 resistance levels on the 1-hour chart is paramount. A clear break and hold above resistance, or a decisive fall below support, will provide directional clarity. Volume accompanying these moves will be key; a breakout on low volume is less convincing than one supported by significant trading activity. Finally, I’ll be watching the correlation with major equity indices like the S&P 500 and Nasdaq. If these indices experience significant pullbacks, it's highly probable that ETHUSD will follow. A bearish divergence or breakdown in these broader markets would serve as a strong warning signal for Ethereum.
Frequently Asked Questions: ETHUSD Analysis
What happens if ETHUSD breaks below the $1,700.69 support level?
If ETHUSD closes decisively below the $1,700.69 support on the 1-hour chart, it would likely trigger further downside, potentially targeting the 4-hour support at $1,650.29. This scenario is more probable if macroeconomic data continues to fuel inflation concerns and a stronger dollar.
Should I consider buying ETHUSD at current levels of $1,715.07 given the mixed signals?
Buying at current levels requires careful risk management. A short-term bullish scenario is possible if ETHUSD breaks above $1,727.17, but the longer-term bearish trend on the daily chart suggests caution. A more prudent approach might be to wait for a confirmed break above resistance or a clear test of lower support levels with bullish confirmation.
Is the RSI at 71.78 on the 1-hour chart a sell signal for ETHUSD right now?
An RSI reading of 71.78 on the 1-hour chart indicates overbought conditions, suggesting that the recent upward momentum may be unsustainable in the very short term and could lead to some profit-taking. However, it's not a definitive sell signal on its own, especially if the trend remains strongly bullish on that timeframe. Confirmation from price action and other indicators is needed.
How will persistent inflation fears affect ETHUSD's price this week?
Persistent inflation fears typically lead to expectations of tighter monetary policy, which strengthens the US Dollar (DXY) and puts pressure on risk assets like ETHUSD. If inflation data remains high, we could see ETHUSD struggle to maintain its gains, potentially breaking below key support levels as investors seek safer assets.
Technical Outlook Summary
| Indicator | Value | Signal | Interpretation |
|---|---|---|---|
| RSI (14) | 71.78 | Neutral | Overbought on 1H, Neutral on 1D. Caution advised near resistance. |
| MACD Histogram | +0.78 | Bullish | Positive momentum on 1H, but check daily divergence. |
| Stochastic | K=84.63, D=77.43 | Bullish | Strong bullish signals on 1H, but nearing overbought territory. |
| ADX | 52.43 | Bearish | Very strong downtrend on 1D, contradicting short-term strength. |
| Bollinger | Upper Band | Watch | Price is above the middle band on 1H, but below on 1D. |
Key Levels
Support Levels
Resistance Levels
Track markets in real-time
AI-powered analysis, technical indicators and real-time price data.
Join Our Telegram Channel
Breaking market news, AI analysis and trading signals instantly.
Join Channel