Bitcoin, currently trading at a critical juncture near $66,350.00, presents a complex picture for traders and investors alike. After a notable surge, the question on everyone's mind is whether this upward momentum can be sustained or if a correction is imminent. This analysis dives deep into the multi-timeframe technicals, correlating market factors, and crypto-specific fundamentals to map out potential scenarios. We'll explore the crucial levels that will dictate Bitcoin's short-to-medium term direction, drawing on precise data points from the latest market feed to guide our assessment.
- RSI at 56.08 on the 1H chart signals upward momentum, but the MACD histogram shows negative momentum, indicating caution is warranted.
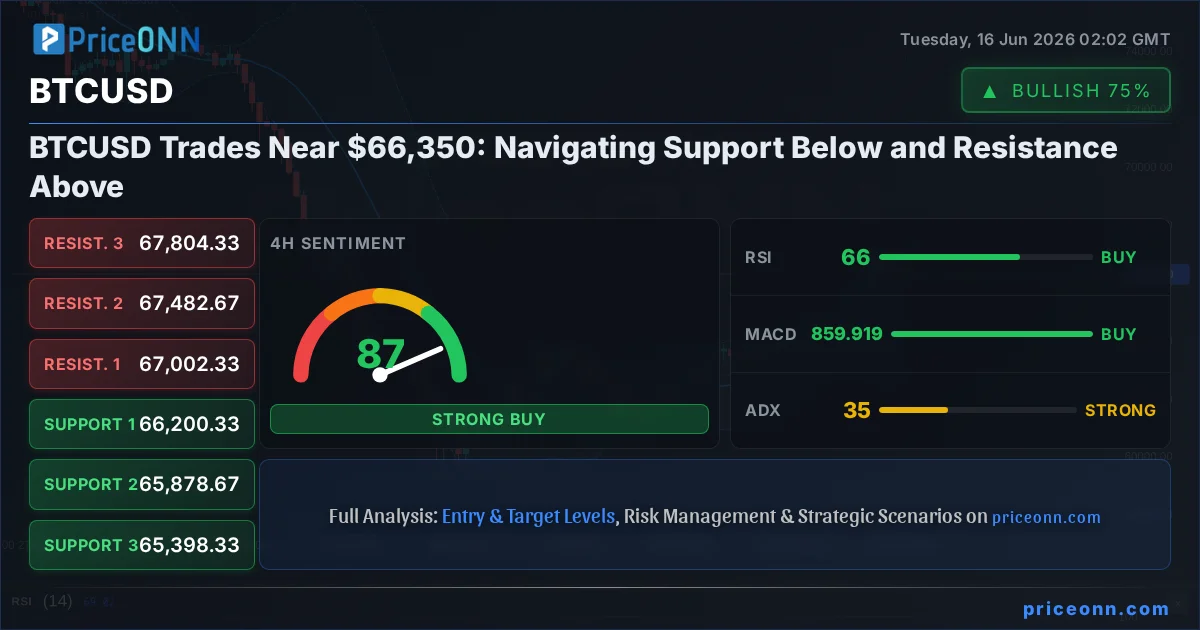
- Critical support for BTCUSD sits at $65,949, tested multiple times this week; a close below this level could trigger further downside.
- Resistance is forming near $66,624, a break above which could open doors for a move towards $67,804.
- DXY strength, currently at 99.73, could exert pressure on risk assets like BTCUSD if it reverses its recent dip.
The past week has seen significant volatility in the crypto market, with BTCUSD leading the charge. The current price action around $66,350.00 isn't just a number; it represents a battleground between bulls eager to push higher and bears looking to capitalize on any sign of weakness. Understanding the interplay of technical indicators, broader market sentiment, and crypto-specific dynamics is paramount for anyone navigating these choppy waters. This isn't about chasing the latest pump; it's about a data-driven approach to identify high-probability setups, manage risk effectively, and understand the 'why' behind market movements.
For those new to charting, the RSI (Relative Strength Index) measures the speed and change of price movements, with readings above 70 often indicating overbought conditions and below 30 oversold. The MACD (Moving Average Convergence Divergence) uses moving averages to reveal momentum and trend changes. Stochastic oscillators compare a specific closing price of a security to a range of its prices over a certain period. ADX (Average Directional Index) measures trend strength, not direction. These tools, when analyzed across multiple timeframes – from the short-term 1-hour (1H) to the daily (1D) – provide a layered perspective. Today, we’ll dissect these indicators for BTCUSD, considering how they align or diverge to paint a clearer picture of what might be next.
The Bull's Roadmap: Pushing Towards New Highs
Conditions for a Sustained Rally
For Bitcoin to extend its gains beyond the current $66,350.00 mark, several technical and fundamental conditions need to align. On the 1-hour chart, the RSI at 56.08, while not yet in overbought territory, shows upward momentum. However, the accompanying MACD histogram's negative momentum, with the MACD line below its signal line, suggests that the immediate upward push might be losing steam. This is where careful observation is key; a sustained rally needs this MACD to turn positive and ideally cross above its signal line, confirming renewed buying interest. Furthermore, the ADX at 33.17 indicates a strong trend, but its directionality needs confirmation from other indicators.
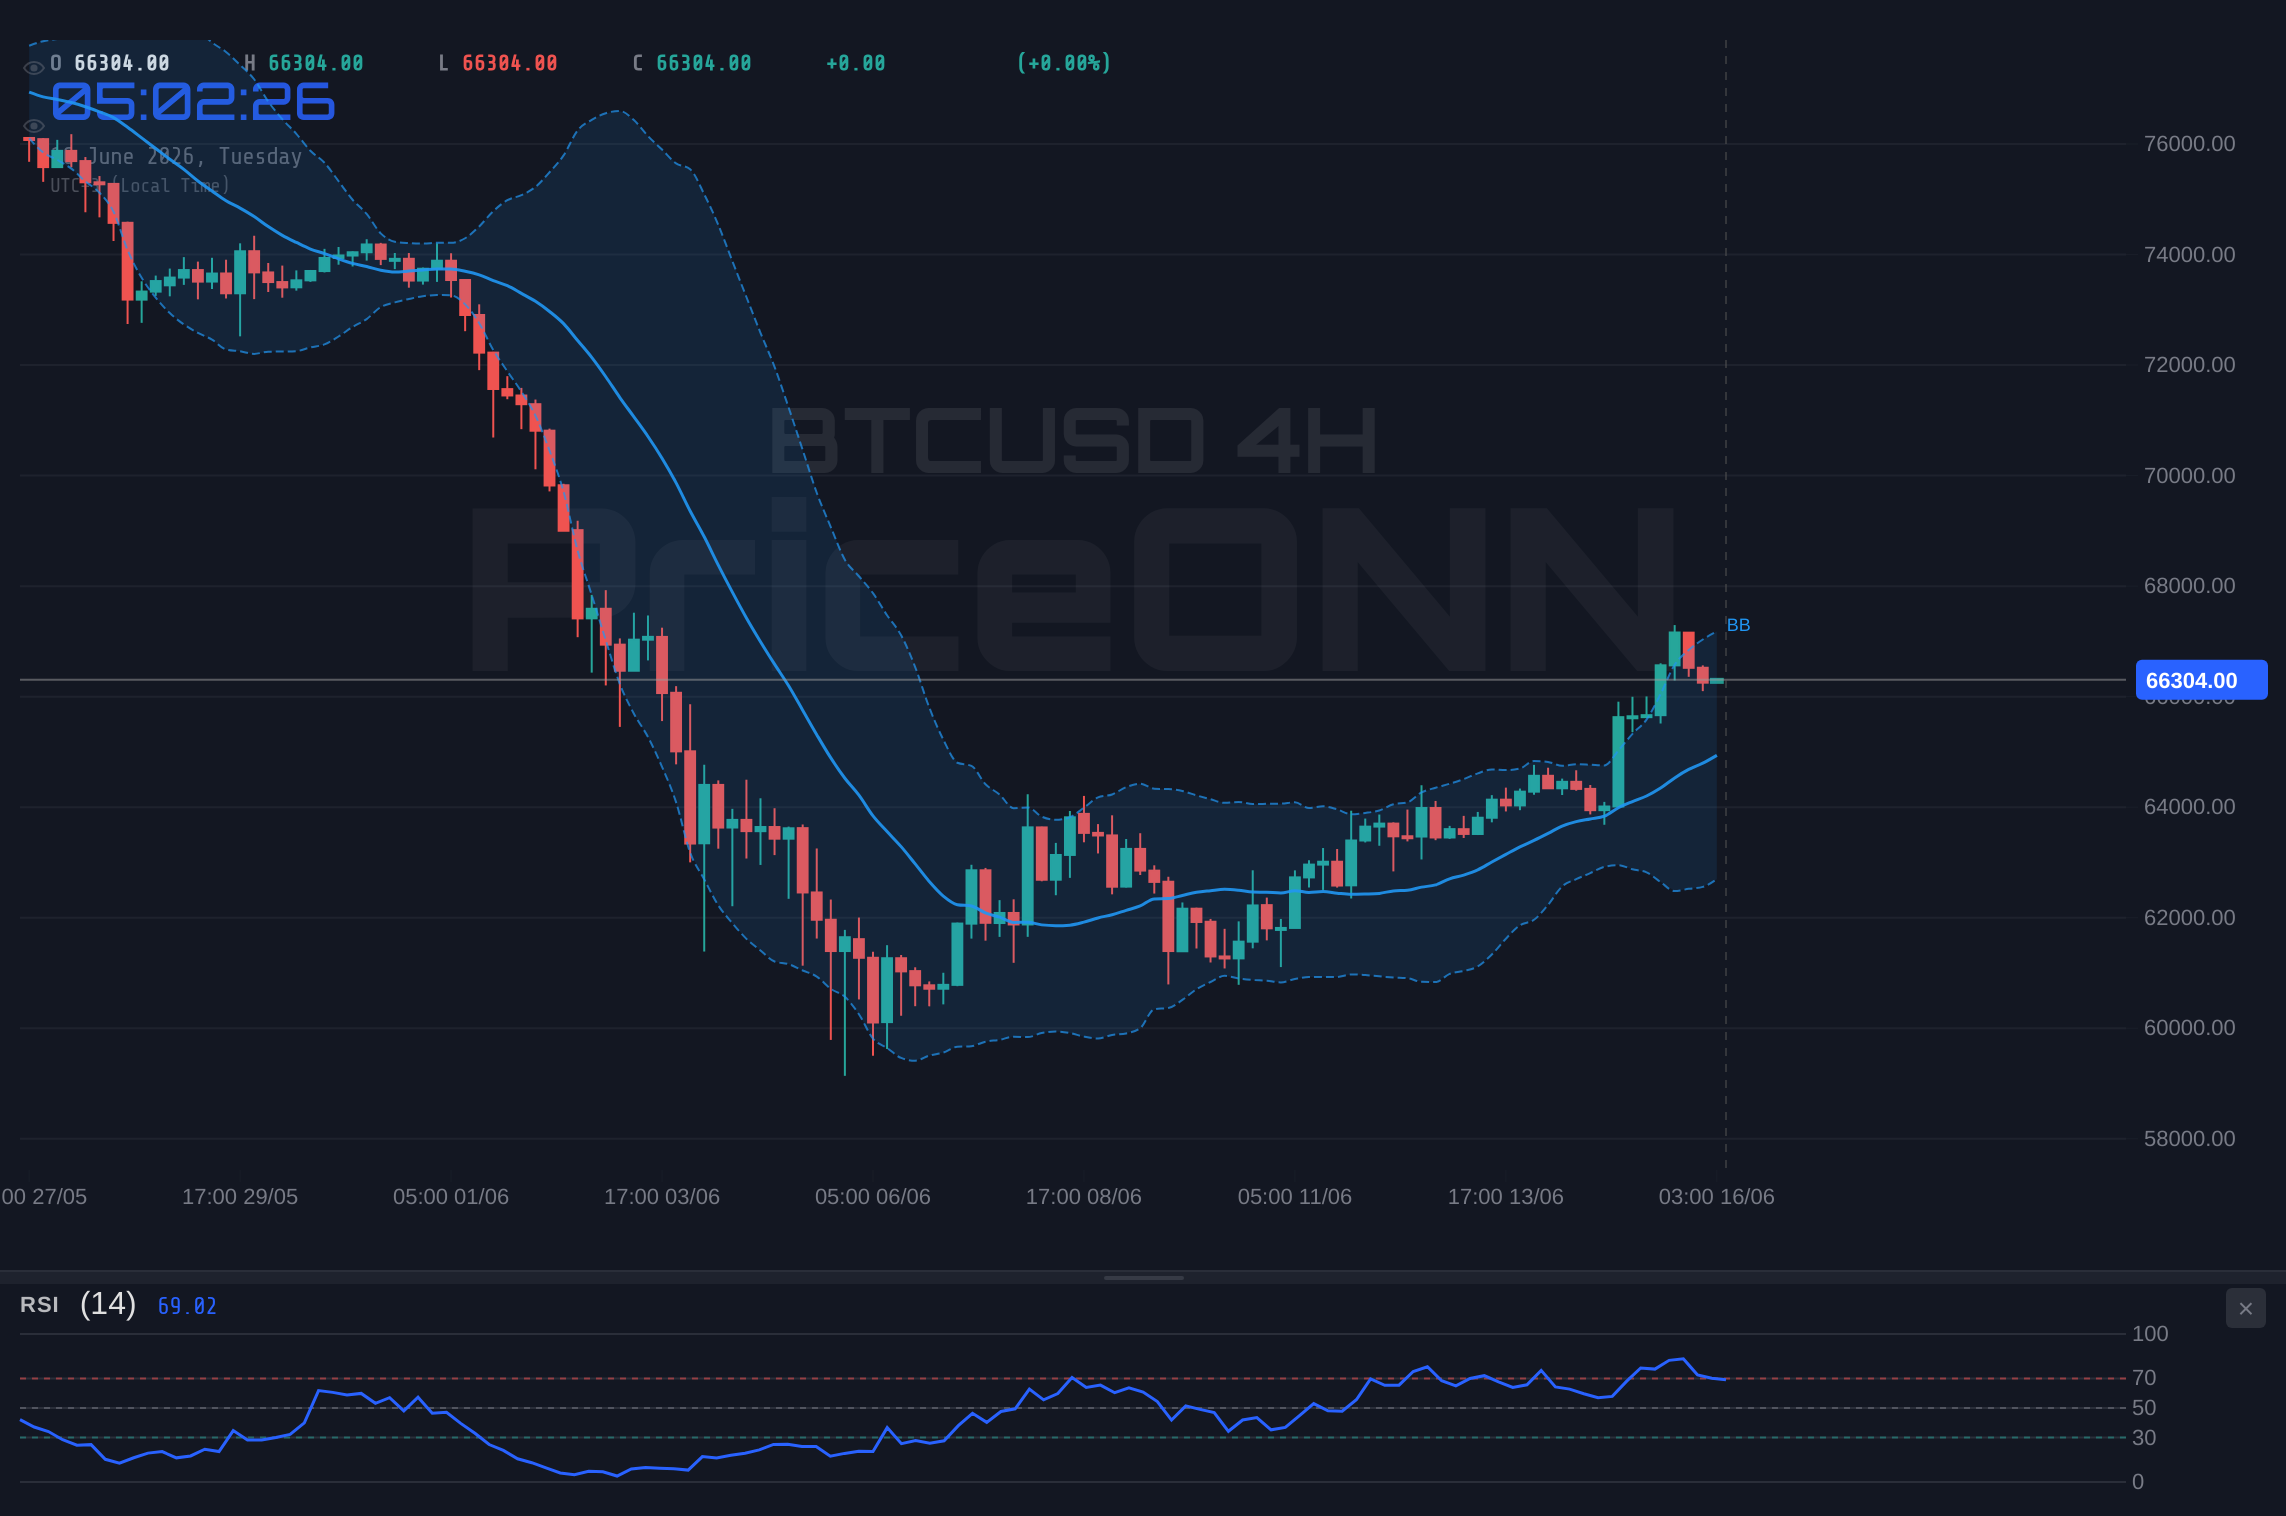
The 4-hour timeframe offers a more bullish perspective, with the RSI at 66.05 indicating strong upward sentiment but still below the critical 70 level that often signals potential exhaustion. The MACD here is positive and above its signal line, a much more encouraging sign for bulls. Bollinger Bands are also above the middle band, confirming the bullish trend. However, the Stochastic oscillator is flashing a warning: %K at 82.91 and %D at 85.11 suggests we are entering or are already in overbought territory on this timeframe. This divergence between the MACD and Stochastic on the 4H chart highlights the complexity – the trend is up, but the short-term momentum indicators are flashing warning signs for extended gains without consolidation.
A decisive break above the immediate resistance at $66,624 on the 1H chart is the first hurdle. Confirmation would ideally come with increased trading volume and a subsequent hold above this level, turning it into support. If this occurs, the next logical target becomes the 4-hour resistance at $67,482.67. A sustained push above this could then set sights on the psychological $70,000 level, though that remains a more distant objective. On the fundamental side, a continuation of the 'risk-on' sentiment seen in equities, perhaps fueled by positive economic data or dovish central bank signals, would provide a favorable backdrop. A weakening DXY, currently at 99.73 and showing signs of a neutral-to-weak trend on the 1H, could also support this bullish thesis by reducing pressure on risk assets.
Where Bears Take Control: The Risk of a Downturn
Key Levels to Watch for a Sell-Off
Despite the recent upward price action, the daily chart for BTCUSD paints a different, more cautious picture. The ADX at 42.46 indicates a strong downtrend on this longer timeframe, and the RSI at 44.36 suggests a bearish bias, sitting below the 50-level. The MACD is positive and above its signal line, which is a conflicting signal against the prevailing downtrend on the daily chart, but the Bollinger Bands are below the middle band, reinforcing the bearish sentiment. This divergence between MACD and the overall trend strength on the daily chart is crucial; it suggests that while a downtrend is technically present, there's underlying momentum that could challenge it if certain conditions are met.
The immediate support level at $65,949 is paramount. A failure to hold this level, especially with increasing volume, could signal the start of a more significant correction. The 1H chart's negative MACD momentum and the Stochastic oscillator pointing downwards reinforce this bearish possibility. If $65,949 breaks, the next support to watch is $65,398.33 on the 4H chart. A decisive move below this could open the door for a sharper decline, potentially targeting the daily support at $63,540.67. This scenario would likely be exacerbated by a reversal in broader market sentiment, perhaps a resurgence in DXY strength or a significant downturn in the SP500, which is currently showing mixed signals across timeframes.
Geopolitical events can also inject sudden volatility. While recent news suggests a de-escalation in US-Iran tensions, which typically fuels risk-on assets, any renewed flare-up could quickly shift sentiment. Similarly, unexpected inflation data or hawkish commentary from the Federal Reserve could spook markets, leading to a flight from riskier assets like Bitcoin. The correlation between BTCUSD and tech stocks like Nasdaq, currently at 30467.83 and showing a strong 1H uptrend despite some overbought Stochastic signals, means that a significant drop in equities could drag Bitcoin down with it. Traders must remain vigilant for these macro shifts, as they can override purely technical setups.
The Waiting Game: Consolidation and Range-Bound Action
Factors Keeping BTCUSD Sideways
A neutral scenario, where BTCUSD trades within a defined range, is also a distinct possibility, particularly if conflicting signals from different timeframes fail to resolve decisively. The 1H chart presents a tug-of-war: upward RSI momentum versus negative MACD. The 4H chart shows bullish MACD but overbought Stochastic. The daily chart shows a strong downtrend (ADX 42.46) but a positive MACD. This conflicting technical picture often leads to choppy, range-bound price action as the market struggles to find a clear direction.
In such a scenario, BTCUSD might oscillate between the immediate support at $65,949 and resistance at $66,624. Volume would likely remain subdued, indicating a lack of conviction from market participants. This phase can be frustrating for traders looking for clear trends, but it also presents opportunities for range-bound strategies, such as buying near support and selling near resistance, provided risk management is strictly applied. The key here is patience; waiting for a clear breakout or breakdown from this range is often more prudent than trying to anticipate the move.
The absence of strong fundamental catalysts can also contribute to consolidation. If there are no major economic data releases, central bank announcements, or significant geopolitical shifts, the market may simply digest recent price action. The current price around $66,350.00 could become a pivot point, with price action consolidating around it until a new narrative emerges. Traders should watch for decreasing ADX values across multiple timeframes, which would indicate a weakening trend and a higher probability of range-bound behavior. Until a decisive catalyst appears, maintaining a neutral stance and waiting for a clear break from the current range would be a sensible approach.
Bearish Breakdown: When Support Crumbles
60% ProbabilityRange-Bound Grind: The Waiting Game
25% ProbabilityBullish Breakout: The Path to Higher Ground
15% ProbabilityWhat I'm Watching This Week
The current technical setup for BTCUSD is a complex interplay of conflicting signals across different timeframes. The daily chart suggests a strong downtrend bias (ADX 42.46), yet the 1-hour and 4-hour charts show upward momentum (RSI 56.08 and 66.05 respectively). This divergence suggests that the market is at a critical decision point. The primary scenario leaning towards a bearish breakdown hinges on the hold of immediate support levels, particularly the $65,949 mark. A failure here, coupled with broader market risk aversion or renewed USD strength, could accelerate losses.
Conversely, a bullish outcome requires a decisive break above the $66,624 resistance, ideally with increasing volume and positive MACD confirmation on the 1H chart. Without this, any upward move might be short-lived, leading to range-bound action. The high probability assigned to the bearish scenario (60%) reflects the dominant downtrend signal on the daily timeframe and the overbought conditions appearing on the 4H Stochastic oscillator. However, the market's ability to show resilience around key support levels cannot be ignored.
The geopolitical landscape, particularly the de-escalation in US-Iran tensions, has injected a risk-on element into markets, which is generally positive for assets like Bitcoin. However, this sentiment can quickly reverse. The strength of the Dollar Index (DXY), currently at 99.73 and showing mixed signals, will be a key barometer. A DXY rally could easily dampen enthusiasm for BTCUSD. Ultimately, the price action around the $65,949 support and $66,624 resistance levels in the coming days will be the most telling factor. Patience and strict risk management are crucial as we await a clearer directional signal.
| Indicator | Value | Signal | Interpretation |
|---|---|---|---|
| RSI (14) | 56.08 | Neutral | Upward momentum, but below 70 suggests caution. |
| MACD Histogram | -0.04 | Bearish | Negative momentum on 1H, suggesting weakening upside. |
| Stochastic (%K/%D) | 82.91 / 85.11 | Bearish | Overbought territory on 4H, indicating potential reversal. |
| ADX | 33.17 | Bullish | Strong trend indicated on 1H, but needs confirmation. |
| Bollinger Bands | Middle Band | Watch | Price hovering around middle band on 1H, needs clear break. |
Frequently Asked Questions: BTCUSD Analysis
What happens if BTCUSD breaks below the $65,949 support level?
A break below $65,949, especially with confirmation on the daily chart, would invalidate the immediate bullish outlook. This could trigger a sell-off targeting the next support at $65,398.33, with a potential extension towards $63,540.67 if momentum accelerates.
Should I buy BTCUSD at current levels near $66,350 given the mixed signals?
Buying at current levels carries significant risk due to conflicting signals across timeframes. A more prudent approach would be to wait for a confirmed break above $66,624 with positive MACD confirmation on the 1H chart, or a clear bounce from the $65,949 support. A high-probability setup requires patience.
Is the RSI at 56.08 a bullish signal for BTCUSD right now?
An RSI of 56.08 on the 1H chart indicates positive momentum but is not yet in overbought territory. While it supports the idea of upward pressure, it needs to be considered alongside other indicators like the MACD, which is showing negative momentum on the same timeframe, suggesting the current strength might be temporary.
How might the DXY strength at 99.73 affect BTCUSD this week?
A strengthening DXY typically exerts downward pressure on risk assets like BTCUSD. While the DXY is currently showing mixed signals, any sustained rally could dampen sentiment for Bitcoin. Conversely, a weakening DXY would likely provide a tailwind for potential upside in BTCUSD.
Track markets in real-time
AI-powered analysis, technical indicators and real-time price data.
Join Our Telegram Channel
Breaking market news, AI analysis and trading signals instantly.
Join Channel