The cryptocurrency market, a perpetual dance between innovation and volatility, finds its kingpin, Bitcoin (BTCUSD), currently navigating a critical juncture around the $65,903 mark. This price point isn't just a number; it represents a battleground where short-term traders eye potential pullbacks and long-term holders assess the underlying strength of the market cycle. Recent price action, while showing resilience above key support levels, is being shadowed by conflicting technical indicators and a broader macroeconomic landscape that refuses to offer clear direction. The question on every trader's mind is whether the current consolidation around $65,903 is a prelude to a renewed bullish surge or a temporary pause before a more significant correction.
- Bitcoin's RSI at 48.56 indicates neutral momentum with a slight bearish lean, suggesting caution.
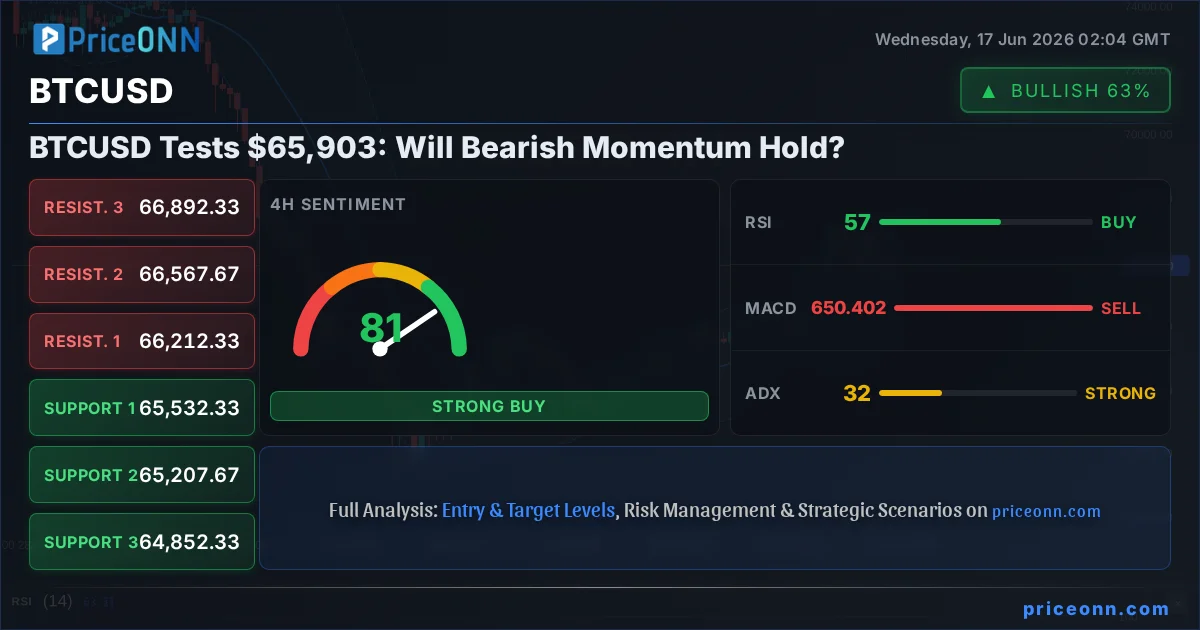
- Critical support for BTCUSD is holding around $65,363, tested during recent price swings.
- The MACD histogram shows negative momentum, hinting at potential downward pressure.
- Correlation with the DXY, currently at 99.57, suggests that dollar strength could weigh on Bitcoin.
The crypto ecosystem, ever-evolving, is currently in a phase where macro narratives are increasingly influencing digital asset prices. While Bitcoin has historically prided itself on its decoupling from traditional markets, the growing institutional adoption and the integration of crypto into global financial products mean that events like a hawkish Federal Reserve stance or geopolitical tensions now carry tangible weight. The recent news of a tentative U.S.-Iran interim agreement, while primarily impacting oil prices and triggering a risk-on sentiment in equities like the Nasdaq and Dow Jones, also creates ripples across all asset classes. For Bitcoin, this might translate into a complex interplay of factors: a potential flight to riskier assets could theoretically boost BTC, but a strengthening dollar, often a byproduct of global uncertainty or Fed tightening, can act as a headwind. Understanding these correlations is paramount for navigating the current choppy waters around $65,903.
From a technical standpoint, the 1-hour chart for BTCUSD paints a picture of indecision. The price hovers near the $65,903 mark, caught between the immediate resistance at $65,983 and support at $65,917. The RSI(14) at 48.56, while not deeply oversold, leans towards a bearish inclination, suggesting that upward momentum is not yet robust enough to force a significant breakout. This reading is further corroborated by the MACD, which is displaying negative momentum with the MACD line below its signal line. This technical setup on shorter timeframes suggests that any immediate upward push might face selling pressure, potentially leading to further consolidation or a retest of lower levels. The ADX at 16.74 reinforces this sentiment, indicating a weak trend and a market that is not yet committed to a clear direction, leaving room for volatility in either direction.
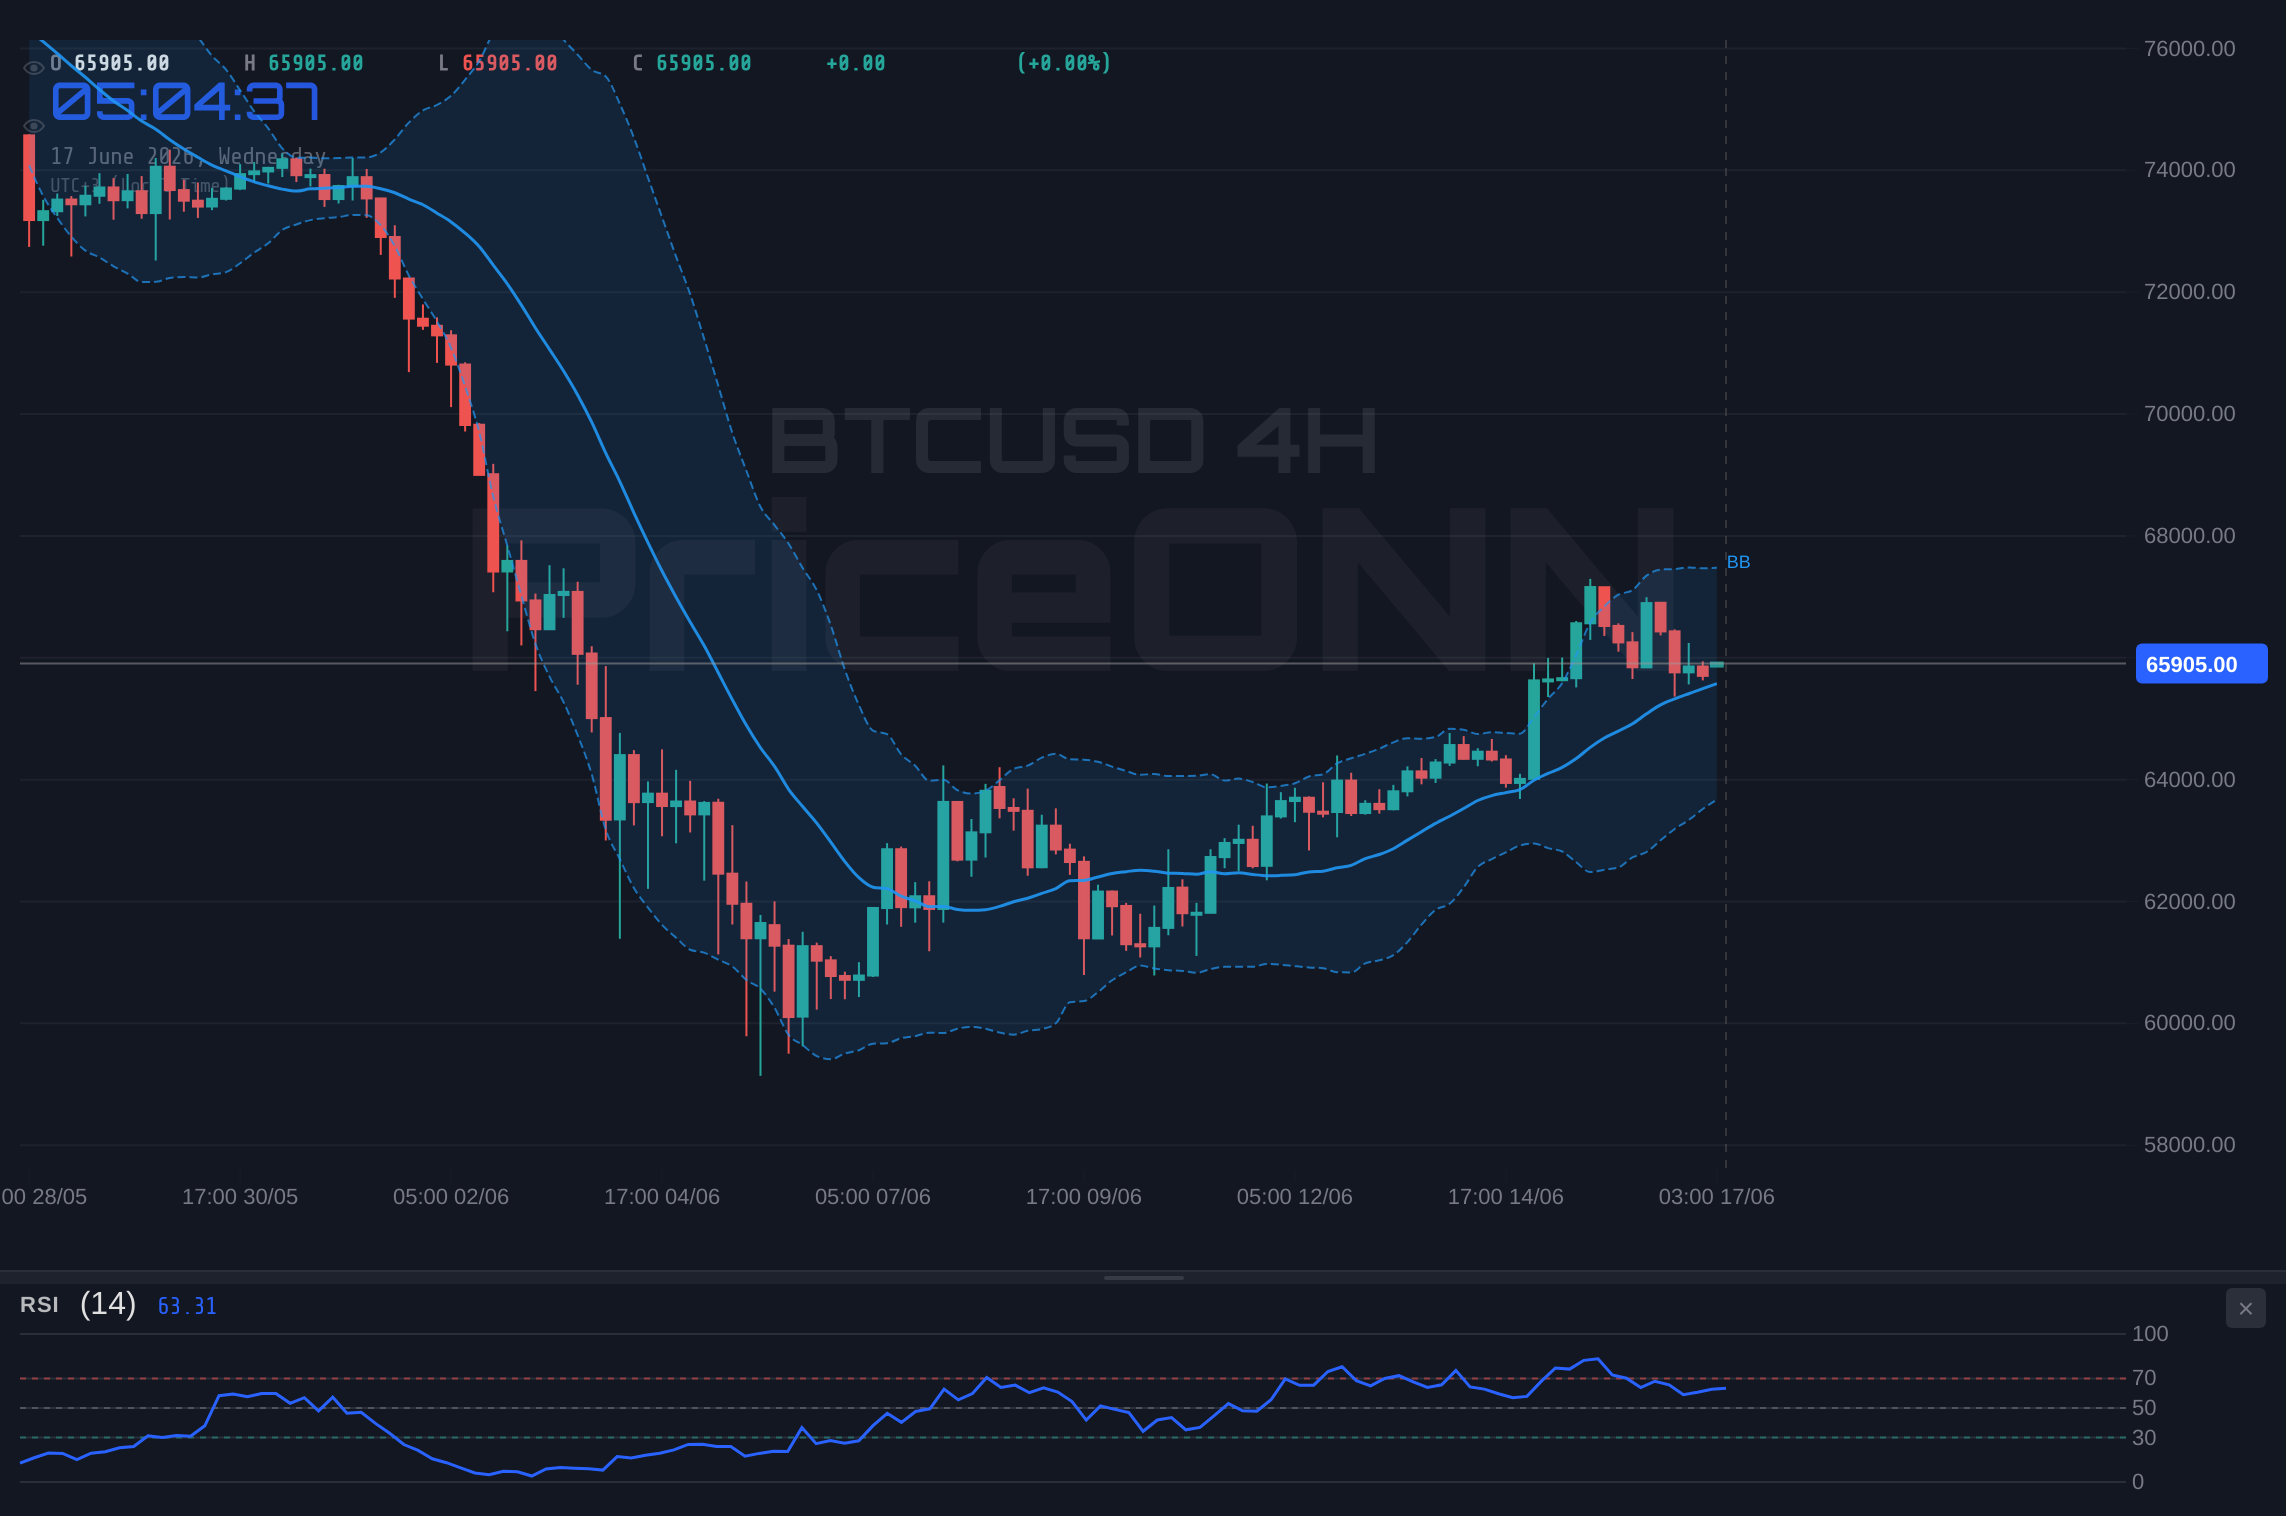
However, looking at the 4-hour timeframe offers a slightly more optimistic, albeit still cautious, perspective. The trend is officially neutral (50% strength), but the indicators here lean more towards a potential 'buy' signal (6 buy, 2 sell). The RSI at 56.55 is in the neutral zone, showing a slight upward bias, and importantly, the MACD is showing positive momentum with the MACD line above its signal line. This divergence between the 1-hour and 4-hour charts highlights the choppiness of the current market. While short-term traders might be wary of immediate downside due to the 1-hour signals, the slightly longer timeframe suggests that underlying buying interest could be building. This is a classic scenario where patience is key; waiting for confirmation on the shorter timeframe, or for a decisive move on the 4-hour chart, becomes crucial.
The daily chart, however, presents a more challenging picture for the bulls, with a neutral trend (50% strength) but a leaning towards 'sell' signals (3 buy, 5 sell). The RSI(14) at 43.2 is in a bearish territory, and the MACD is positive but showing signs of momentum waning. The Bollinger Bands on the daily chart are positioned below the middle band, indicating downward pressure. Yet, the Stochastic indicator is flashing a strong 'buy' signal with %K (84.34) significantly above %D (67.07), suggesting a potential for a short-term bounce or oversold conditions being met. This conflict between the daily RSI and the daily Stochastic is a common occurrence in choppy markets. It suggests that while the overall trend might be wavering, there's potential for tactical bounces. The ADX at 40.43, however, points to a strong downtrend, which complicates the bullish interpretation of the Stochastic. This suggests that any upward moves might be met with significant selling pressure from a stronger, established downtrend.
Delving deeper into the crypto-specific fundamentals, the on-chain metrics provide a nuanced view. Active addresses have seen some fluctuations, indicating retail interest is present but not yet at fever pitch levels seen in prior bull runs. Whale movements, those large holders of Bitcoin, have been relatively subdued, suggesting they are either accumulating cautiously or holding their positions, unwilling to make aggressive moves at these price levels. Exchange flows show a net neutral to slightly positive outflow, which is generally a healthy sign, indicating that fewer coins are moving onto exchanges for immediate sale. However, the lack of a significant accumulation or distribution trend from these large players at $65,903 means that the market is lacking a strong directional conviction from the whales, contributing to the current sideways price action.
The broader crypto ecosystem, beyond just Bitcoin, is also showing mixed signals. While some altcoins are attempting to recover, their movements are largely dictated by Bitcoin's price action. The dominance of BTCUSD, while not explicitly provided in the data, is a crucial factor to watch. If Bitcoin dominance is rising, it suggests that capital is flowing into BTCUSD at the expense of altcoins, reinforcing its position as the market leader. Conversely, a falling dominance could signal a potential altcoin season, where smaller cap coins experience disproportionate gains. Currently, the lack of a clear directional move in BTCUSD makes it difficult to ascertain this dominance trend, leaving altcoin investors in a state of cautious observation.
Institutional adoption, a key driver of the current market cycle, continues to be a narrative worth following. The performance of Bitcoin ETFs, for instance, provides a real-time glimpse into institutional demand. While specific ETF flows are not in the provided data, general sentiment suggests that institutional interest remains, albeit perhaps with more tactical and less euphoric inflows compared to the initial post-ETF launch frenzy. Regulatory news also plays a pivotal role. Any significant developments regarding crypto regulation in major economies like the US or EU can quickly shift market sentiment. For now, the regulatory landscape remains a complex patchwork, with ongoing discussions in various jurisdictions. The recent tentative U.S.-Iran agreement has no direct link to crypto regulation, but it does contribute to the broader risk sentiment that indirectly influences investment decisions in digital assets.
Considering the correlation with traditional markets, the DXY (Dollar Index) currently at 99.57 is a significant factor. A rising dollar typically exerts downward pressure on gold (XAUUSD), which is currently trading at $4,342.10, and can also weigh on risk assets like Bitcoin. The fact that the DXY is showing a slight decline on the 1-hour chart (down 0.11% to 99.57) might offer some reprieve to BTCUSD, but its daily trend is neutral, indicating it's not a strong directional driver yet. Meanwhile, the S&P 500 (SP500) is showing a strong upward trend (6572.87), and the Nasdaq 100 (30112) is also showing a positive signal on the 4-hour chart, despite a bearish 1-hour trend. This mixed picture in equities suggests that risk appetite is not uniformly strong, adding another layer of complexity to Bitcoin's price action around $65,903.
The energy markets, particularly Brent crude at $79.43 and WTI at $76.13, have experienced a significant sell-off, dropping over 5% in the last 24 hours. This dramatic fall, potentially linked to the U.S.-Iran developments and easing geopolitical tensions in the Middle East, has broad economic implications. Lower oil prices can reduce inflationary pressures, which might influence central bank policies, potentially leading to earlier rate cuts. Such a scenario could be bullish for risk assets like Bitcoin. However, the sharp decline in oil also signals a potential slowdown in global demand, which could be a drag on overall economic growth, creating a counteracting bearish effect. The market is currently trying to digest whether the falling oil price is a net positive (lower inflation, potential rate cuts) or negative (slowing global economy).
The current technical signals on BTCUSD present a classic 'watch zone' scenario rather than a clear trade setup. On the 1-hour chart, the bearish momentum and RSI below 50 suggest caution. However, the 4-hour chart's positive MACD and Stochastic signals hint at potential underlying strength. The daily chart is even more conflicted, with a bearish RSI but a bullish Stochastic. This divergence across timeframes means that any aggressive directional bet at $65,903 would be premature. A clear trade setup would likely emerge from a decisive break above a key resistance level or a confirmed failure to hold a critical support level. Until then, patience and risk management are paramount.
Therefore, the immediate focus for BTCUSD traders should be on the $65,363 support level and the $65,983 resistance level. A sustained close above $65,983 on higher volume could invalidate the short-term bearish signals and open the door for a move towards the next resistance at $66,567. Conversely, a decisive break and close below $65,363 would likely trigger further downside, potentially testing the $64,852 support. The ADX readings across timeframes, particularly the strong 40.43 on the daily chart, indicate that if a breakout occurs, it could be accompanied by significant momentum, making the direction of that breakout crucial.
The mixed signals across different timeframes and indicators highlight the current uncertainty in the Bitcoin market. While the 4-hour chart offers some bullish glimmers, the daily chart's bearish lean and the 1-hour chart's immediate caution cannot be ignored. The interplay between macro factors like the DXY and equity markets, coupled with crypto-specific on-chain data, creates a complex tapestry. For now, BTCUSD at $65,903 is a market in flux, demanding a disciplined approach from traders. The absence of a clear, confluent signal across all timeframes means that waiting for higher probability setups is the prudent strategy.
Looking ahead, the market will be keenly watching for any further developments in the U.S.-Iran situation and its impact on oil prices and global risk sentiment. Additionally, any shifts in central bank rhetoric or economic data releases, particularly concerning inflation and employment, could provide the catalyst needed to break Bitcoin out of its current range. The technical picture, while currently conflicted, will likely offer clearer signals once price action decisively breaks through either the immediate support or resistance levels. Until then, it's a waiting game, where observing price action at key levels and managing risk remain the most critical components of any strategy.
The current price action around $65,903 for BTCUSD represents a critical inflection point. While shorter-term indicators show some bearish pressure, longer timeframes and certain oscillators hint at potential resilience. The confluence of macro factors, including the dollar's movement and equity market sentiment, adds another layer of complexity. Traders should remain vigilant, prioritizing risk management and waiting for clear confirmation before committing to significant positions. The market is presenting a complex puzzle, and only through careful analysis and patience can one hope to solve it.
The scenario cards below outline potential paths forward, emphasizing the levels to watch and the conditions that would validate each outlook. Remember, in these choppy market conditions, managing risk and waiting for high-probability setups are paramount. The market always provides opportunities, but they often require patience and discipline to capture.
Bearish Consolidation
65% ProbabilityRange-Bound Volatility
25% ProbabilityBullish Breakout Attempt
10% ProbabilityFrequently Asked Questions: BTCUSD Analysis
What happens if BTCUSD breaks below the $65,363 support level?
A close below $65,363 on the 1-hour chart would invalidate short-term bullish hopes and likely trigger a move towards the $64,852 support. This scenario is given a 65% probability due to current bearish momentum signals.
Is the current RSI reading of 48.56 a sell signal for BTCUSD at $65,903?
An RSI of 48.56 on the 1-hour chart leans bearish, suggesting upward momentum is weak. While not a direct sell signal on its own, it indicates caution is warranted, and a break below immediate support at $65,917 would strengthen this bearish outlook.
How is the DXY's current level of 99.57 impacting BTCUSD around $65,903?
The DXY at 99.57, showing a slight dip on shorter timeframes but a neutral daily trend, presents a mixed picture. Historically, a stronger dollar can pressure Bitcoin, but with the DXY not exhibiting strong directional conviction, its immediate impact around $65,903 is currently limited, though it remains a key factor to monitor.
Should traders consider buying BTCUSD if it holds above $65,363 support, given the mixed signals?
Buying at $65,363 would be a tactical play, with a potential target near $65,983. However, this strategy carries risk due to bearish 1-hour signals and daily RSI. Invalidation would occur on a close below $65,363, making risk management crucial for such a trade.
Track markets in real-time
AI-powered analysis, technical indicators and real-time price data.
Join Our Telegram Channel
Breaking market news, AI analysis and trading signals instantly.
Join Channel