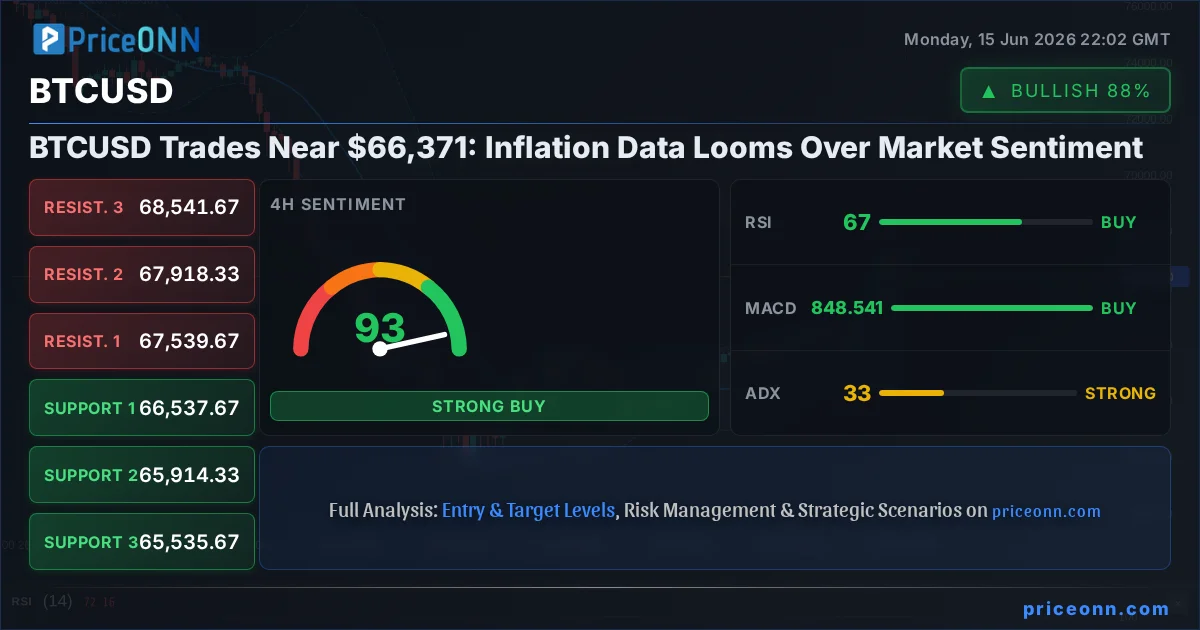
The cryptocurrency market is holding its breath as Bitcoin (BTCUSD) consolidates near the critical $66,371 level. This week, all eyes are on the upcoming inflation data, which promises to be a major catalyst for potential price action. While the 1-hour and 4-hour technicals offer some bullish undertones, the daily chart paints a more cautious picture, highlighting the prevailing uncertainty and the need for traders to tread carefully. The interplay between macro-economic indicators and Bitcoin's price action is more pronounced than ever, making this a pivotal moment for market participants.
- RSI at 57.29 on the 1H chart signals neutral territory with a slight upward bias, but the 1D RSI at 44.44 indicates waning momentum.
- Critical support for BTCUSD sits at $63,540.67, tested on the daily timeframe, while resistance looms around $66,640.33 on the 1H chart.
- MACD histogram on the 1H chart shows negative momentum, suggesting short-term selling pressure, contrasting with the 4H positive momentum.
- The correlation with DXY, currently at 99.71, is a key factor, with dollar strength often exerting downward pressure on Bitcoin.
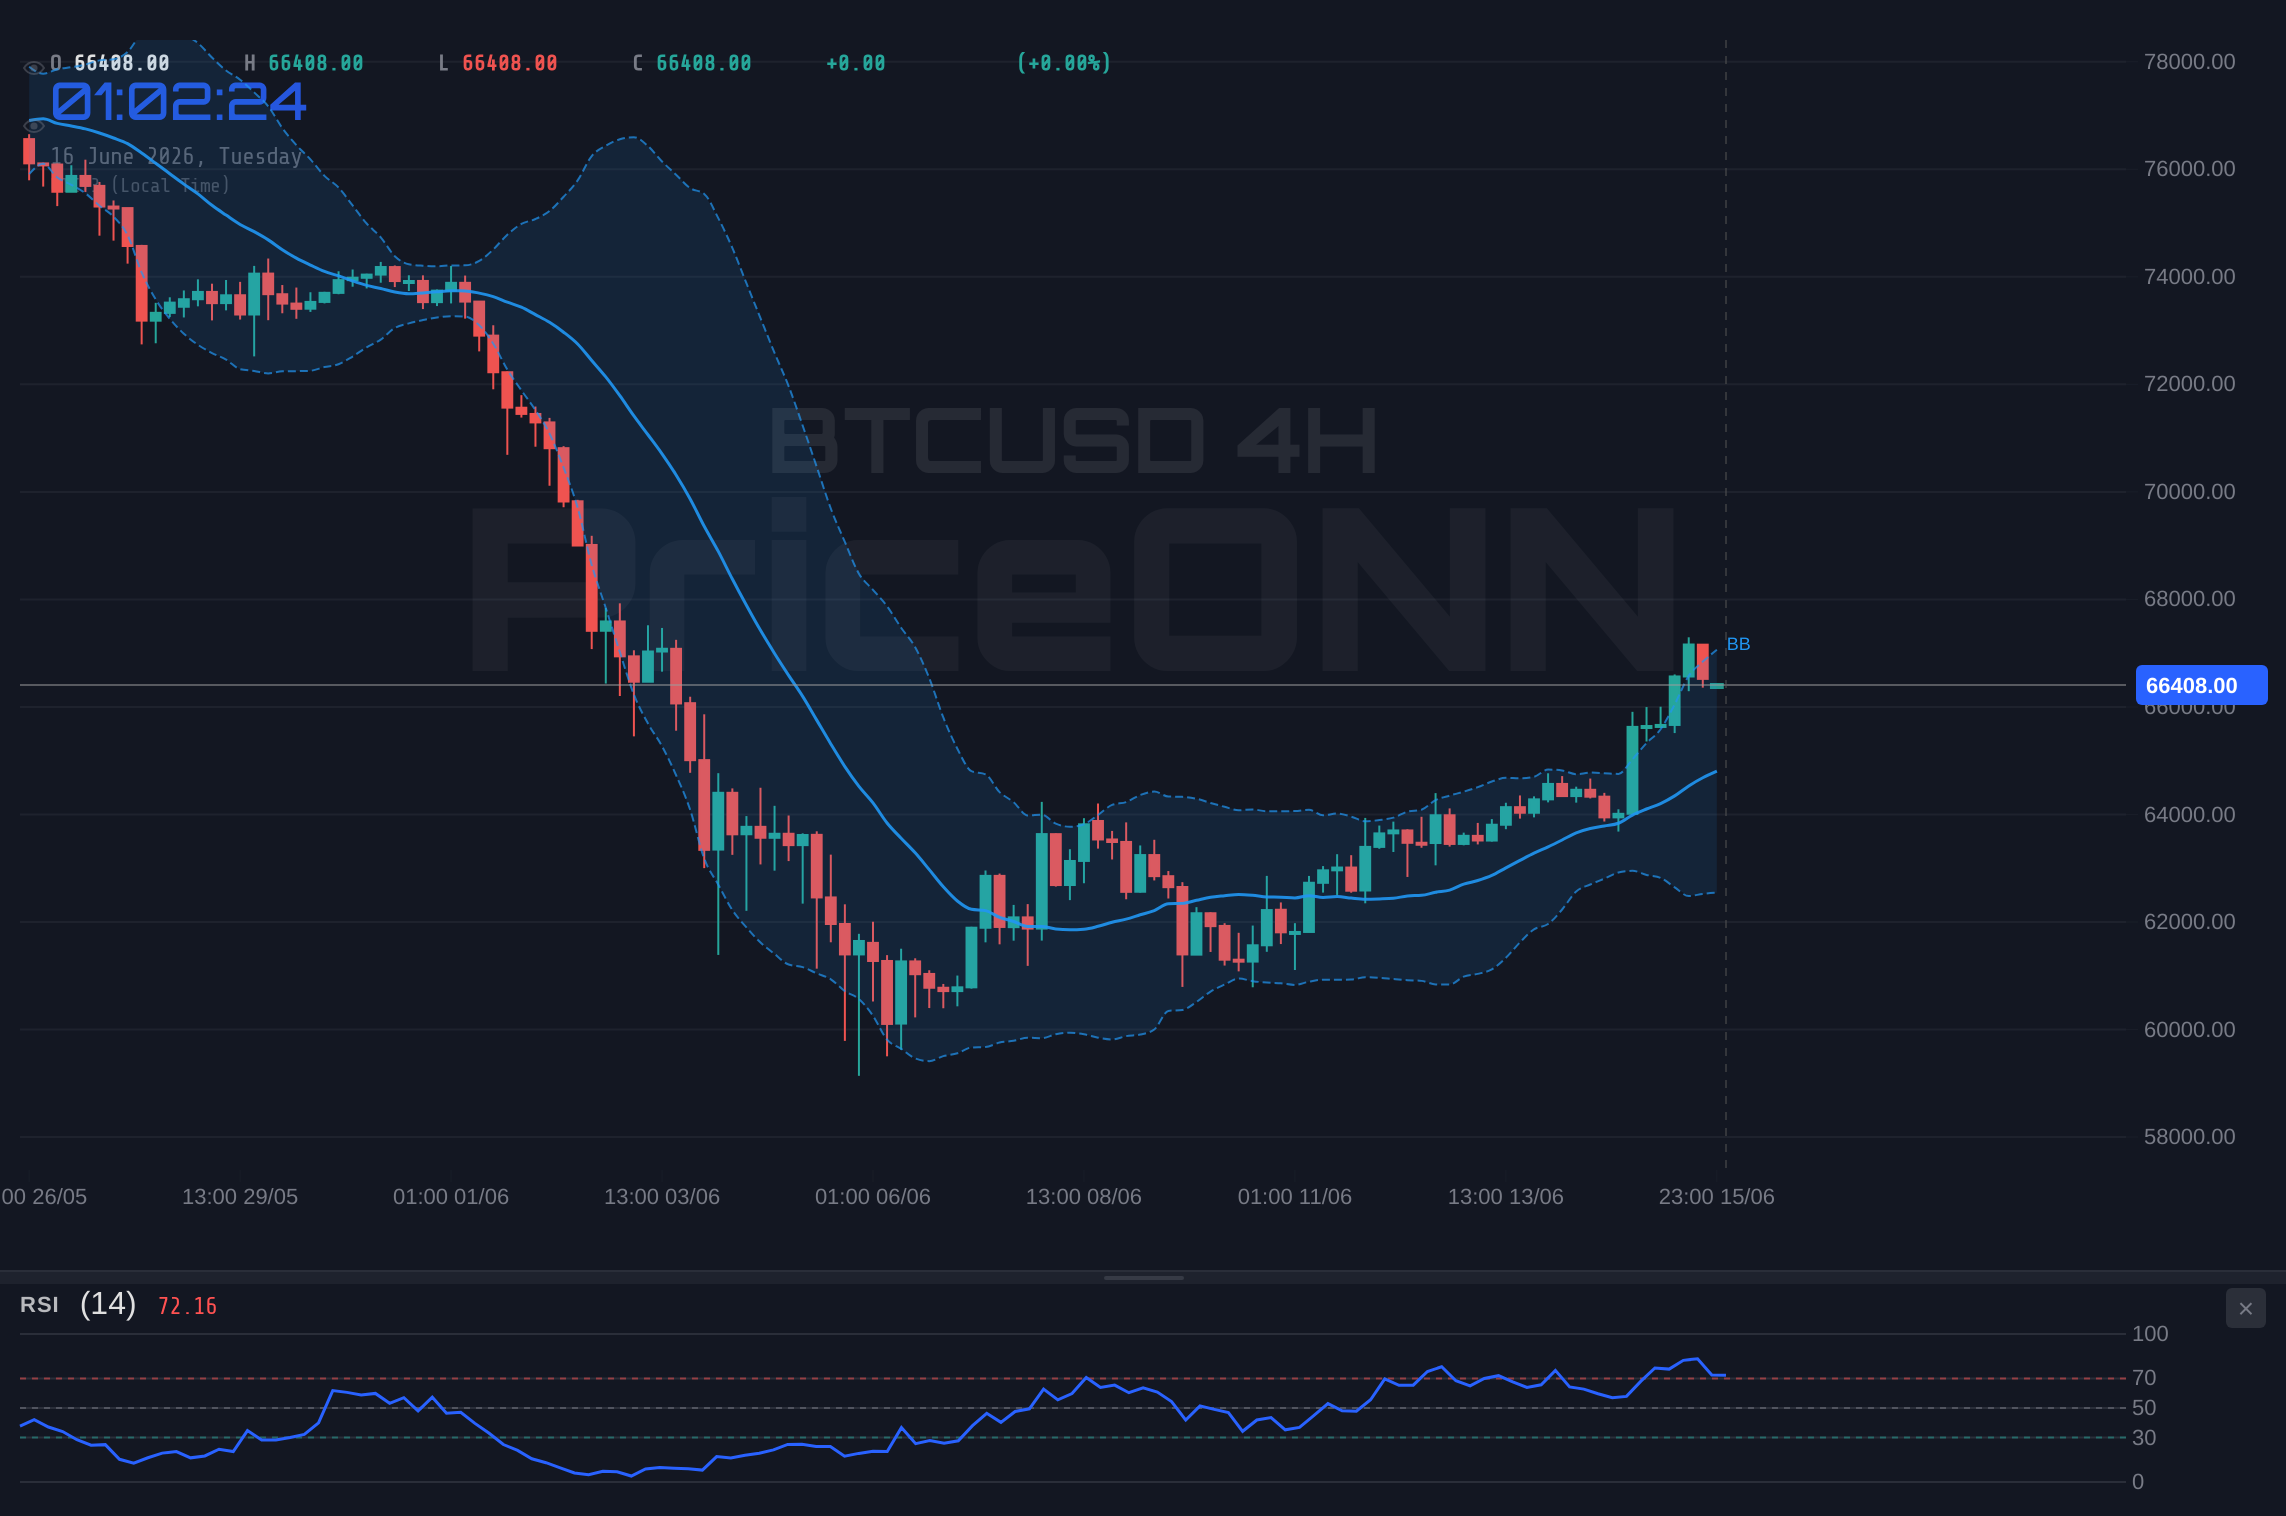
The current market environment for Bitcoin is a complex tapestry woven from technical signals, macroeconomic undercurrents, and the ever-present specter of inflation data. Trading around $66,371, BTCUSD finds itself at a crucial juncture. The 4-hour chart suggests a bullish trend with a strength of 97%, supported by a generally positive MACD momentum and a Stochastic indicator in the overbought region ($K=89.82, D=79.57$). This signals potential for further upside, with resistance levels identified at $67,539.67, $67,918.33, and $68,541.67. However, the daily chart presents a starkly different narrative. With a trend strength of 50% and a bearish signal overall, the RSI at 44.44 indicates a downward tendency, and the MACD is showing positive momentum but remains below the signal line. This divergence across timeframes is precisely what makes the current price action so compelling and treacherous for traders attempting to navigate it.
The Tug-of-War: Daily Bears vs. Short-Term Bulls
On the daily chart, the ADX reading of 42.46 signifies a strong downtrend, which directly contradicts the short-term bullish signals. This suggests that while there might be temporary bounces or rallies, the overarching trend on the daily timeframe is still under pressure. The support levels on the daily chart are significantly lower, at $63,540.67, $63,069.33, and $63,456.67, indicating substantial downside risk if the bearish sentiment takes hold. The Bollinger Bands on the daily chart are below the middle band, reinforcing the bearish outlook. This technical conflict between timeframes is the core of the current market dilemma. It’s a classic battle between short-term traders looking to capture minor moves and longer-term investors who are assessing the broader trend and potential for a more significant downturn or a confirmed reversal.
Navigating the Conflicting Signals
The 1-hour chart, while showing a neutral overall signal, presents some interesting dynamics. The RSI at 57.29 is in neutral territory but trending upwards, suggesting some underlying buying interest. However, the MACD histogram is in negative territory, with the MACD line below the signal line, indicating short-term selling pressure. This creates a real-time conflict: do you trust the slightly bullish RSI and the 4-hour trend, or do you heed the daily bearish signals and the 1-hour negative MACD momentum? The ADX at 41.92 on the 1H chart points to a strong uptrend, yet the daily ADX is also strong but in the opposite direction. This ambiguity means that any move is likely to be met with significant counter-trend trading, increasing volatility and the risk of whipsaws. For scalpers, this environment might offer opportunities, but for swing traders, patience and waiting for clearer signals are paramount. The current price of $66,371 is a battleground where these opposing forces are clashing.
Macroeconomic Headwinds: Inflation Data on the Horizon
The immediate future of BTCUSD is intrinsically linked to the upcoming inflation data. In a market increasingly sensitive to monetary policy, any indication that inflation remains stubborn or re-accelerates could prompt a hawkish response from central banks, particularly the Federal Reserve. This would likely translate into higher interest rates or a delayed easing cycle, both of which are generally bearish for risk assets like Bitcoin. The DXY (Dollar Index) is currently trading at 99.71 and showing a strong upward move on the 1-hour chart, with its daily chart also signaling a bullish trend. Historically, a strengthening dollar often correlates inversely with Bitcoin's price, as it increases the cost of dollar-denominated assets for holders of other currencies and signals a preference for safer assets. The recent news about a potential US-Iran interim agreement easing tensions in the Strait of Hormuz, while positive for oil prices (Brent is at $84.42, WTI at $81.41, both showing significant daily drops), could paradoxically increase risk appetite, potentially benefiting riskier assets like BTCUSD if it leads to a broader market 'risk-on' sentiment. However, the dominant factor remains inflation.
The Fed's Dilemma and Bitcoin's Reaction
The Federal Reserve is in a delicate balancing act. They need to combat inflation without triggering a recession. If the upcoming inflation figures, expected in the next 7 days, come in hotter than anticipated, the market will likely price in a higher probability of continued restrictive monetary policy. This could lead to a sell-off across risk assets, including Bitcoin. Conversely, softer inflation prints could fuel hopes of an imminent rate cut, potentially igniting a rally. The CME FedWatch tool, though not provided here, would be crucial in assessing market expectations for future Fed actions. Given the current DXY strength and the mixed signals from major indices like the SP500 (at 6572.87, showing a bullish 1H and 4H trend but a bearish daily trend) and Nasdaq100 (at 30510.2, strong daily bullish trend), the market is clearly on edge. Any deviation from expected inflation outcomes could trigger significant volatility.
On-Chain Metrics: A Mixed Bag of Signals
Beyond price action and macro drivers, on-chain data provides another layer of analysis for BTCUSD. While specific on-chain metrics like hash rate, active addresses, or exchange flows are not provided in the live data feed, general crypto market sentiment can be inferred. The significant 8.53% daily gain for ETHUSD to $1810.34, reaching overbought levels on the 1H RSI (70.37) and 4H RSI (72.55), suggests a broader crypto market recovery is underway, which typically pulls Bitcoin along. However, the daily ETHUSD chart shows a bearish trend. This 'altcoin season' effect, where altcoins rally harder than Bitcoin, can sometimes precede or accompany Bitcoin's own upward movements, but it also carries the risk of a sharp reversal if Bitcoin falters. The presence of large whale movements or significant exchange inflows/outflows would be critical data points to monitor for further clues on institutional conviction or capitulation.
Institutional Adoption and Regulatory Landscape
The long-term outlook for BTCUSD remains heavily influenced by institutional adoption and the evolving regulatory landscape. The recent news regarding the reopening of the Strait of Hormuz, while primarily impacting energy markets, could indirectly boost investor confidence and risk appetite globally. This sentiment shift, if sustained, could encourage more institutional capital to flow into digital assets. However, regulatory uncertainty, particularly in major economies, continues to cast a shadow. Any significant regulatory developments, positive or negative, could trigger sharp price movements. The fact that the crypto market is showing resilience despite broader macro concerns, as evidenced by the strong performance of ETHUSD, suggests an underlying strength, but this is yet to be fully confirmed by Bitcoin's daily chart.
Trading Scenarios and Key Levels to Watch
Bearish Scenario: Downside Pressure Mounts
65% ProbabilityNeutral Scenario: Consolidation Around $66k
25% ProbabilityBullish Scenario: Breakout Towards $67k+
10% ProbabilityThe primary scenario leans bearish, given the daily chart's downtrend and the current $66,371 price point sitting precariously between short-term support and resistance. A decisive close below this level, especially on increased volume, would likely trigger a move towards the first daily support at $63,540.67. Invalidation of this bearish thesis would occur if price can decisively break and hold above the 1-hour resistance at $66,640.33, opening the door for a potential test of higher levels. The neutral scenario anticipates a period of choppy trading around the current price, with buyers and sellers locked in a tight range until a clearer directional signal emerges from the inflation data or a significant technical breakout occurs. The bullish scenario remains a low-probability outcome in the immediate term, requiring a strong catalyst and a decisive break of key daily resistance levels.
What About the Other Assets?
Examining other markets provides crucial context. Gold (XAUUSD) is trading at $4309.35, showing a significant daily increase of 2.35%. The 4-hour chart is bullish, but the daily chart signals a strong downtrend (ADX 34.76). This mixed picture for gold, a traditional safe-haven asset, suggests that while there's buying interest, perhaps driven by inflation concerns or geopolitical hedging, the broader trend is still under pressure. Silver (XAGUSD) at $69.98 also shows a strong daily gain of 3.98%, mirroring gold's short-term strength but facing similar daily downtrend signals (ADX 26.67). In the forex space, EURUSD is at 1.15903, showing a daily rise but with a bearish daily signal. USDJPY, at 160.341, is in a strong daily uptrend, which typically exerts downward pressure on risk assets. The energy markets, Brent at $84.42 and WTI at $81.41, have seen substantial drops, indicating receding inflation expectations or fears of reduced demand, partly due to the news about the Strait of Hormuz. This decline in oil prices could, in theory, reduce inflationary pressures, potentially easing the Fed's hawkish stance, which could be a tailwind for BTCUSD if it materializes.
The equity markets are also showing a mixed performance. SP500 is at 6572.87 with a strong daily uptrend signal despite a bearish daily chart. Nasdaq100, trading at 30510.2, shows a robust daily bullish trend. This dichotomy between the US indices and the daily BTCUSD trend is noteworthy. If the equity markets continue to rally strongly, it could pull Bitcoin higher, overriding some of the bearish daily signals. However, the divergence in Bitcoin's own multi-timeframe analysis suggests that the path of least resistance might still be downwards, at least until key resistance levels are decisively broken or critical support levels fail.
The Road Ahead: What to Watch Next
The immediate focus for BTCUSD traders must remain on the upcoming inflation data. A print that surprises to the upside could trigger a sharp sell-off, testing the daily support levels. Conversely, a softer reading could ignite a rally, pushing Bitcoin towards its 4-hour resistance targets. Beyond inflation, traders should closely monitor the DXY's trajectory and the performance of major equity indices. Any signs of a broadening risk-on sentiment in equities could provide a secondary boost to Bitcoin, even if daily technicals remain subdued. Furthermore, watching for significant on-chain activity, such as large whale accumulations or exchange outflows, could offer clues about institutional conviction. The $66,371 level remains a critical pivot; a sustained failure to hold this area could signal a deeper correction, while a strong reclamation and hold above $66,640.33 would be the first step towards invalidating the bearish outlook.
Frequently Asked Questions: BTCUSD Analysis
What happens if BTCUSD breaks below the $63,540.67 support level?
A break below the $63,540.67 daily support level, especially on high volume, would likely confirm the bearish trend indicated by the daily chart. This could trigger a cascade of selling, potentially leading to further downside towards $63,069.33 and even $62,456.67 as the next support targets are tested.
Should I buy BTCUSD at current levels of $66,371 given the mixed signals?
Buying at $66,371 is a high-risk proposition due to conflicting signals across timeframes. The probability of a bearish scenario (65%) suggests caution. A more prudent approach would be to wait for confirmation: either a decisive break above $66,640.33 resistance for a bullish setup or a clear breakdown below $66,371.00 for a bearish entry.
Is the RSI at 44.44 on the daily chart a sell signal for BTCUSD?
An RSI of 44.44 on the daily chart is in neutral territory but trending downwards, indicating waning bullish momentum and leaning towards a bearish bias. While not an outright sell signal on its own, it supports the notion of potential downside pressure, especially when combined with other daily bearish indicators like the ADX at 42.46.
How will the upcoming inflation data affect BTCUSD this week?
Higher-than-expected inflation data could lead to a hawkish Fed response, strengthening the DXY (currently at 99.71) and potentially causing a sell-off in BTCUSD towards daily support levels. Conversely, softer data might fuel rate cut expectations, boosting risk assets like Bitcoin and pushing it towards 4-hour resistance targets.
Track markets in real-time
AI-powered analysis, technical indicators and real-time price data.
Join Our Telegram Channel
Breaking market news, AI analysis and trading signals instantly.
Join Channel