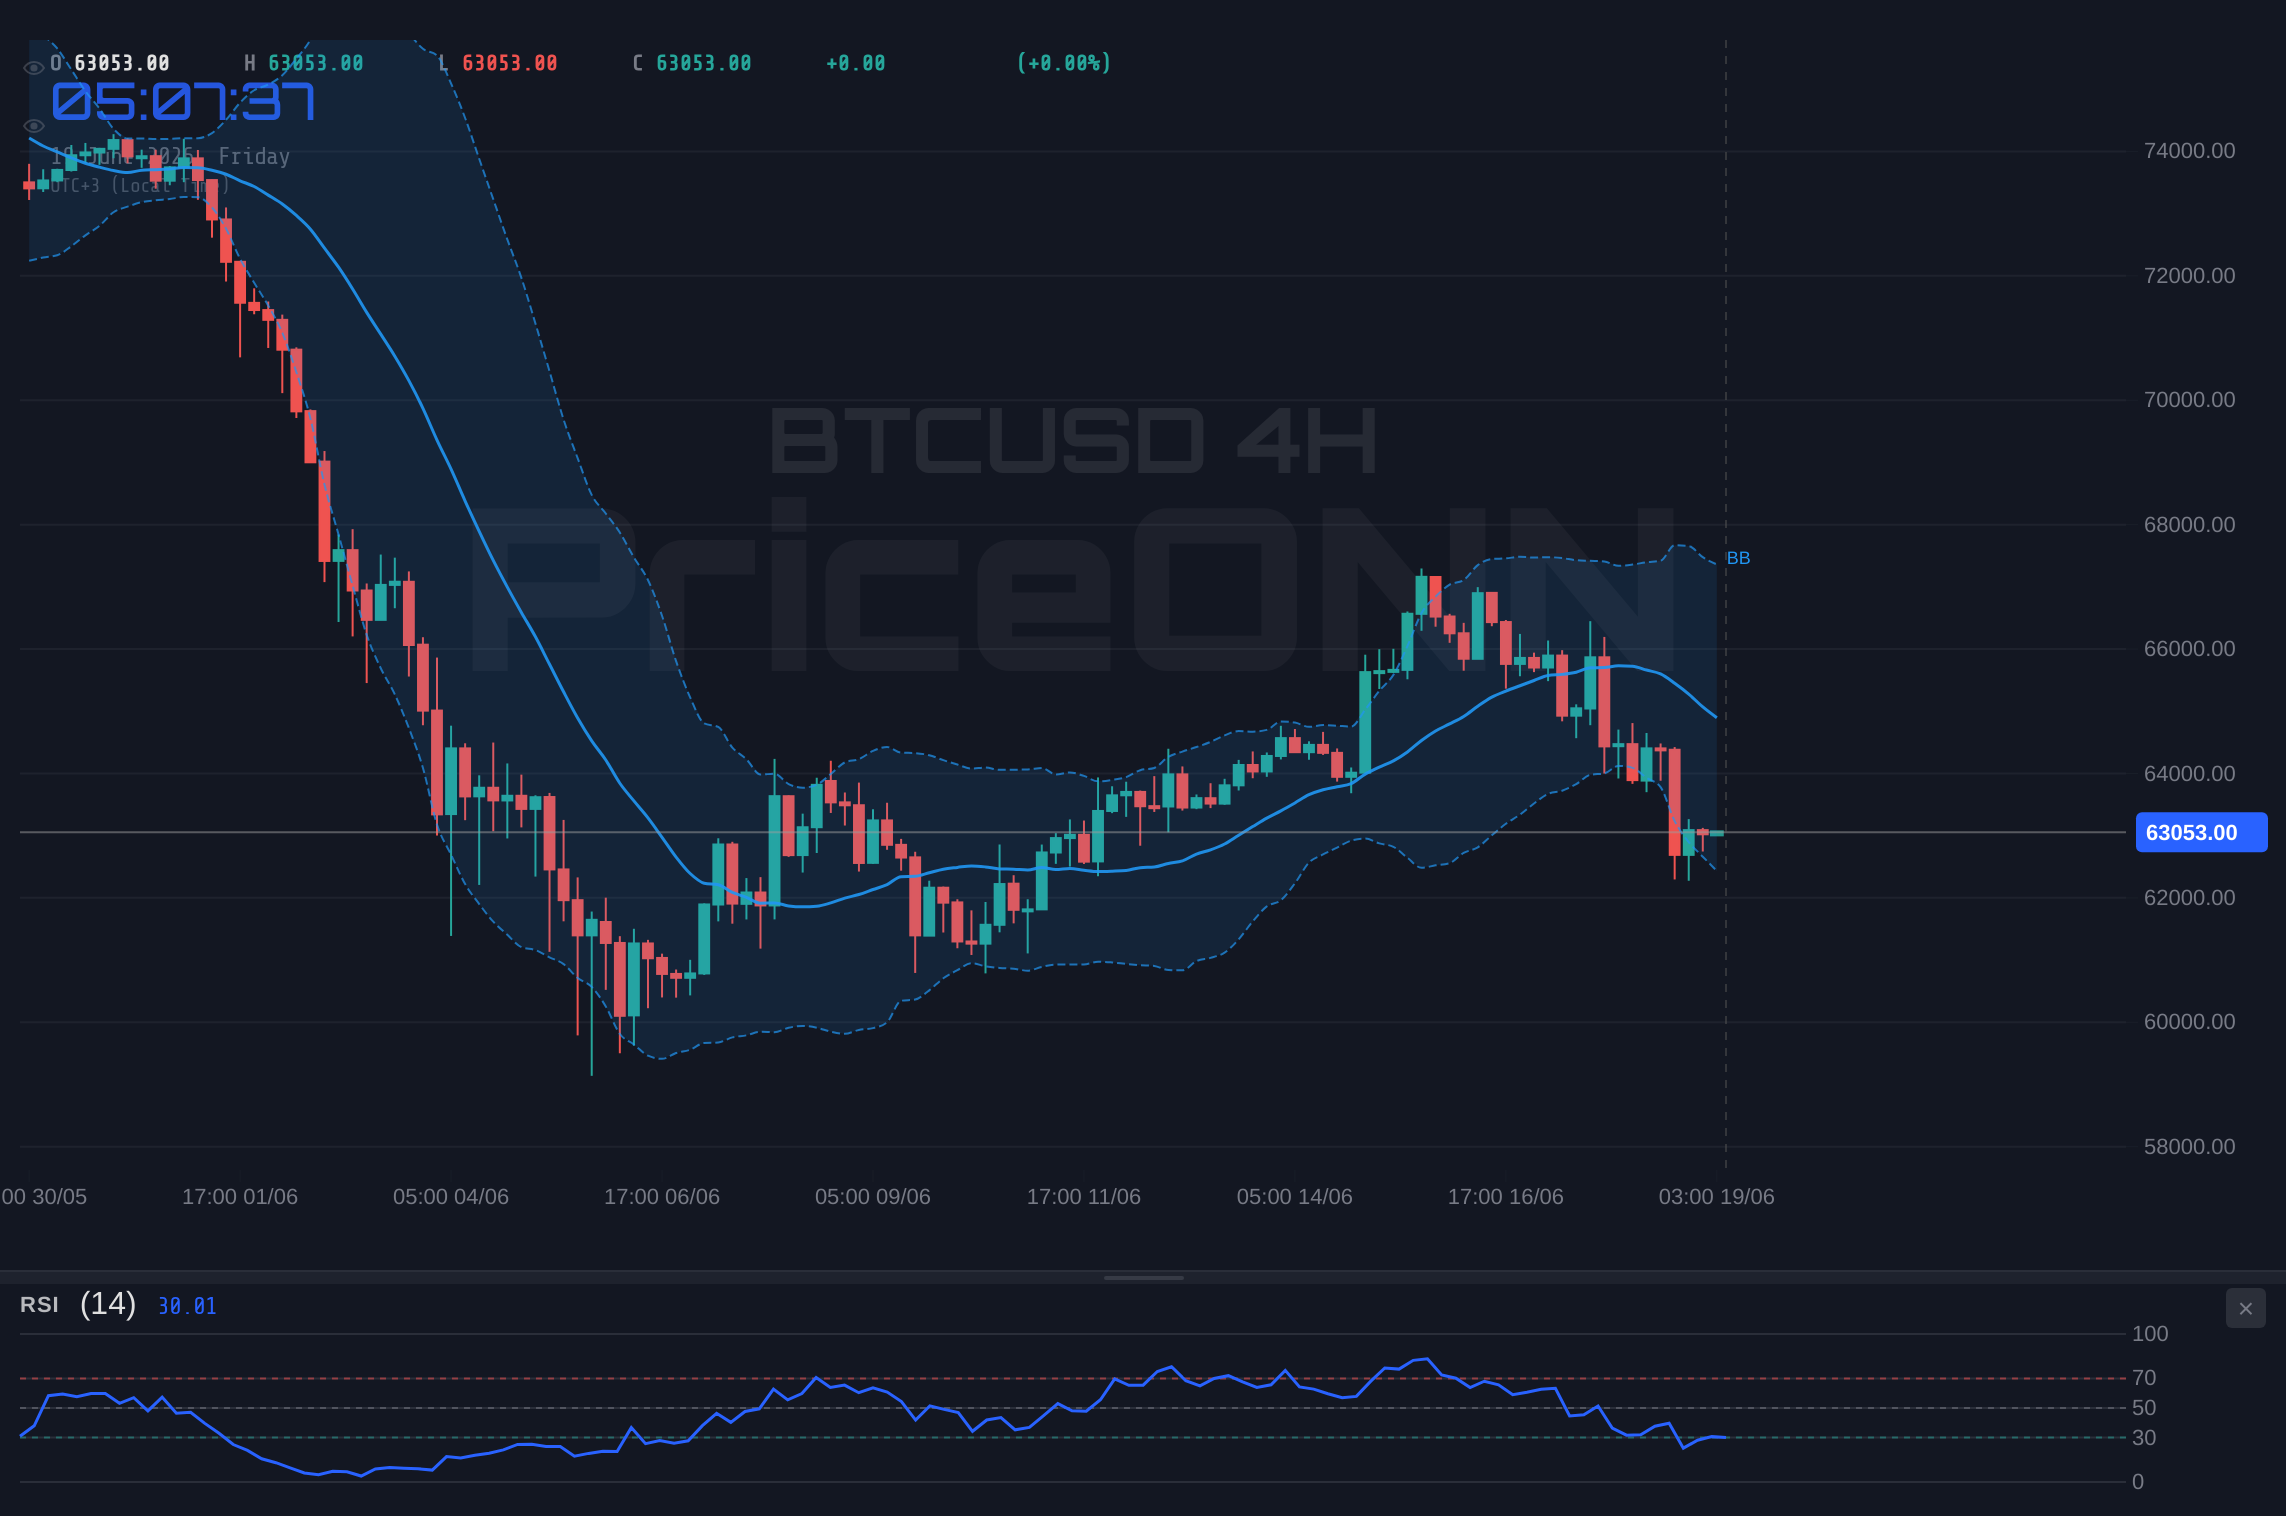
Bitcoin, the flagship cryptocurrency, is currently navigating a critical juncture, trading at precisely $63,087.00. After a significant pullback from recent highs, the digital asset is testing key support levels that traders are watching with intense scrutiny. The Relative Strength Index (RSI) on the 1-hour chart has dipped to 40.52, indicating a cooling-off in momentum but still firmly within bearish territory. This price action occurs against a backdrop of a strengthening US Dollar Index (DXY) and mixed signals from equity markets, creating a complex environment for risk assets like Bitcoin. The question on many traders' minds is whether this current support level will hold, or if further downside is imminent.
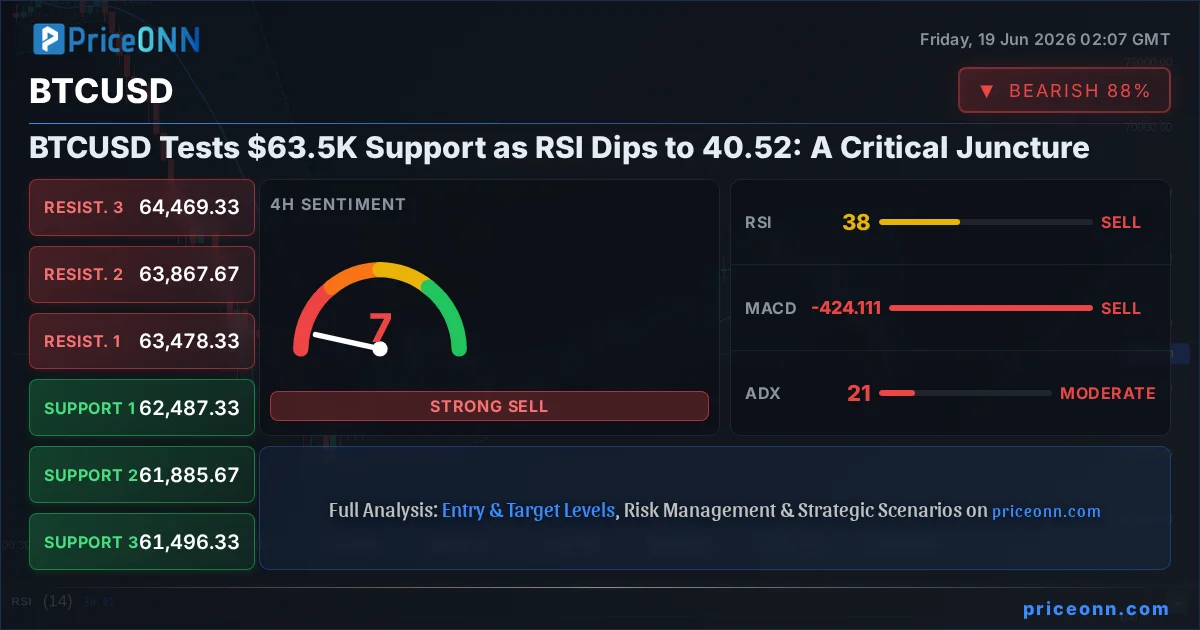
- BTCUSD is trading at $63,087.00, testing support near $63.5K.
- The 1-hour RSI is at 40.52, indicating bearish momentum, while the 4-hour RSI is at 38.56.
- Key support levels to watch are $62,880 and $62,738; resistance is at $63,127 and $63,232.
- A strong DXY at 100.94 is exerting pressure, typical for risk-off sentiment.
The Bull's Roadmap: Reclaiming the $63.5K Threshold
For bulls to regain control, Bitcoin needs to demonstrate resilience around the current price action. The immediate focus is on the $63,127 resistance level on the 1-hour chart. A decisive close above this mark, ideally with increasing volume, would be the first sign of a potential reversal. If this initial hurdle is cleared, the next significant resistance to target would be $63,232, followed by $63,374. Successfully breaching these levels would signal a shift in intraday sentiment, potentially paving the way for a move towards the $64,000 psychological level. However, such a move would require overcoming the broader bearish trend indicated by the daily charts and a more favorable macroeconomic environment, including a pause or reversal in the DXY's ascent.
On the 4-hour timeframe, the picture is less encouraging for immediate upside. The RSI at 38.56 suggests that while oversold conditions are approaching, there isn't strong bullish conviction yet. The MACD is also showing negative momentum, lingering below its signal line, which typically precedes further price declines. For a bullish scenario to gain traction on this timeframe, we would need to see a sustained push above the 4-hour resistance at $63,478.33. This would be a strong indication that the recent selling pressure is abating. The ultimate test would be reclaiming the $64,469.33 level, which would suggest a significant shift in market structure and potentially the beginning of a new upward leg.
The daily chart presents the most significant challenge for the bulls. With the RSI hovering at 36.11, there's considerable room for further downside before touching oversold territory. The MACD is positive but trending downwards, hinting at potential bearish divergence if price continues to fall while MACD stays elevated, though this is not yet confirmed. The ADX at 38.58 indicates a strong downtrend is in play, meaning any rallies might be short-lived corrections within a larger bearish move. For a bullish reversal on the daily chart, Bitcoin would need to not only reclaim the $65,922.33 resistance but also hold it, followed by a decisive break above $67,409.67. This would require a significant catalyst, such as a dovish shift from the Federal Reserve or a major influx of institutional capital.
The Bull's Target: A Path Through Resistance
If Bitcoin manages to consolidate and build strength around the current $63,087.00 level, the path to recovery would involve a methodical approach to the resistance zones. The immediate 1-hour resistance cluster between $63,127 and $63,374 is the first hurdle. A successful break here could see price quickly test the $63,478.33 level on the 4-hour chart. Beyond that, the psychological $64,000 mark looms large, followed by the more substantial resistance at $64,469.33. A sustained move above $65,000 would be a strong bullish signal, suggesting that the recent downtrend might be reversing. The ultimate target for a strong bullish continuation, based on the daily resistance levels, would be the $65,922.33 area. However, this scenario is contingent on overcoming the prevailing negative sentiment and the strong downtrend indicated by multiple timeframes.
Where Bears Take Control: Testing Lower Support Levels
The bearish case for Bitcoin is currently reinforced by multiple technical indicators and the broader market context. On the 1-hour chart, the immediate support lies at $62,880, followed by $62,738. A breach of these levels would signal increasing selling pressure and could quickly lead to a test of the $62,633 support. If this lower support fails, the next significant area to watch would be the 4-hour support zone starting at $62,487.33. The presence of strong downtrend signals across multiple timeframes, including ADX values well above 30, suggests that bears have the upper hand and can push prices lower.
The DXY's current strength at 100.94 is a significant headwind for Bitcoin. Historically, a rising dollar often correlates with a weakening Bitcoin price, as global liquidity tightens and risk assets become less attractive. The fact that the DXY is in a strong uptrend (ADX 52.87 on 1H, 36.71 on 4H) adds to the bearish pressure on BTCUSD. Furthermore, the negative MACD momentum and RSI readings below 40 on most timeframes suggest that there is still ample room for prices to fall before reaching oversold conditions that might attract significant buying interest.
Looking at the daily chart, the bears have their sights set on lower targets. The next major support level is at $62,511.67, followed by a more significant one at $61,024.33. A break below $60,000 would be a major psychological blow and could trigger a cascade of stop-loss orders, potentially accelerating the decline towards the $50,000 range, though this is a more extreme scenario. The strong daily downtrend (ADX 38.58) indicates that bears are in control of the longer-term trend, and any rallies are likely to be met with selling pressure as traders look to exit positions or establish new shorts.
The Bear's Target: Slipping Below $60K
If the selling pressure intensifies, the immediate bearish target is to break the current 1-hour support at $62,880 and subsequently $62,738. A decisive move below these levels could quickly push BTCUSD towards the $62,511.67 mark on the daily chart. The next significant psychological barrier would be $62,000, followed by the more substantial daily support at $61,024.33. A break below this level would confirm a deeper bearish trend and could open the door for a move towards the $50,000s, although that is a more distant target. The ADX readings across multiple timeframes suggest that a strong trend is in place, which favors the bears in the short to medium term, especially if the DXY continues its upward trajectory.
The Waiting Game: Consolidation Between Levels
While strong trends are indicated on most timeframes, there's always a possibility of consolidation, especially if neither the bulls nor the bears can gain decisive control. On the 1-hour chart, this would look like price action oscillating between the immediate support at $62,880 and resistance at $63,127. Such a range-bound environment often occurs when market participants are awaiting clearer signals from macroeconomic data or significant news events. The ADX values, while indicating strong trends in some cases, are not uniformly high across all timeframes, suggesting that the conviction might be wavering.
A neutral scenario would involve BTCUSD failing to break decisively above the $63,127 resistance while also holding above the $62,880 support. This could lead to a period of sideways trading, potentially forming a tight range. The Stochastic indicator on the 1-hour chart showing a crossover ($K=67.15, D=41.96$) hints at potential upward momentum, but this is contradicted by the RSI at 40.52 and the MACD's negative momentum. This divergence suggests a battle between buyers and sellers, leading to choppy price action rather than a clear trend. Such a period could be characterized by lower trading volumes as participants wait for a clearer directional bias.
On the 4-hour chart, consolidation would mean price action remaining between the support at $62,487.33 and resistance at $63,478.33. This broader range offers more room for price swings but still indicates a lack of clear direction. The 1D chart, however, shows a strong downtrend, making a prolonged neutral period less likely unless external factors intervene to stabilize the market. The key factor to watch for a neutral scenario would be the failure of both immediate support and resistance levels to break for an extended period, perhaps 24-48 hours, accompanied by declining volatility and trading volume.
The Range-Bound Tightrope: Navigating Choppy Waters
If BTCUSD enters a consolidation phase, traders would need to adjust their strategies. Scalpers might look for quick trades within the defined range, targeting the immediate support and resistance levels. However, swing and position traders would likely remain on the sidelines, waiting for a clear breakout. The risk in a consolidation phase is the potential for a 'stop hunt' – a sudden move designed to trigger stop-loss orders before the price reverses. Given the strong trend signals on higher timeframes, a breakout from this potential range is more likely than a prolonged period of sideways movement. The critical levels to watch for such a breakout would be the aforementioned $63,127 (resistance) and $62,880 (support).
The Verdict: Probability Favors the Bears, But Watch the DXY
Assessing the current technical landscape, the odds appear to favor the bears in the short to medium term. The daily chart exhibits a strong downtrend with an ADX of 38.58, and the RSI remains well above oversold territory. The 4-hour chart also shows a bearish bias, with the MACD negative and RSI below 40. The 1-hour chart offers a glimmer of hope with some upward momentum signals, but these are insufficient to overcome the broader bearish sentiment. The prevailing macroeconomic condition, highlighted by the strong DXY at 100.94, further supports a risk-off environment where cryptocurrencies often struggle.
Therefore, the most probable scenario is a continuation of the bearish trend, with potential retests of lower support levels. The probability for a bearish outcome, assuming no major catalysts emerge, is estimated at around 65%. This scenario hinges on BTCUSD failing to hold the $62,880 support and subsequently breaking the $62,511.67 level. The neutral scenario, characterized by consolidation between $62,880 and $63,127, has a probability of 25%. This could occur if market participants remain cautious ahead of key economic data or if buying interest emerges at the lower support levels, albeit without enough conviction for a full reversal.
The bullish scenario, requiring a decisive break above immediate resistance and a sustained push higher, is currently the least probable, estimated at 10%. This would necessitate a significant shift in market sentiment, potentially driven by a dovish surprise from the Federal Reserve or a substantial increase in institutional inflows. Until then, any rallies should be viewed with caution, and traders should be prepared for the possibility of further downside. The key factor to monitor will be the DXY's trajectory and any shifts in risk appetite across global markets.
What I'm Watching: Triggers for the Next Move
My focus for the next 24-48 hours will be on a few key triggers. Firstly, the ability of BTCUSD to hold the $62,880 support. A failure here would be a strong bearish signal. Secondly, I'll be watching the DXY's momentum. If it continues to push higher towards 101, it will likely add pressure on Bitcoin. Conversely, a sharp reversal in the DXY could provide a reprieve for BTCUSD. Finally, I'm looking for confirmation on the 1-hour chart: a sustained close above $63,127, coupled with increasing volume, would be the first sign of a potential bullish shift, though confirmation on higher timeframes would still be needed.
Bearish Scenario: The Downward Grind Continues
65% ProbabilityNeutral Scenario: Range-Bound Hesitation
25% ProbabilityBullish Scenario: A Surprise Recovery
10% ProbabilityFrequently Asked Questions: BTCUSD Analysis
What happens if BTCUSD breaks below the $62,880 support level?
If BTCUSD breaks below $62,880, it signals increased selling pressure, potentially leading to a test of the $62,511.67 daily support. This would confirm the bearish trend, especially with the DXY at 100.94 and daily ADX at 38.58.
Should I buy BTCUSD at current levels of $63,087.00 given the RSI at 40.52?
Buying at $63,087.00 is risky as the 1-hour RSI at 40.52 and daily RSI at 36.11 suggest further downside potential. A confirmed bullish signal, such as a close above $63,374 with strong volume, would be needed before considering a buy, with a 10% probability for such a move currently.
Is the RSI at 40.52 a sell signal for BTCUSD right now?
An RSI of 40.52 is not a direct sell signal but indicates bearish momentum is present, reinforcing the downtrend. It suggests that buyers are not yet in control and that further price depreciation is possible before oversold conditions are met.
How will the DXY strength at 100.94 affect BTCUSD this week?
The strong DXY at 100.94 typically exerts downward pressure on risk assets like BTCUSD. If the dollar continues to strengthen, it will likely hinder any potential recovery attempts for Bitcoin and may contribute to further price declines.
Technical Outlook Summary
| Indicator | Value | Signal | Interpretation |
|---|---|---|---|
| RSI (14) | 40.52 | Neutral | Bearish momentum, but not oversold. |
| MACD Histogram | -1348 | Bearish | Negative momentum persists. |
| Stochastic | K: 67.15, D: 41.96 | Bullish Crossover | Potential for short-term bounce, needs confirmation. |
| ADX | 30.8 | Strong Trend | Indicates a strong downtrend is in place. |
| Bollinger | Middle Band | Watch | Price below mid-band suggests bearish bias. |
Key Levels
As traders, our greatest asset is patience and discipline. The market is always in motion, and opportunities arise from volatility. By understanding the current technical setup and respecting risk management principles, we can position ourselves to benefit from the inevitable shifts in market sentiment. Focus on the key levels and triggers outlined, and let the market provide the confirmation needed for your next trade.
Track markets in real-time
AI-powered analysis, technical indicators and real-time price data.
Join Our Telegram Channel
Breaking market news, AI analysis and trading signals instantly.
Join Channel