This isn't just another day on the Bitcoin charts; it's a pivotal moment where short-term momentum clashes with broader market forces. We're seeing BTCUSD grapple with the crucial $64,577 mark, a level that's acting as a significant psychological and technical barrier. After a period of consolidation following recent volatility, the question on every trader's mind is whether the bulls have enough firepower to push through, or if the bears are set to reassert control. My analysis suggests that while short-term indicators show some potential for a bounce, the larger macro picture and on-chain data paint a more cautious scenario. The interplay between traditional markets, regulatory whispers, and the inherent dynamics of the crypto ecosystem creates a complex tapestry that demands a nuanced approach. This is precisely where understanding the confluence of data points becomes paramount for navigating the current landscape.
- RSI at 40.8 on the 1H chart signals bearish momentum, but Stochastic shows a potential for a bounce.
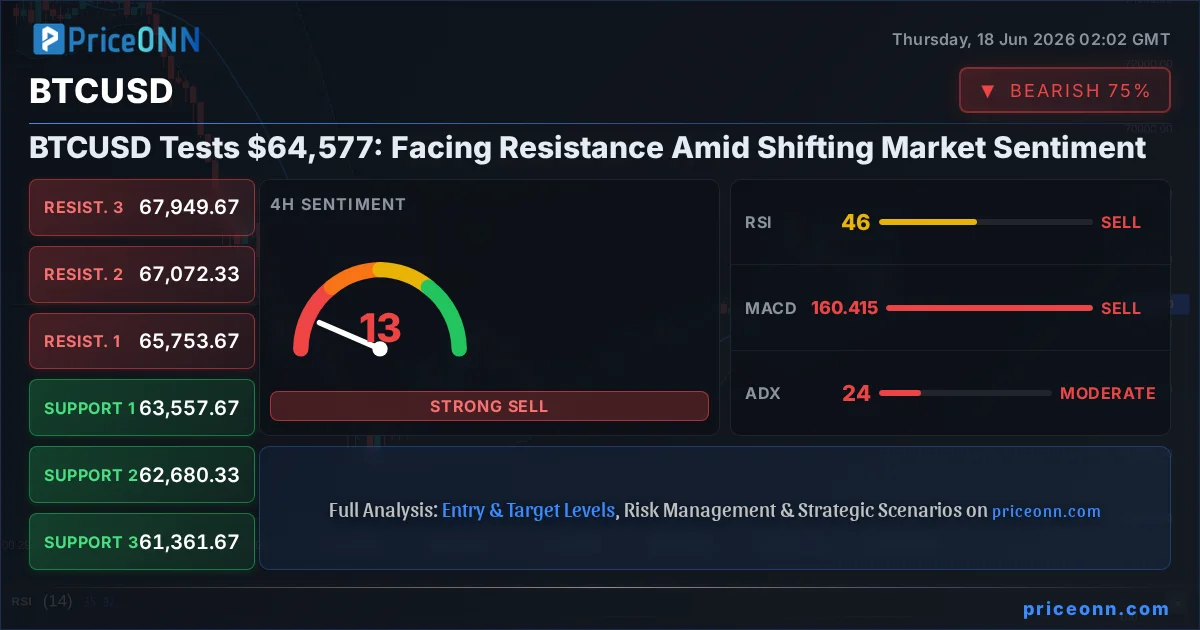
- Critical resistance for BTCUSD sits at $64,630.67, tested multiple times this week.
- MACD histogram negative momentum on 1H and 4H charts indicates selling pressure is still dominant.
- Fed rate expectations and DXY strength are influencing BTCUSD's correlation, suggesting a cautious outlook.
Navigating the $64,577 Crossroads: What the Charts Are Telling Us
Looking at the 1-hour BTCUSD chart, the picture is one of indecision, but with a clear bearish lean in momentum. The current price of $64,577 is finding immediate resistance around the $64,630.67 level. This isn't surprising given the ADX reading of 23.37, which, while indicating a moderate downtrend, also suggests that the market hasn't fully committed to a direction yet. The RSI at 40.8 is firmly in neutral territory, leaning towards bearish, but the Stochastic Oscillator (%K=24.73, %D=19.42) is flashing a bullish signal, indicating oversold conditions that could precede a short-term price recovery. However, the MACD remains below its signal line with negative momentum, a persistent sign that sellers are still in the driver's seat on this shorter timeframe. This conflict between Stochastic's oversold bounce potential and MACD's bearish momentum is a classic sign of a market in flux, where a catalyst is needed to break the stalemate.
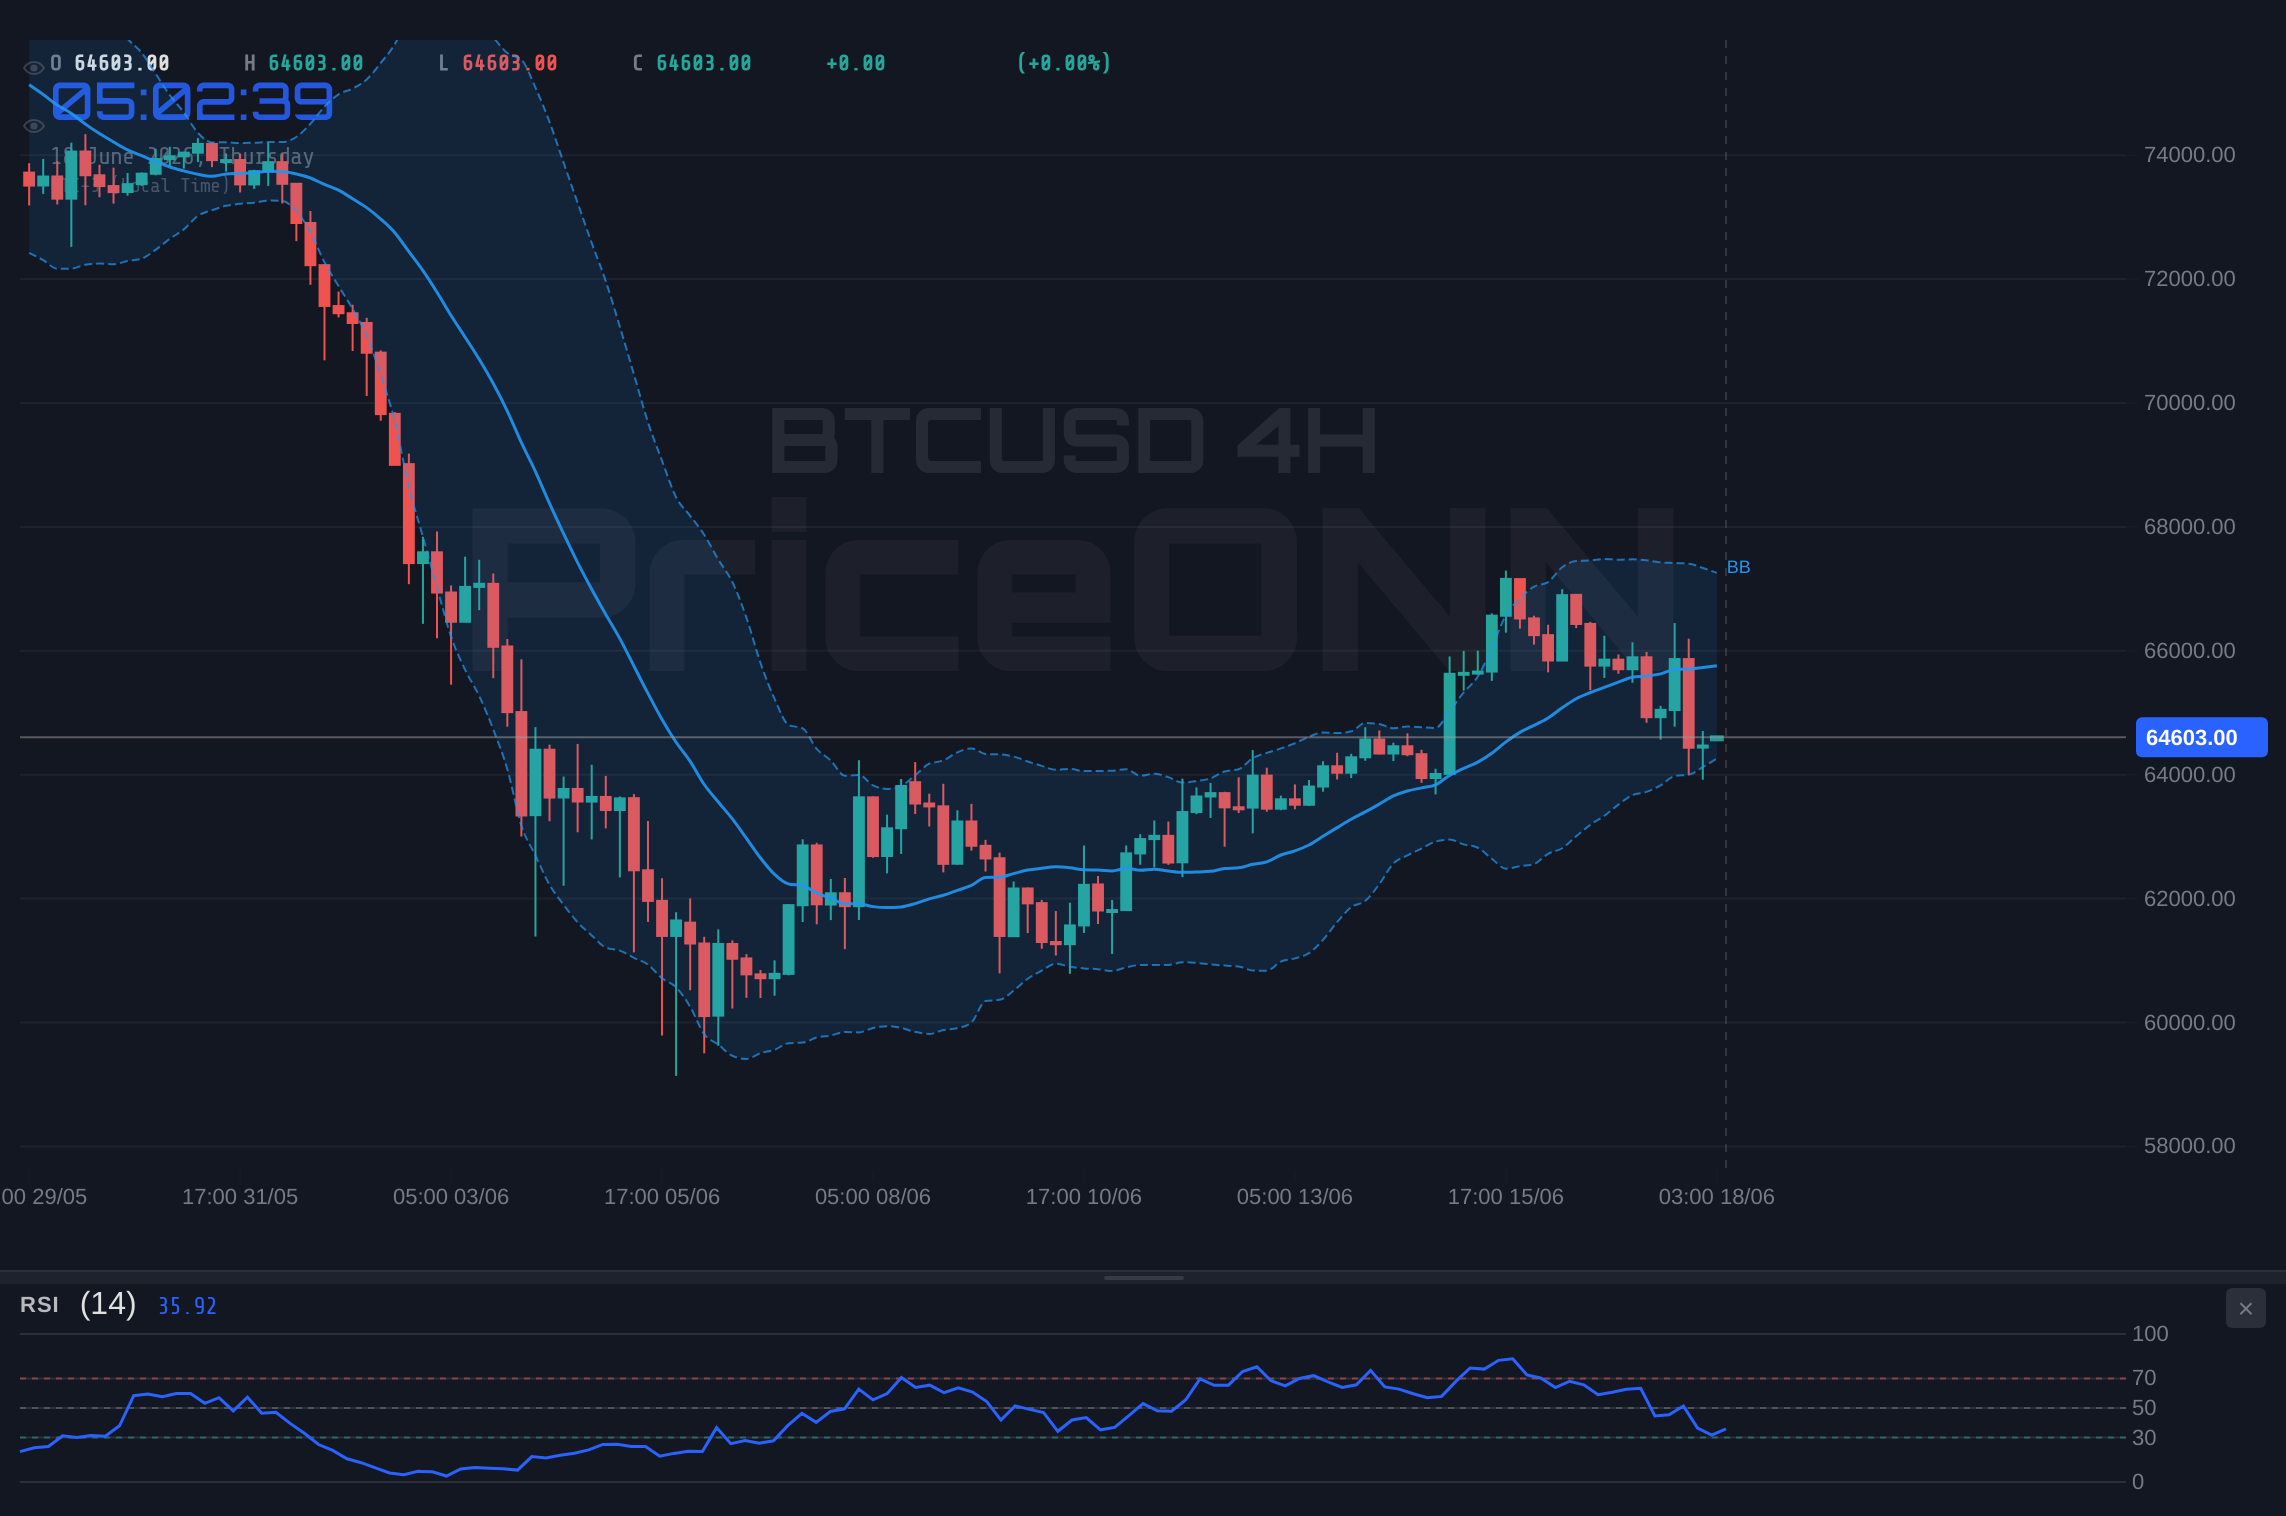
The 4-hour timeframe offers a slightly broader perspective, but the underlying message remains consistent: caution is advised. Here, the BTCUSD price is trading below the 4-hour middle Bollinger Band, and the ADX at 23.78 still points to a moderate trend, though it's showing a slight upward bias in strength compared to the 1-hour. The RSI at 45.49 continues to trend downwards, reinforcing the bearish sentiment. While the Stochastic (%K=31.44, %D=24.32) again suggests a potential upward move from oversold levels, the MACD's negative momentum persists, sitting below its signal line. This suggests that any short-term rallies are likely to be met with selling pressure as traders look to de-risk or take profits. The key takeaway here is that while short-term oversold conditions might offer brief relief, the broader trend on this timeframe still appears to be under pressure, making any upward moves suspect until confirmed by stronger price action and broader market sentiment shifts.
However, the daily chart presents a more complex and perhaps more telling narrative. Here, the BTCUSD trend is currently classified as 'Neutral' with 50% strength, a significant shift from the more decisive signals on shorter timeframes. The RSI at 39.67 is still in bearish territory, but the MACD is showing positive momentum, sitting above its signal line. This divergence between the RSI and MACD on the daily chart is noteworthy. It suggests that while the immediate selling pressure might be easing, the overall trend hasn't yet flipped bullish. The ADX at 39.14, however, is the loudest signal here, indicating a strong downtrend. This highlights a key conflict: the MACD hinting at a potential bottoming process, while the ADX screams 'downtrend strength'. This is where experienced traders look for confluence - confirmation across multiple indicators and timeframes. Without it, entering a position is more akin to gambling than strategic trading.
The Macroeconomic Shadow: DXY and Equities Weighing on Bitcoin
The performance of Bitcoin cannot be viewed in isolation. Its correlation with traditional risk assets and the strength of the US Dollar remain critical factors. The Dollar Index (DXY) is currently trading at 100.34, showing significant strength with a 0.77% daily gain. This upward movement in the dollar, especially with the RSI at 72.64 nearing overbought territory on the 1-hour chart, typically puts pressure on riskier assets like Bitcoin and gold. When the dollar strengthens, it becomes more expensive for holders of other currencies to acquire dollar-denominated assets, and it can also signal a flight to safety, drawing capital away from riskier markets.
The equity markets are also sending mixed signals that impact Bitcoin. The S&P 500 is up 0.74% to 6572.87, suggesting some risk appetite, while the Nasdaq is also showing gains. However, the daily chart for both indices shows a different story, with the S&P 500 exhibiting a strong downtrend (ADX 47.51) and the Nasdaq showing neutral but potentially weakening momentum. This dichotomy - short-term gains versus longer-term bearish trends - creates uncertainty. Historically, Bitcoin has shown an increasing correlation with tech stocks, particularly during periods of high liquidity and risk-on sentiment. However, when macroeconomic uncertainty rises, and the dollar strengthens, this correlation can break down. The current environment, with the DXY's ascent, suggests that the broader risk-off sentiment might be re-emerging, which would naturally create headwinds for BTCUSD, regardless of its own internal technical signals.
Furthermore, the recent news regarding falling oil prices and their potential impact on inflation expectations adds another layer of complexity. While lower oil prices can be a tailwind for stock markets by reducing input costs and easing inflationary pressure, they can also signal slowing global demand, which is a bearish macro indicator. The geopolitical shifts mentioned in recent reports, such as the tentative U.S.-Iran deal, could ease energy price shocks in some regions, but the underlying demand concerns remain. For Bitcoin, which has been increasingly seen by some as a hedge against inflation and currency debasement, a narrative shift towards slowing growth could diminish its appeal as a safe-haven asset, pushing investors back towards traditional safe havens like gold or even the strengthening dollar itself.
Crypto-Specific Dynamics: What's Happening Under the Hood?
Beyond the macro and technicals, the cryptocurrency ecosystem itself is undergoing significant developments. While the provided data doesn't include specific on-chain metrics for BTCUSD today, we can infer potential trends based on market behavior. A price pullback from recent highs, especially if accompanied by a decrease in active addresses or a rise in exchange inflows, could suggest waning retail interest or increased selling pressure from miners or long-term holders looking to de-risk. Conversely, if exchange outflows remain strong and active addresses hold steady or increase, it might indicate that smart money is accumulating at these levels, despite the bearish short-term signals.
The regulatory landscape continues to be a significant, albeit often unpredictable, driver for the crypto market. Any news regarding approvals or rejections of Bitcoin ETFs, or new regulatory frameworks being proposed or enacted in major economies, can cause sharp price movements. Currently, there's no specific breaking regulatory news impacting BTCUSD directly, but the ongoing discussions surrounding digital asset classification and taxation in various jurisdictions create an undercurrent of uncertainty. This uncertainty can exacerbate volatility, making it crucial for traders to remain vigilant and understand that regulatory developments can quickly override technical patterns.
The dominance of Bitcoin within the overall crypto market capitalization is another metric to watch. If Bitcoin's dominance is rising while its price consolidates or falls slightly, it often signifies a flight to safety within the crypto space, with capital moving from altcoins into the perceived stability of BTC. If, however, Bitcoin's dominance is falling as its price struggles, it could indicate a rotation into altcoins, potentially signaling a more bullish sentiment for the broader crypto market, or simply a lack of conviction in Bitcoin itself. Without specific data on Bitcoin dominance today, it's difficult to draw firm conclusions, but it's a factor that should be monitored closely to gauge overall market health and investor sentiment towards the flagship cryptocurrency.
The Path Forward: Watching for Confirmation
The current technical setup for BTCUSD presents a classic 'watch zone' scenario. The price is hovering around $64,577, caught between conflicting signals on different timeframes and facing headwinds from a strengthening dollar and mixed equity market signals. A decisive move is needed to break this stalemate. For a bullish case to gain traction, we need to see BTCUSD decisively break and hold above the immediate resistance at $64,630.67, ideally with increasing volume and a positive shift in broader market sentiment. Confirmation would come from a sustained push above $65,000, followed by a retest and hold of previous highs. The daily MACD showing positive momentum is a glimmer of hope, but it needs to be supported by a declining ADX and a rising RSI above 50 to truly signal a trend reversal.
Conversely, a bearish scenario would be confirmed by a failure to hold the current levels, leading to a breakdown below the support at $64,385.67. A close below this level, especially on the 1-hour or 4-hour chart, would likely trigger further downside, targeting the next support at $64,300.33. The strong ADX readings on shorter timeframes and the persistent negative MACD momentum on the 1H and 4H charts suggest that a breakdown is a plausible outcome if selling pressure intensifies. The DXY's current strength also adds weight to the bearish outlook, as a continued rise in the dollar could easily drag Bitcoin lower, irrespective of crypto-specific factors.
Bearish Scenario: Breakdown Below Key Support
65% ProbabilityNeutral Scenario: Consolidation Around $64,577
25% ProbabilityBullish Scenario: Breakout Above Resistance
10% ProbabilityFrequently Asked Questions: BTCUSD Analysis
What happens if BTCUSD breaks below the $64,385.67 support level?
A break below $64,385.67 would invalidate the immediate bullish potential and likely target the $64,300.33 support. The negative MACD momentum on shorter timeframes and the strong ADX would support this bearish move, especially if the DXY continues to climb.
Should I buy BTCUSD at current levels around $64,577 given the Stochastic signal?
Buying solely based on the Stochastic signal at $64,577 would be risky. While it indicates oversold conditions, the MACD and daily ADX show persistent bearish momentum. A more prudent approach would be to wait for confirmation, such as a break above $64,630.67, or a confirmed bounce from lower support levels like $64,300.33.
Is the RSI at 40.8 a sell signal for BTCUSD right now?
An RSI of 40.8 on the 1-hour chart isn't a direct sell signal but indicates a bearish lean. It suggests that selling pressure is more dominant than buying momentum. However, it's not yet in deeply oversold territory, and the Stochastic is hinting at a potential short-term bounce, so caution is advised rather than an immediate sell order.
How will the DXY's strength at 100.34 affect BTCUSD this week?
The DXY's current strength at 100.34, with a daily gain of 0.77%, typically exerts downward pressure on risk assets like BTCUSD. A continued rise in the dollar could lead to further downside for Bitcoin as capital seeks safer havens or benefits from a stronger USD, potentially invalidating any bullish technical setups.
The market is at a critical juncture, and patience will be rewarded. While short-term indicators might tease a bounce, the macro headwinds and persistent bearish momentum on key timeframes suggest caution. True opportunities arise when the market provides clear signals and confirmation. Manage your risk, wait for your setup - the market always gives a second chance.
Track markets in real-time
AI-powered analysis, technical indicators and real-time price data.
Join Our Telegram Channel
Breaking market news, AI analysis and trading signals instantly.
Join Channel