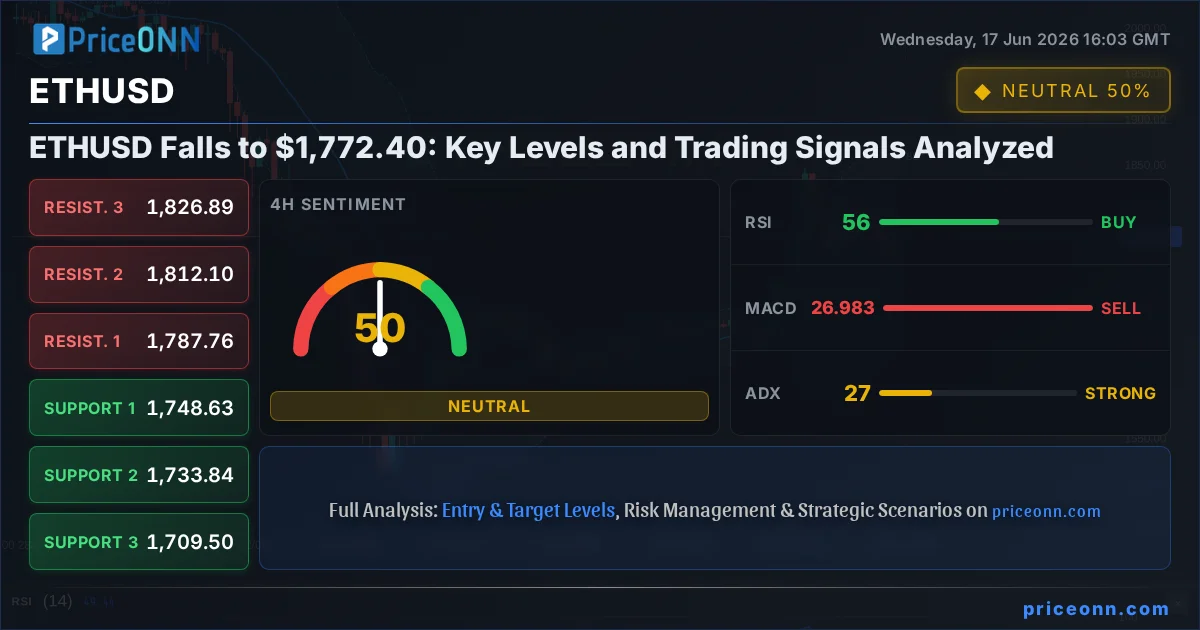
ETHUSD is currently navigating choppy waters, trading at $1,772.40 following a notable 1.29% decline in the last 24 hours. This pullback, while significant, occurs within a broader context of mixed signals across multiple timeframes, demanding a careful look at the critical levels and indicators shaping ETHUSD today analysis. As the crypto market navigates evolving macroeconomic winds and internal sector developments, understanding the immediate technical picture for Ethereum becomes paramount for any trader looking to position themselves effectively. The current price action presents a nuanced scenario, far from a clear-cut bull or bear trend, making a data-driven approach essential.
- ETHUSD is trading at $1,772.40, down 1.29% on the day, with a 4-hour trend strength of 50% indicating consolidation.
- Critical support for ETHUSD sits at $1,755.77, while immediate resistance is observed at $1,836.44.
- The 1-hour RSI at 47.66 suggests bearish momentum, contrasting with a 1-hour MACD showing positive momentum.
- The correlation with the DXY, currently at 99.74 and rising, could exert downward pressure on ETHUSD.
Navigating the Short-Term Pullback
The immediate 1-hour chart for ETHUSD presents a picture of cautious selling pressure. With an RSI reading of 47.66, the momentum indicator suggests that while the price has pulled back, it's not yet in oversold territory. This indicates potential for further downside if selling pressure intensifies. The MACD, however, offers a slightly more optimistic, albeit conflicting, signal. It currently shows positive momentum, with the MACD line above its signal line. This divergence between RSI and MACD on the 1-hour timeframe highlights the indecision in the market. A trader watching this closely would note that a break below the immediate support at $1,740.15 could solidify the bearish outlook, potentially targeting the next support at $1,727.53. Conversely, a sustained push above the 1-hour resistance at $1,764.38 would be the first sign that bulls are regaining control in this very short-term window.
The ADX on the 1-hour chart stands at 23.05, indicating a moderately strong downtrend. This reinforces the notion that while there might be short-term fluctuations, the prevailing sentiment in the immediate hours is tilted towards bearishness. The Stochastic Oscillator, with %K at 40.32 and %D at 24.26, also shows a bullish crossover signal, suggesting a potential upward bounce. This cacophony of signals underscores the need for patience. The market is not giving a clear directive, and trying to force a trade here could be premature. Instead, observing how ETHUSD reacts to the key levels defined by the 1-hour data – support at $1,740.15 and resistance at $1,764.38 – will be crucial for short-term traders.
The 1-hour ETHUSD chart exhibits conflicting signals: RSI points to potential downside, while MACD shows positive momentum. The ADX at 23.05 suggests a moderate downtrend, making the $1,740.15 support level critical.
The 4-Hour Conundrum: Consolidation Ahead?
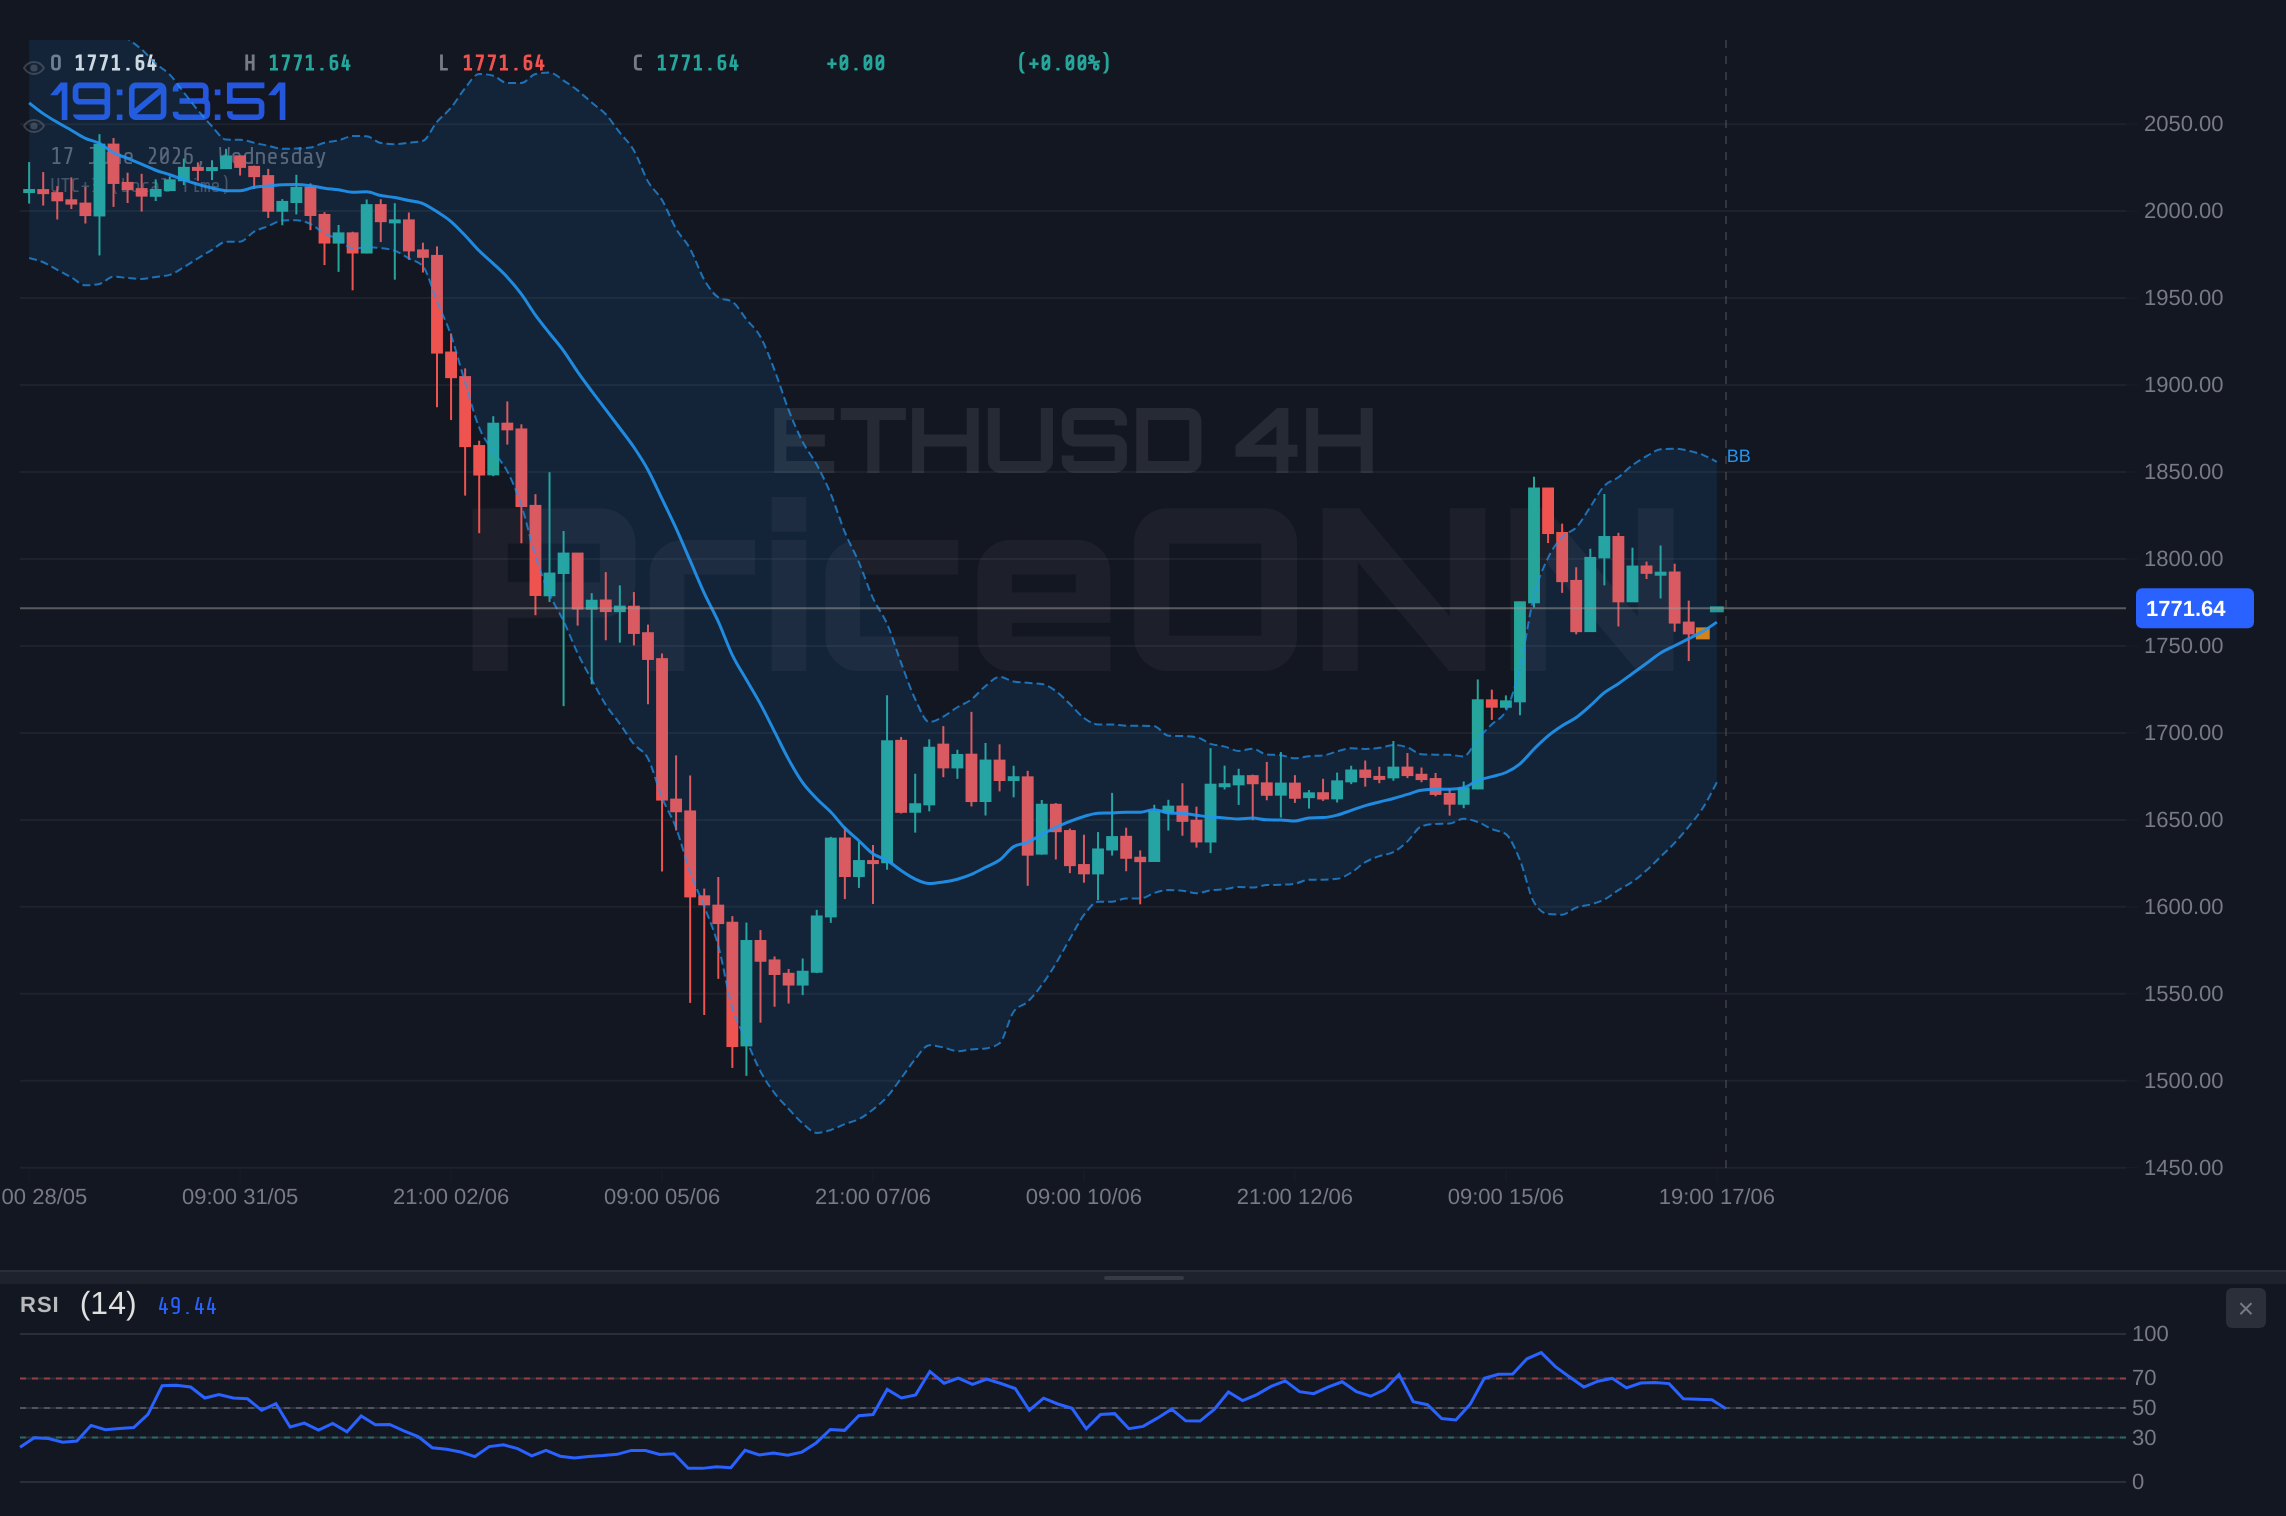
Shifting to the 4-hour timeframe, the picture for ETHUSD becomes even more neutral, with a trend strength of 50%. This suggests a period of consolidation or range-bound trading is more likely than a decisive move. The current price of $1,772.40 sits above the middle Bollinger Band, which typically indicates a bullish bias within the band's structure. However, the RSI at 55.51 is comfortably in neutral territory, showing no immediate signs of overbought or oversold conditions. This aligns with the idea of a market searching for direction. The MACD on this timeframe is currently negative, with the MACD line below its signal line, indicating bearish momentum. This contrasts sharply with the 1-hour MACD and adds to the ambiguity.
The Stochastic Oscillator on the 4-hour chart shows %K at 27.65 and %D at 47.08, indicating a bearish crossover and suggesting further downside potential. This aligns with the negative MACD but contradicts the RSI's neutral stance. The ADX at 26.95 signifies a strong uptrend, which seems at odds with the current price action and other indicators. This strong ADX reading might be a lagging indicator or reflect a prior trend that is now faltering. Given these mixed signals, the key levels to watch on the 4-hour chart are the support at $1,748.63 and the resistance at $1,787.76. A break decisively above $1,787.76 could signal a shift towards a bullish trend, targeting higher resistance levels. Conversely, a close below $1,748.63 might invite further selling pressure towards the $1,733.84 support.
The 4-hour chart shows a neutral trend with conflicting indicators. While the RSI is neutral, the MACD and Stochastic suggest bearish momentum. Watch for a break of $1,748.63 support or $1,787.76 resistance for directional clues.
The Daily Chart: A Lingering Bearish Bias
Looking at the daily chart, the overall trend for ETHUSD is classified as bearish with a significant strength of 97%. This long-term perspective is crucial for understanding the broader market sentiment. The current price of $1,772.40 is trading above the middle Bollinger Band, which, as seen on the 4-hour chart, can sometimes indicate strength within the band. However, the RSI at 44.2 is firmly in neutral territory but trending downwards, reinforcing the bearish outlook. This suggests that while there might be short-term bounces, the overall pressure on ETHUSD remains to the downside from a daily perspective.
The MACD on the daily chart is exhibiting positive momentum, with the MACD line above its signal line. This is a bullish signal on the daily timeframe, directly contradicting the overall bearish trend strength and the RSI. This divergence is a critical observation. It might indicate that the underlying selling pressure is weakening, and a potential reversal could be brewing. The Stochastic Oscillator on the daily chart is showing a strong bullish signal, with %K at 79.22 and %D at 64. This points towards an overbought condition developing, which typically precedes a price reversal or at least a period of consolidation. The ADX at 44.08 confirms a strong downtrend, but the combination of bullish Stochastic and MACD signals against this strong downtrend suggests that bears might be losing their grip. The key daily support level to monitor is $1,755.77, followed by $1,715.89. On the upside, resistance is eyed at $1,836.44 and then $1,877.23. A decisive close above $1,836.44 would be a significant bullish development, potentially invalidating the current bearish trend.
The daily chart for ETHUSD presents a bearish trend (ADX 44.08) but with conflicting bullish signals from the MACD and Stochastic. This divergence suggests that while the long-term trend is down, the market might be building towards a short-term reversal or a significant bounce from current levels.
Correlations and Macroeconomic Undercurrents
Understanding ETHUSD's price action in isolation is insufficient; its correlation with broader market indicators and macroeconomic factors is vital. The Dollar Index (DXY) is currently at 99.74 and showing a rising trend on the 1-hour and 4-hour charts, with a neutral outlook on the daily. A strengthening dollar typically exerts downward pressure on risk assets like cryptocurrencies, including ETHUSD. With the DXY pushing higher, this macro trend could be a significant headwind for Ethereum, potentially exacerbating any existing bearish sentiment and making it harder for prices to recover.
Equities, represented by the SP500 and Nasdaq, are showing mixed signals. The SP500 has a strong bullish trend on the 1-hour and 4-hour charts but a bearish daily trend. Nasdaq shows a bullish daily trend but a bearish 1-hour trend. This overall uncertainty in the equity markets suggests a cautious risk appetite. In such an environment, capital might shy away from riskier assets like crypto, favoring safer havens. The recent news about falling oil prices potentially easing pressure on India's trade deficit and providing a tailwind for global stock markets could be interpreted as a marginally positive sign for risk assets, but the DXY's strength remains a dominant factor. The absence of direct ETHUSD news in the provided snippets means we rely heavily on technicals and macro correlations.
“The correlation between risk assets and the dollar's strength is a constant battle. Right now, the dollar's upward momentum is a significant force that cannot be ignored for assets like ETHUSD.”
On-Chain Metrics and Crypto-Specific Fundamentals
While the provided market data doesn't include granular on-chain metrics, we must consider their general implications for ETHUSD. Active addresses provide insight into network usage; a declining trend could signal waning interest, while a surge might indicate renewed accumulation. Whale movements, tracked by large wallet transactions, can be leading indicators of market sentiment shifts. If large holders are accumulating, it's a bullish sign; if they are distributing, it's bearish. Exchange flows are also critical: net inflows suggest selling pressure, while net outflows indicate accumulation. Currently, without specific data, we assume a neutral to slightly bearish on-chain sentiment given the price action.
The DeFi ecosystem, measured by Total Value Locked (TVL), is a key fundamental driver for Ethereum. A growing TVL implies more capital is being deployed in DeFi protocols built on Ethereum, increasing demand for ETH as collateral and for gas fees. Conversely, a shrinking TVL suggests capital is moving out of the ecosystem, potentially reducing demand. The NFT market, while currently less dominant than in previous cycles, also contributes to gas fee generation and network activity. Regulatory news remains a constant overhang for the crypto market. Any positive developments, such as clearer guidelines or institutional adoption like Bitcoin ETFs, can boost sentiment. Conversely, crackdowns or negative regulatory pronouncements can trigger sell-offs. The ongoing AI boom mentioned in the news, while primarily impacting tech stocks, could indirectly benefit crypto if AI integration leads to new use cases or increased demand for computational power that blockchain can provide.
The health of Ethereum's DeFi and NFT ecosystems, alongside regulatory clarity, are fundamental drivers. A growing TVL and positive regulatory news could provide a much-needed catalyst for ETHUSD, independent of broader market movements.
Trading Scenarios for ETHUSD
Bearish Scenario: Re-test of Lower Supports
65% ProbabilityBullish Scenario: Reversal from Current Levels
15% ProbabilityNeutral Scenario: Range-Bound Consolidation
20% ProbabilityWhat to Watch Next for ETHUSD
The immediate focus for ETHUSD traders will be on how the price action unfolds around the $1,755.77 support level. A failure to hold this level on increased volume could trigger the bearish scenario, targeting lower price points. Conversely, a strong rebound from this support, coupled with a decisive break above the $1,764.38 (1H resistance) and subsequently $1,836.44 (daily resistance), would be necessary to invalidate the bearish outlook and signal a potential trend reversal. The prevailing DXY strength and mixed equity market sentiment add layers of complexity, suggesting that broader market forces could significantly influence ETHUSD's short-to-medium term trajectory.
Traders should pay close attention to the interplay between the RSI and MACD on the daily chart. The divergence between the bearish trend and bullish indicators presents an opportunity for those who can patiently wait for confirmation. If the Stochastic Oscillator continues its upward trajectory towards overbought levels and the MACD confirms a bullish crossover on the daily, it could signal a significant turning point. However, until these bullish signals gain more confluence and are supported by a weakening DXY or a risk-on shift in equities, caution remains the prudent strategy. Monitoring volume on key level breaks will be critical for confirming the validity of any moves.
Frequently Asked Questions: ETHUSD Analysis
What happens if ETHUSD breaks below the critical $1,755.77 support level?
If ETHUSD closes below $1,755.77 on the daily chart, it would likely trigger the bearish scenario, with immediate downside targets at $1,715.89 and potentially $1,675.10. This would confirm the prevailing bearish trend strength indicated by the ADX.
Should I consider buying ETHUSD at current levels around $1,772.40 given the mixed signals?
Buying at current levels carries risk due to the bearish daily trend and DXY strength. A more prudent approach would be to wait for a confirmed break above daily resistance at $1,836.44 or a strong bounce from support near $1,755.77 with bullish confirmation on the daily MACD and Stochastic.
Is the RSI at 44.2 on the daily chart a sell signal for ETHUSD right now?
An RSI of 44.2 is in neutral territory and trending downwards, supporting the overall bearish trend. However, it is not an oversold condition that typically signals an immediate buy opportunity. The bullish divergence seen on the daily Stochastic (79.22) suggests caution against shorting aggressively here.
How might the strengthening DXY at 99.74 affect ETHUSD this week?
The rising DXY typically puts pressure on risk assets like ETHUSD. If the dollar continues its upward trend, it could exacerbate selling pressure on Ethereum, making it harder to break above key resistance levels like $1,836.44 and potentially pushing it towards lower support.
Track markets in real-time
AI-powered analysis, technical indicators and real-time price data.
Join Our Telegram Channel
Breaking market news, AI analysis and trading signals instantly.
Join Channel