In the current market climate, where macroeconomic pressures are increasingly dictating asset movements, the cryptocurrency landscape is not immune to these forces. ETHUSD, the second-largest cryptocurrency by market capitalization, is currently navigating a challenging phase, trading at $1,705.00. This price point comes under significant scrutiny as broader market sentiment shifts, influenced by a strengthening US Dollar and a noticeable dip in risk appetite across global equities. The prevailing narrative suggests that until these macro headwinds abate, digital assets may continue to face headwinds, making a close examination of ETHUSD's technical posture and its correlation with traditional markets essential for understanding its near-term trajectory.
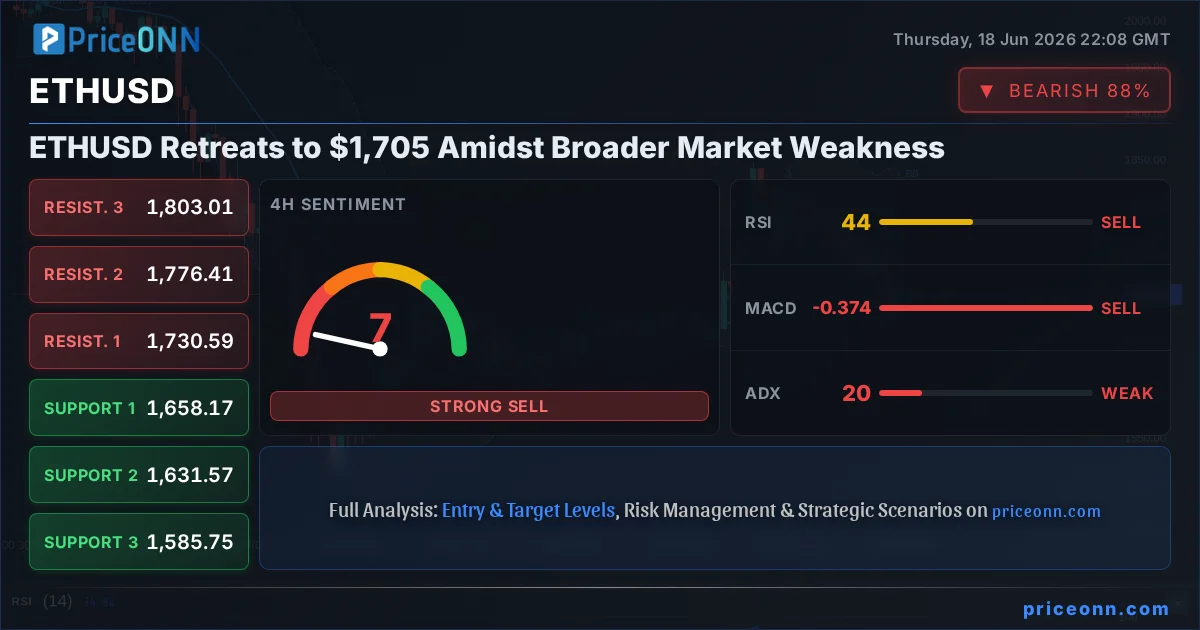
- ETHUSD is currently trading at $1,705.00, reflecting a bearish trend across multiple timeframes.
- The Relative Strength Index (RSI) on the 1-hour chart stands at 41.19, indicating bearish momentum but still within neutral territory.
- Critical support for ETHUSD is being tested near the $1,703.04 level, with further downside targets at $1,697.59 and $1,691.88.
- A strengthening DXY, currently at 100.9, is exerting downward pressure on risk assets like ETHUSD, correlating with its bearish price action.
Macroeconomic Pressures Weigh on Digital Assets
The financial markets are currently experiencing a period of heightened sensitivity to macroeconomic factors, with the US Dollar Index (DXY) acting as a primary barometer of global risk sentiment. As the DXY continues its ascent, currently trading at 100.9, it exerts a predictable drag on risk-sensitive assets, including cryptocurrencies like Ethereum. This inverse correlation is a well-established phenomenon; a stronger dollar typically signifies a shift towards safer assets, drawing capital away from more speculative investments. For ETHUSD, this translates into increased selling pressure. The 1-hour chart reveals a clear bearish trend with a strength of 90%, supported by an RSI of 41.19 and negative MACD momentum. These indicators collectively paint a picture of cautious sentiment, where any upward price action is met with skepticism, and the path of least resistance appears to be downwards. The immediate focus for traders will be on how ETHUSD holds above its key support levels in the face of this dollar strength.
The Dollar's Dominance and Its Impact on ETHUSD
The current strength displayed by the US Dollar Index (DXY) at 100.9 is a critical factor influencing the performance of assets like ETHUSD. When the dollar strengthens, it typically implies increased demand for USD-denominated assets, often at the expense of other currencies and riskier investments. This dynamic is particularly impactful for cryptocurrencies, which are often seen as alternative, higher-risk assets. The data shows a clear bearish trend on ETHUSD's 1-hour chart, with the ADX at 30.6 indicating a strong downward momentum. This suggests that the dollar's strength is not merely a minor influence but a significant driver of price action for Ethereum right now. The technical indicators on the 1-hour timeframe, such as a bearish MACD and an RSI below 50, reinforce this sentiment. Traders are closely watching to see if this correlation persists, as any significant shift in DXY sentiment could trigger a rapid repran of ETHUSD.
Furthermore, the relationship between the DXY and ETHUSD is not always linear but is often pronounced during periods of economic uncertainty or shifting monetary policy expectations. With central banks globally navigating inflation and growth concerns, the dollar often acts as a safe haven. This can lead to a scenario where, as the dollar rallies, assets like ETHUSD face liquidation pressure, pushing prices lower. The current data suggests that this is precisely the environment ETHUSD is operating within, making the DXY's movements a crucial element to monitor for any potential ETHUSD trading signals.
Technical Breakdown: ETHUSD Under Pressure
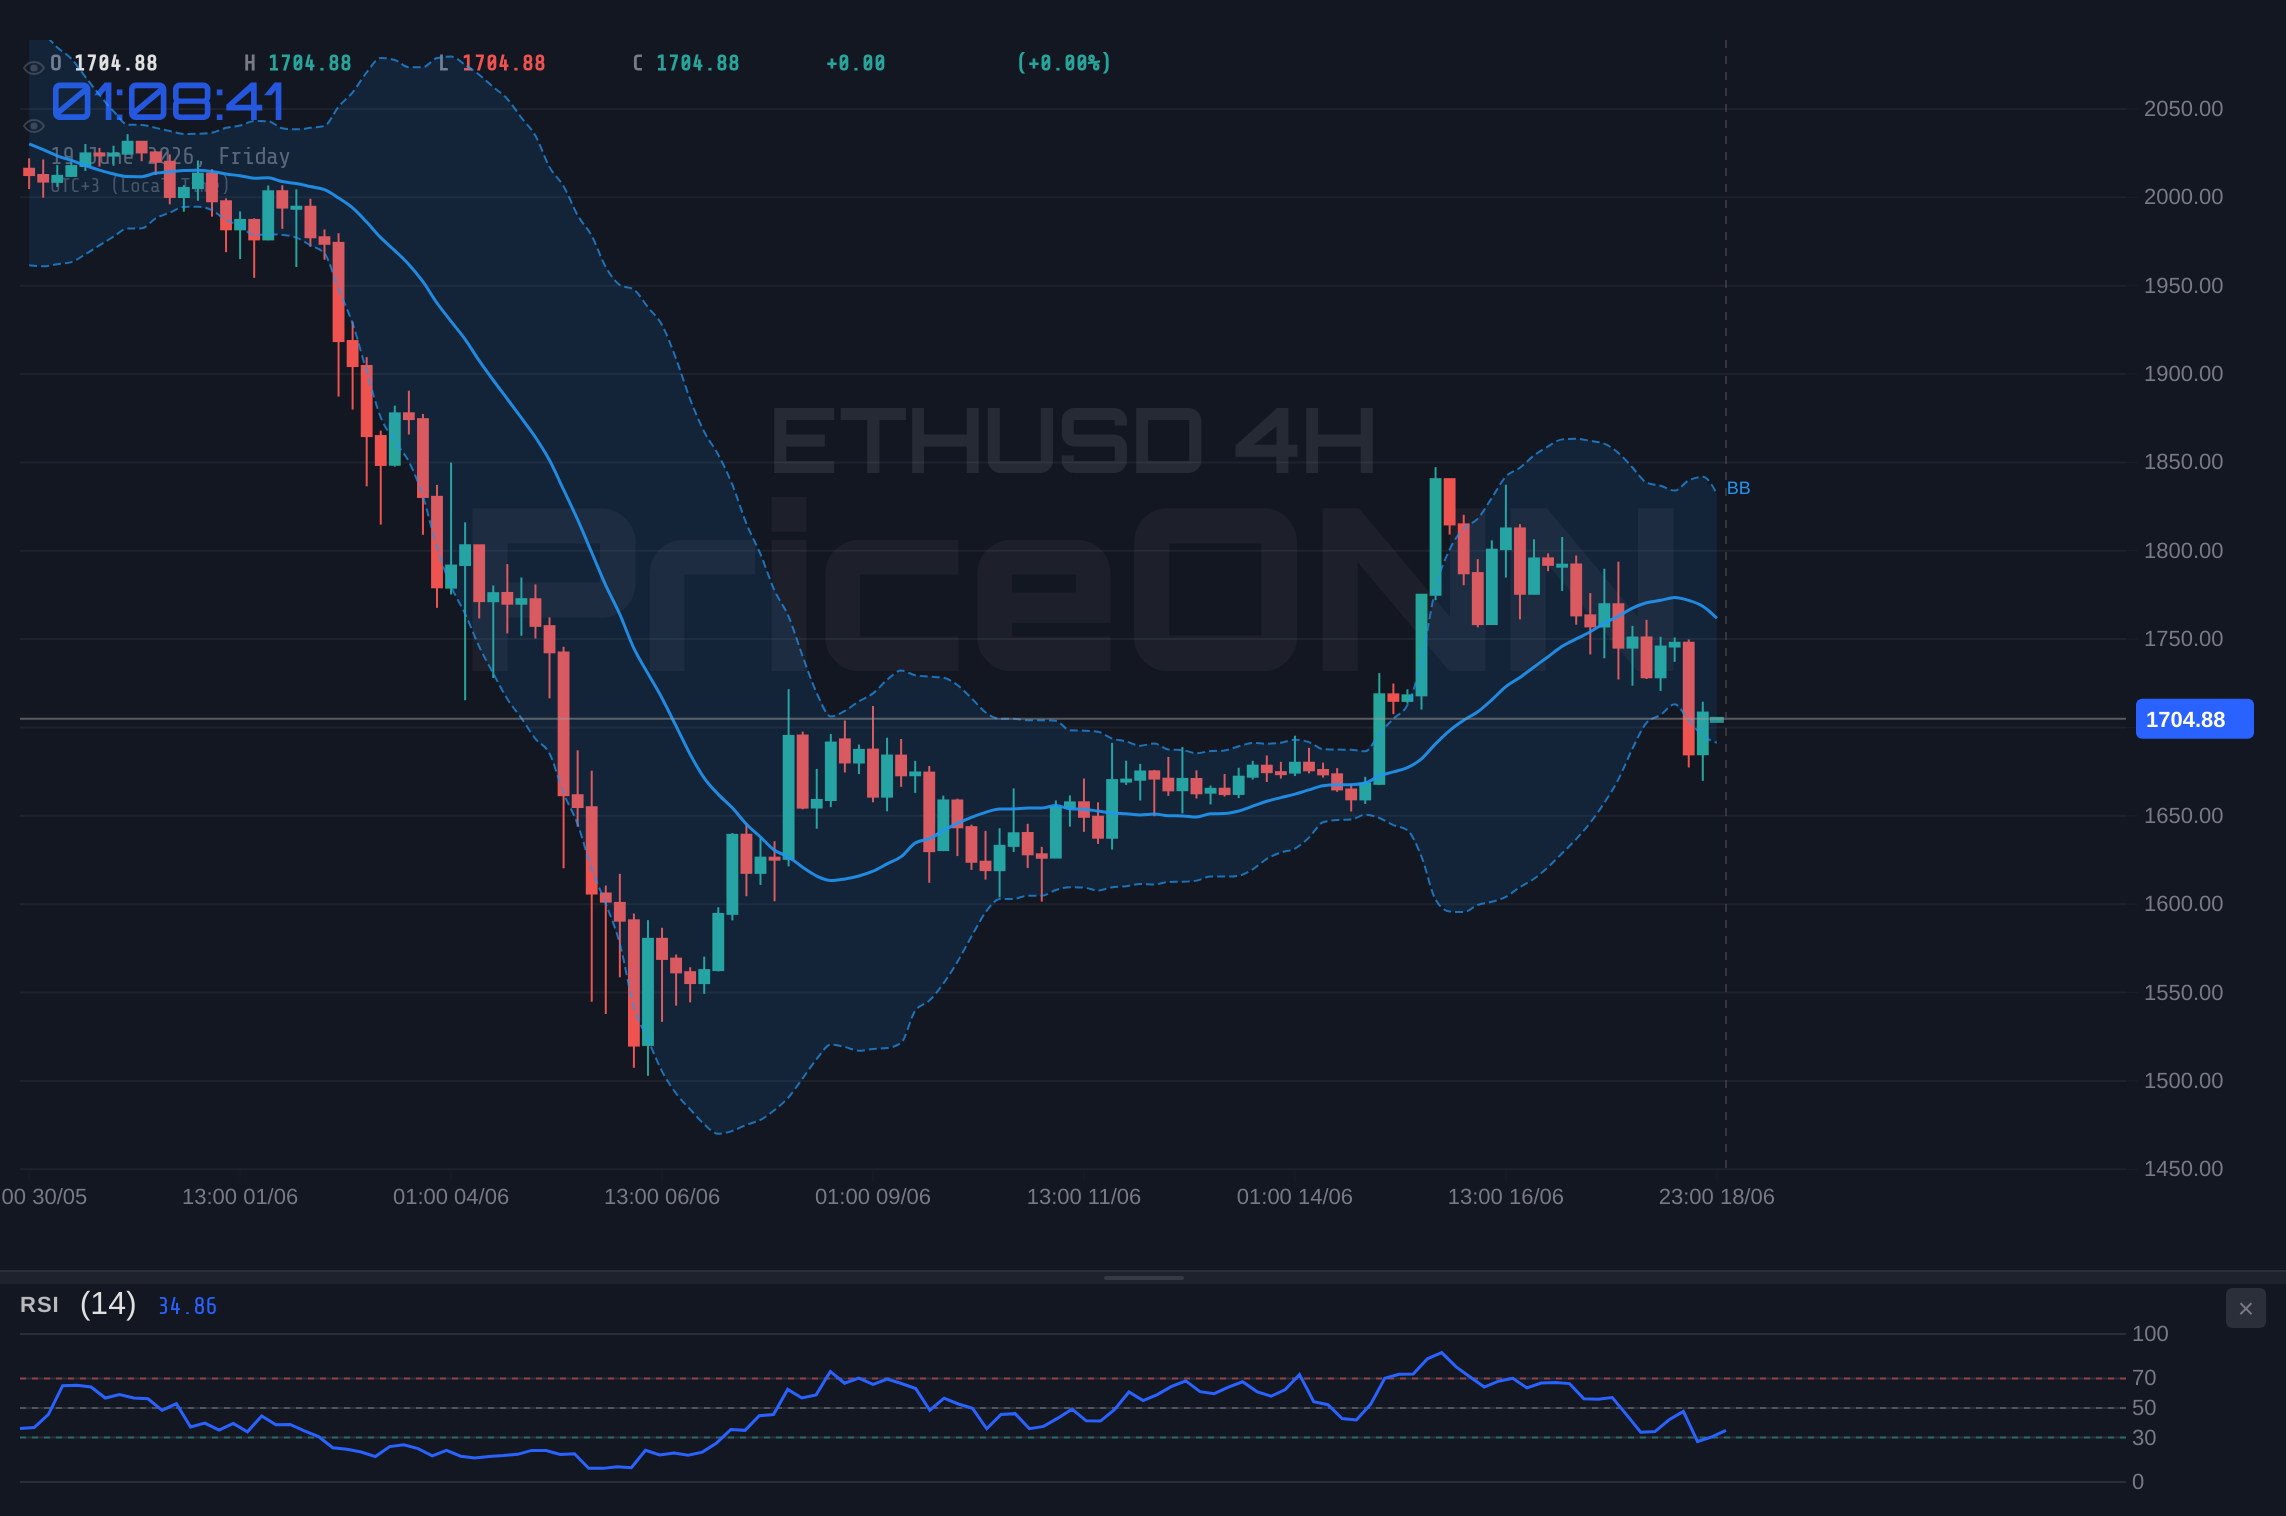
On the technical front, ETHUSD is exhibiting a predominantly bearish outlook across multiple timeframes, underscoring the immediate challenges facing the cryptocurrency. The 1-hour timeframe clearly signals a strong bearish trend (90% strength), with the price currently hovering around $1,705.00. Key support levels are under threat, with the first line of defense at $1,703.04. A break below this could quickly lead to tests of $1,697.59 and $1,691.88. The Relative Strength Index (RSI) at 41.19 on this timeframe, while in the neutral zone, shows a downward inclination, suggesting that sellers are maintaining control. The MACD indicator further confirms this, displaying negative momentum with the MACD line below its signal line. This confluence of bearish technical signals paints a cautious picture, indicating that any rallies are likely to be met with selling pressure.
The 4-hour chart, while showing a neutral trend (50% strength), still leans bearish, with support at $1,658.17, $1,631.57, and $1,610.00. The RSI here is at 43.58, also suggesting a lack of bullish conviction. The Stochastic Oscillator is in the oversold region with %K below %D, hinting at a potential short-term bounce, but the overall trend on higher timeframes remains a concern. The ADX at 20.46 on the 4-hour chart indicates a moderately trending market, but the bearish signals from MACD and Bollinger Bands (below the middle band) suggest that downside risk remains elevated.
The daily timeframe presents a more significant picture. Here, ETHUSD is in a strong bearish trend (96% strength), with the RSI at 39.58. This level, while technically neutral, is trending downwards, indicating that buyers are not stepping in with conviction. The MACD is positive but showing signs of waning momentum, and the price is trading below the middle Bollinger Band, a classic sign of bearish pressure. The Stochastic Oscillator is showing a bearish signal with %K below %D. The ADX at 42.64 on the daily chart signifies a strong downward trend. Despite the oversold conditions suggested by Stochastic on the 1-hour chart, the dominant bearish sentiment across multiple timeframes implies that significant upside requires a fundamental shift or a clear break above key resistance levels.
Navigating Key Levels: Support Under Fire
The current price action for ETHUSD at $1,705.00 places it in a precarious position relative to its immediate support structure. On the 1-hour chart, the critical support level to watch is $1,703.04. A decisive break below this mark would likely trigger further selling, with the next significant support points identified at $1,697.59 and $1,691.88. The RSI at 41.19 on this timeframe, combined with negative MACD momentum, suggests that the market is leaning towards a bearish resolution. This means any upward retracements are likely to be temporary, and traders should be prepared for potential downside continuation if these support levels fail.
Looking at the 4-hour timeframe, the support zone tightens around $1,658.17. While the Stochastic Oscillator is showing signs of oversold conditions, the overall trend remains a concern, especially given the strong bearish signals on the daily chart. The daily support levels at $1,712.29, $1,679.39, and $1,631.64 are crucial. The current price of $1,705.00 is precariously close to the initial daily support, making its defense paramount for any potential stabilization. A failure to hold these levels could signal a deeper correction, potentially testing the psychological $1,600 mark and beyond. The ADX values across all timeframes (30.6 on 1H, 20.46 on 4H, 42.64 on 1D) indicate that while trends are present, their strength and direction vary, demanding a nuanced approach rather than a simple directional bet.
Resistance Levels to Watch for a Trend Reversal
For ETHUSD to even consider a reversal from its current bearish trajectory, it must first overcome significant resistance. On the 1-hour chart, the immediate resistance is located at $1,714.20. A sustained push above this level, accompanied by increasing volume and positive momentum, could signal a temporary reprieve. However, the more critical resistance zone lies higher up. The 4-hour chart identifies resistance at $1,730.59, followed by $1,776.41 and $1,803.01. These levels represent significant psychological and technical barriers that would need to be decisively breached to challenge the prevailing downtrend. The daily resistance levels, which are even more substantial, are situated at $1,792.94, $1,840.69, and $1,873.59. Breaking through these higher resistance points would require a fundamental shift in market sentiment or a significant catalyst, such as a change in macroeconomic outlook or positive regulatory news impacting the crypto space.
Currently, with the RSI on the daily chart at 39.58 and trending downwards, and the MACD showing negative momentum, the path of least resistance is clearly downwards. The Stochastic Oscillator on the daily is showing a bearish signal (%K
Crypto-Specific Fundamentals: A Mixed Bag
While the broader market sentiment and technicals paint a bearish picture for ETHUSD, it's crucial to examine the underlying crypto-specific fundamentals. The Ethereum ecosystem continues to evolve, with ongoing developments in Layer 2 scaling solutions and the broader DeFi and NFT space. However, these positive developments are currently being overshadowed by macro pressures and a general risk-off sentiment. On-chain metrics, such as active addresses and transaction volumes, have seen fluctuations, but there isn't a clear, strong signal of renewed retail or institutional accumulation that would counteract the current selling pressure. Whale movements, closely monitored by the market, have shown mixed behavior, with some large holders potentially accumulating at lower prices, while others appear to be de-risking their positions.
Exchange flows also provide some insight. While net outflows might suggest accumulation, the overall trend hasn't been strong enough to overcome the broader market selloff. The impact of institutional adoption, particularly through potential spot ETH ETFs, remains a significant factor. However, recent regulatory uncertainty and the current macro environment might be tempering the immediate impact of these developments. The narrative around Ethereum's transition to Proof-of-Stake has largely been priced in, and while staking yields remain attractive, they are not currently providing a strong enough floor to counteract the prevailing bearish sentiment driven by external market forces. The correlation with Bitcoin, while typically high, also shows ETHUSD underperforming slightly in percentage terms during this downturn, suggesting specific concerns within the Ethereum ecosystem or simply a broader altcoin weakness.
The Role of Bitcoin Dominance and Altcoin Correlation
In analyzing ETHUSD's performance, understanding its correlation with Bitcoin (BTCUSD) and the concept of Bitcoin dominance is essential. Historically, ETHUSD tends to follow Bitcoin's price action, often amplifying its moves. However, during periods of market stress or significant macro shifts, this correlation can weaken, and altcoins, including Ethereum, can experience even steeper declines relative to Bitcoin. The current data shows BTCUSD trading at $62,920, also experiencing a bearish trend, albeit with mixed signals on longer timeframes. ETHUSD's price action at $1,705.00 reflects this broader crypto market weakness.
Bitcoin dominance, which measures Bitcoin's market cap relative to the total crypto market cap, can offer clues about investor sentiment. When dominance rises, it often suggests that investors are favoring the perceived safety of Bitcoin over altcoins during uncertain times. Conversely, a falling dominance can indicate increased appetite for riskier altcoins. While specific dominance data isn't provided, the general trend of ETHUSD underperforming BTCUSD during this downturn implies that either Bitcoin is acting as a relative safe haven within crypto, or that specific headwinds are affecting Ethereum more acutely. This dynamic is critical for traders looking to position themselves, as it highlights the varying risk profiles within the crypto market itself, independent of external macro factors.
Regulatory Landscape and its Influence on ETHUSD
The regulatory environment for cryptocurrencies, particularly for Ethereum, remains a significant factor influencing investor confidence and, consequently, price action. While the market has largely digested the implications of Ethereum's transition to Proof-of-Stake, ongoing discussions and actions by regulatory bodies worldwide continue to shape the landscape. Developments in the United States, particularly concerning the classification of certain digital assets and the potential for new regulations, can create periods of uncertainty. Such uncertainty often leads to increased volatility and can exacerbate selling pressure, especially when coupled with unfavorable macroeconomic conditions.
For ETHUSD at $1,705.00, any news suggesting stricter regulatory oversight or unfavorable legal rulings could act as a catalyst for further price declines, pushing it towards the support levels identified at $1,703.04 and below. Conversely, positive regulatory clarity or developments that signal a more supportive framework for digital assets could provide a much-needed boost to sentiment and potentially trigger a short-covering rally. Given the current macro environment, the market is likely to be more sensitive to negative regulatory news than positive developments, making the regulatory landscape a key area to monitor for any shifts in ETHUSD's outlook.
Trade Scenarios: Navigating the Current Environment
Given the confluence of bearish technical indicators, strengthening DXY, and ongoing regulatory uncertainties, the immediate outlook for ETHUSD presents a challenging trading environment. The current price of $1,705.00 sits precariously close to key support, suggesting a potential for either a bounce or a further breakdown. The probabilities assigned reflect the prevailing bearish sentiment and the technical setup.
Bearish Scenario: Support Breakdown Ahead
65% ProbabilityNeutral Scenario: Consolidation Around Support
25% ProbabilityBullish Scenario: Unexpected Rebound
10% ProbabilityRisk Management: The Trader's Best Friend
In volatile markets like the one ETHUSD is currently experiencing, disciplined risk management is not just advisable; it's imperative. With the primary bearish scenario carrying a 65% probability, traders should focus on risk-controlled entries. For those considering short positions, waiting for a confirmed break below the $1,703.04 support level would offer a clearer entry signal, with stops placed just above the breakdown point. Conversely, for the less probable bullish scenario, waiting for a decisive close above the $1,730.59 resistance level on the 4-hour chart would be a prerequisite for considering long positions, with invalidation below the $1,691.88 support.
The neutral scenario, while less probable, highlights the possibility of a period of consolidation. In such conditions, range trading strategies might be considered, buying near support and selling near resistance, provided these levels hold. However, the strong ADX values on the 1-hour and daily charts suggest that the market is trending, making range-bound strategies riskier. It's crucial to remember that probabilities are not certainties. Unexpected news, such as a sudden shift in Fed policy or a major regulatory development, could rapidly invalidate any scenario. Therefore, maintaining flexibility, managing position sizes prudently, and employing stop-losses are non-negotiable practices for navigating these choppy waters.
Frequently Asked Questions: ETHUSD Analysis
What happens if ETHUSD breaks below the $1,703.04 support level?
If ETHUSD closes decisively below $1,703.04, it signals a continuation of the bearish trend, likely triggering further selling pressure. The next significant support levels to watch would be $1,697.59, followed by $1,691.88. This breakdown would strengthen the bearish scenario, making a move towards $1,600 more probable.
Should I buy ETHUSD at current levels of $1,705.00 given the oversold Stochastic on 1H?
Buying solely based on the oversold Stochastic on the 1-hour chart at $1,705.00 is a high-risk strategy given the dominant bearish trend on higher timeframes. While a short-term bounce is possible, the probability of the trend continuing is higher (65%). A more prudent approach would be to wait for confirmation, such as a break above $1,730.59, or to enter on a confirmed bounce from a lower support level with strict risk management.
Is the RSI at 41.19 a sell signal for ETHUSD right now?
An RSI of 41.19 on the 1-hour chart is not a direct sell signal in itself; it indicates bearish momentum but is still within the neutral territory (below 50). However, when combined with other bearish indicators like negative MACD momentum and price trading below the middle Bollinger Band, it reinforces the prevailing bearish sentiment. It suggests that upside potential is limited and that selling rallies might be a more viable strategy until key resistance levels are decisively broken.
How will the DXY at 100.9 affect ETHUSD this week?
The current DXY level of 100.9 indicates a strong US Dollar, which typically exerts downward pressure on risk assets like ETHUSD. This correlation suggests that as long as the DXY remains strong or continues to rise, ETHUSD will likely face headwinds, potentially pushing it towards lower support levels. A significant drop in the DXY would be required to alleviate this pressure and support a bullish move for ETHUSD.
Conclusion: Patience and Preparation in a Bearish Climate
The current market environment for ETHUSD at $1,705.00 is characterized by significant headwinds. The strengthening US Dollar, coupled with a risk-off sentiment across global markets, is exerting considerable downward pressure. Technically, the bearish trend is well-established on multiple timeframes, with key support levels being tested. While the crypto-specific fundamentals offer some long-term promise, they are currently insufficient to counteract the macro-driven selloff. For traders, this period demands patience and meticulous risk management. Focusing on clear technical setups, such as waiting for a breakdown below support or a decisive break above resistance, will be crucial. The probabilities suggest a higher likelihood of further downside, but the market always presents opportunities, even in a downturn. By adhering to a disciplined trading plan and staying informed about both macro and crypto-specific developments, investors can better navigate the current volatility and position themselves for future market movements.
Track markets in real-time
AI-powered analysis, technical indicators and real-time price data.
Join Our Telegram Channel
Breaking market news, AI analysis and trading signals instantly.
Join Channel