This past week, silver, or XAGUSD as we track it, has undeniably been on the back foot. The price action has painted a clear picture of bearish momentum, pushing the metal down to trade around the critical $64.84 mark. For traders who have been meticulously following the XAGUSD chart, this isn't entirely surprising. The consistent pressure from the US Dollar Index (DXY), which has shown strength, coupled with a general risk-off sentiment that often accompanies equity market jitters, has created a challenging environment for precious metals. Having closely monitored silver through various market cycles, I've seen how these macro forces can converge to dictate short-term price direction. The question on everyone's mind now is whether this slide is a precursor to a deeper correction or if current levels present a potential inflection point for a recovery. The technical indicators, while leaning bearish, offer a nuanced view that requires careful interpretation.
- Silver (XAGUSD) is trading at $64.84, with the 1-day RSI at 36.86 indicating bearish pressure.
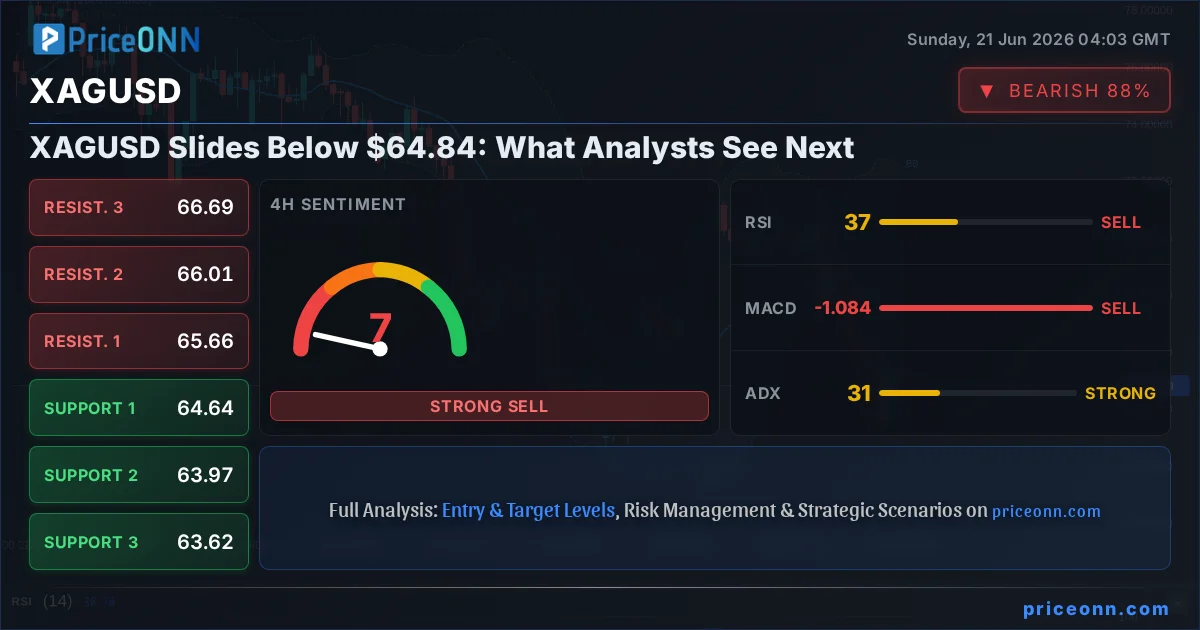
- Critical support sits at $63.88, tested multiple times this week; a break below could signal further downside.
- The ADX at 30.31 on the daily chart confirms a strong downtrend, suggesting momentum is firmly with sellers.
- DXY strength and broader market risk aversion are contributing factors to XAGUSD's current weakness.
Navigating the Bearish Tide: Technical Indicators in Focus
The daily chart for XAGUSD presents a stark picture of bearish dominance. With the price currently hovering around $64.84, the daily Relative Strength Index (RSI) at 36.86 clearly signals that sellers are in the driver's seat. This isn't an extreme oversold condition, but it firmly places silver in bearish territory, suggesting room for further downside before any significant buying pressure might emerge. The Moving Average Convergence Divergence (MACD) indicator further corroborates this narrative, showing negative momentum with the MACD line consistently below its signal line. This suggests that recent price action has been characterized by selling pressure rather than buying enthusiasm. The Bollinger Bands, too, are aligned with the bearish trend, with the price trading below the middle band, indicating a downward bias and potential for the price to test the lower band if the selling pressure intensifies. The Average Directional Index (ADX) at 30.31 on the daily timeframe is particularly noteworthy. An ADX reading above 25 typically signifies a strong trend, and at 30.31, it confirms that the current downtrend in silver is robust and well-established. This suggests that any short-term bounces are likely to be met with renewed selling interest, and breaking out of this trend will require significant conviction from buyers.
The Stochastic Oscillator, with K at 42.17 and D at 46.91, also leans bearish, showing the %K line below the %D line. This crossover often precedes further downward movement, especially when occurring in conjunction with other bearish signals. The confluence of these indicators – a bearish RSI, negative MACD momentum, price below the Bollinger middle band, and a strong ADX – creates a compelling technical case for continued weakness in silver. For traders, this means that the immediate outlook is tilted towards downside risk, and any trading strategies should account for this prevailing sentiment. The support levels at $63.88, $62.07, and $61.18 are crucial watchpoints. A decisive break below the $63.88 support could open the door to a rapid decline towards $62.07, and potentially even $61.18 if market conditions become particularly distressed. Conversely, resistance is building around $68.66, $71.63, and $73.44 – levels that seem distant given the current momentum but could become relevant if a significant shift in market sentiment occurs.

The strong ADX reading of 30.31 on the daily chart is a significant signal. It indicates that the current downtrend is not merely a minor fluctuation but a well-established market movement. Traders should exercise caution and avoid attempting to catch falling knives without clear confirmation of a trend reversal. The current price of $64.84 is precariously close to the first daily support level, making it a pivotal point to watch.
The Dollar's Shadow: Macro Factors Weighing on Silver
While the technical picture for XAGUSD is bearish, it's crucial to understand the underlying macroeconomic currents driving this sentiment. The US Dollar Index (DXY) has been on a steady ascent, currently trading around 100.82. Historically, a stronger dollar tends to exert downward pressure on commodities priced in dollars, including silver. When the dollar strengthens, it makes silver more expensive for holders of other currencies, potentially dampening demand. Furthermore, the recent hawkish undertones from the Federal Reserve, as indicated by market repricing and comments suggesting a potentially longer period of higher interest rates, have bolstered the dollar's appeal. This is particularly relevant given the recent news flow. Reports suggest that the Fed's stance is becoming more resolute, with market participants increasingly factoring in the possibility of further rate hikes. This prospect of higher borrowing costs globally generally weighs on non-yielding assets like gold and silver, as the opportunity cost of holding them increases relative to interest-bearing assets. The news that the Fed is repricing markets for potentially more hikes and the dollar's subsequent strength are direct headwinds for silver.
Beyond the dollar's strength, broader market sentiment plays a pivotal role. The recent performance of major equity indices like the S&P 500 and Nasdaq, which have shown signs of weakness and volatility, often translates into a risk-off environment. In such periods, investors tend to flee riskier assets and seek refuge in safe-haven assets. While gold is traditionally considered the primary safe haven, silver can also benefit, though its industrial demand component makes it more sensitive to global economic growth prospects. Currently, with concerns about global economic slowdown and the impact of higher interest rates, the demand for industrial commodities, including silver, might be tempered. The news regarding India's order for strategic oil reserve expansion, while related to energy markets, indirectly points to underlying concerns about supply stability and potential inflationary pressures, which can sometimes support precious metals. However, the dominant narrative currently is one of dollar strength and tightening monetary policy, which are more potent forces suppressing silver prices in the short to medium term. The interplay between these factors – a strong dollar, hawkish Fed expectations, and a cautious risk appetite – creates a challenging technical environment for XAGUSD, pushing it towards the lower end of its recent trading ranges.
Multi-Timeframe Analysis: Short-Term Signals vs. Long-Term Trend
To fully grasp the XAGUSD's predicament, a multi-timeframe analysis is essential. On the shorter timeframes, like the 1-hour chart, the picture is somewhat mixed, offering glimpses of potential short-term fluctuations. Here, the RSI at 39.43 hovers in neutral territory, showing a slight bearish inclination but not yet extreme. The MACD is showing positive momentum, with the MACD line above the signal line, suggesting some short-term buying interest. However, the Bollinger Bands are below the middle band, indicating a bearish bias even on this shorter timeframe. The Stochastic Oscillator's %K line (28.67) being below its %D line (51.09) provides a bearish signal, hinting at potential further downside in the immediate hours. The ADX at 35.02, however, points to a strong trend, reinforcing the idea that even short-term moves are occurring within a larger bearish framework. The overall signal on the 1-hour chart leans towards 'SELL', with 7 sell signals against 1 buy signal.
Stepping out to the 4-hour timeframe, the bearish sentiment becomes more pronounced. The RSI at 36.78 continues to trend downwards, and the MACD exhibits negative momentum, with the MACD line below its signal line. The Bollinger Bands are also below the middle band, reinforcing the bearish outlook. The Stochastic Oscillator here shows a rising %K line above the %D line (22.1 vs 10.25), which could signal a potential short-term bounce, but this is occurring within a generally bearish context. Crucially, the ADX at 32.07 still indicates a strong downtrend. The overall signal on the 4-hour chart is a strong 'SELL', with 7 sell signals and only 1 buy signal, mirroring the conviction seen on the daily timeframe. This divergence between the short-term stochastic signal and the broader trend indicators highlights the complexity of the current market. While a brief snap-back rally is possible on the 1-hour chart, the dominant trend on the 4-hour and daily charts suggests that any such moves are likely to be temporary and met with selling pressure. The daily trend is unequivocally bearish, with an 83% strength rating, further underscoring the prevailing sentiment in the market. This multi-timeframe perspective is critical for traders; it suggests that while short-term traders might look for small counter-trend opportunities, the broader strategy should align with the prevailing bearish trend.
While the 1-hour chart shows some mixed signals with positive MACD momentum, the stronger bearish signals from the 4-hour and daily charts, particularly the ADX readings, suggest that the overall trend remains firmly to the downside. Traders should be cautious of attempting to fight this established trend without clear confirming signals on lower timeframes.
Key Levels to Watch: The Battle for $64.84 and Beyond
The current price of $64.84 for XAGUSD is not just another number; it represents a critical juncture where short-term price action is being heavily influenced. On the 1-hour chart, the immediate resistance is identified at $64.64, followed by $64.78 and $64.88. A move above these levels would suggest a temporary reprieve for the bulls, but the overarching trend remains a concern. The support levels on this shorter timeframe are clustered around $64.40, $64.30, and $64.16. These are the immediate danger zones if the selling pressure resumes. However, the more significant levels are those identified on the daily chart, which paint a clearer picture of the broader trend. The first daily support level is at $63.88. A break below this level would be a strong bearish signal, potentially triggering a cascade of selling towards the next support at $62.07. This $63.88 level has been a key area of contention throughout the week, and its failure to hold could mark a significant escalation of the bearish trend. The subsequent support at $61.18 would then come into play as the next major target for sellers.
On the resistance side, the daily chart shows the first major hurdle at $68.66. For any bullish reversal to gain traction, XAGUSD would need to decisively break above this level. This would require overcoming not only the immediate selling pressure but also a potential shift in broader market sentiment and dollar weakness. The subsequent resistance levels at $71.63 and $73.44 appear quite distant given the current market conditions. It's essential to remember the context provided by other markets. The DXY's strength around 100.82 continues to act as a drag on silver. If the DXY were to falter, perhaps due to shifting Federal Reserve expectations or a significant geopolitical event, it could provide some relief for XAGUSD. However, without such catalysts, the path of least resistance for silver appears to be downwards, with the $63.88 support level serving as the immediate line in the sand. Traders should be closely watching how price reacts around these levels, as they will likely dictate the short-to-medium term trajectory of XAGUSD.
Trade Scenarios: Charting the Path Forward for XAGUSD
Bearish Scenario: Downside Momentum Persists
65% ProbabilityNeutral Scenario: Consolidation Around $64.84
25% ProbabilityBullish Scenario: Reversal Attempt at Key Support
10% ProbabilityEconomic Calendar Watchlist: Key Events Shaping Silver's Week
Looking ahead, several key economic events could influence XAGUSD's trajectory. The upcoming week will see crucial data releases that could either reinforce the current bearish narrative or provide a catalyst for a reversal. Investors will be closely monitoring the US Personal Consumption Expenditures (PCE) price index data, which is a favored inflation gauge by the Federal Reserve. Following the hawkish signals from the Fed, a higher-than-expected PCE reading could further solidify expectations of continued monetary tightening, strengthening the dollar and putting additional pressure on silver. Conversely, a softer inflation print might lead to a reassessment of Fed rate hike expectations, potentially weakening the dollar and offering some respite to XAGUSD. The news regarding the Fed's hawkish tilt and the market's repricing of interest rate expectations remains a dominant theme that will be closely watched in conjunction with these inflation figures.
Furthermore, Purchasing Managers' Index (PMI) data from both the US and Europe will be released, offering insights into the health of the manufacturing and services sectors. Stronger-than-expected PMIs could bolster global growth optimism, potentially increasing industrial demand for silver. However, if these figures disappoint, they could exacerbate risk-off sentiment, benefiting the dollar at silver's expense. The Forex market news highlighted the dollar's dominance as markets look past certain geopolitical setbacks, suggesting that macroeconomic data, particularly inflation and growth figures, will be paramount in dictating currency movements and, by extension, silver prices. Traders should also keep an eye on any geopolitical developments, especially those related to energy markets, as highlighted by India's strategic oil reserve expansion. While not directly impacting silver, significant geopolitical tensions can sometimes lead to broader market volatility and safe-haven flows, which could indirectly affect XAGUSD. The key is to monitor how these events interact with the established technical downtrend and the prevailing dollar strength.
The upcoming PCE inflation data and PMI figures are critical for XAGUSD. A hawkish Fed narrative, coupled with strong dollar trends, means that any data pointing to persistent inflation or robust economic activity could further pressure silver, while signs of cooling inflation or economic slowdown might offer a reprieve.
FAQ: Decoding XAGUSD's Current Market Position
Frequently Asked Questions: XAGUSD Analysis
What happens if XAGUSD breaks below the $63.88 support level?
A decisive break below the $63.88 support level would strongly confirm the bearish trend, potentially triggering further selling pressure. Invalidation of this support could quickly lead to targets at $62.07 and subsequently $61.18 as momentum accelerates to the downside.
Is the current RSI of 36.86 a sell signal for XAGUSD at $64.84?
An RSI of 36.86 on the daily chart indicates bearish momentum, but not an extreme oversold condition. While it suggests selling pressure, it's not an immediate buy signal for a reversal. Traders should look for confirmation from other indicators and price action before considering any counter-trend trades.
How will the strong DXY at 100.82 affect XAGUSD's outlook this week?
The current strength of the US Dollar Index (DXY) at 100.82 acts as a significant headwind for XAGUSD. A stronger dollar makes silver more expensive for international buyers, contributing to the bearish pressure and making a sustained rally in silver less likely without a notable dollar pullback.
What is the outlook for XAGUSD if the upcoming PCE inflation data shows cooling?
If upcoming PCE inflation data shows cooling, it could ease expectations of further Fed rate hikes, potentially weakening the dollar and offering some relief to XAGUSD. This scenario might see silver testing resistance levels around $68.66, but a sustained bullish move would likely require more than just a single data point.
| Indicator | Value | Signal | Interpretation |
|---|---|---|---|
| RSI (14) | 36.86 | Bearish | Below 50, downtrend momentum |
| MACD Histogram | -0.45 | Bearish | Negative momentum confirmed |
| Stochastic | K:42.17, D:46.91 | Bearish | %K below %D, downtrend signal |
| ADX | 30.31 | Bullish Trend Strength | Strong trend indicated |
| Bollinger | Middle Band | Below Middle Band | Price trending downwards |
Track markets in real-time
AI-powered analysis, technical indicators and real-time price data.
Join Our Telegram Channel
Breaking market news, AI analysis and trading signals instantly.
Join Channel