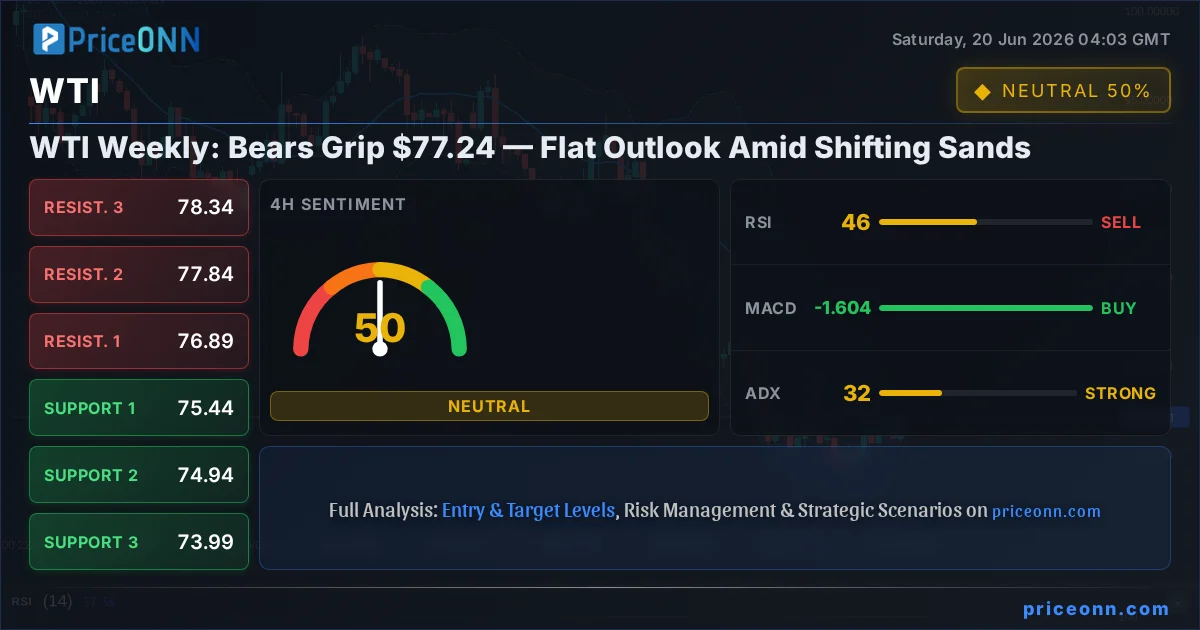
Last Friday, the crude oil market found itself at a critical juncture. WTI, the West Texas Intermediate benchmark, closed the week hovering precariously around the $77.24 mark. This level, a confluence of previous support and current psychological resistance, represents a pivotal point. The question on many traders' minds is whether the bears have truly established a firm grip, or if this is merely a pause before the next significant move. Having tracked WTI's intricate dance with global supply dynamics and geopolitical undercurrents for years, I see a market grappling with conflicting signals, suggesting a period of consolidation rather than a decisive directional shift in the immediate term.
- WTI is trading at $77.24, with the 1H chart showing a strong downtrend (ADX 32.8) and the 1D chart indicating a powerful downtrend (ADX 36.72).
- Critical support sits at $76.84 (1H), tested multiple times this week, while resistance looms at $80.51 (1H).
- RSI at 61.31 (1H) signals rising momentum, but the 1D RSI at 32.4 suggests a potential oversold condition is approaching.
- The market sentiment favors the US Dollar (DXY at 100.85, showing upward momentum), potentially pressuring oil prices.
The past week presented a complex tapestry of price action for WTI crude. While the daily timeframe chart, according to our data, paints a picture of a dominant downtrend with an ADX reading of 36.72, the shorter timeframes offer a more nuanced view. The 1-hour chart, for instance, shows a strong downtrend with an ADX of 32.8, yet the RSI at 61.31 suggests rising momentum. This divergence between trend strength indicators and momentum oscillators is precisely where careful analysis becomes paramount. It highlights that while a broader bearish trend might be in play on the daily, intraday trading dynamics are far from one-sided. The price action around the $77.24 level has been particularly telling, with multiple attempts to push higher being met by renewed selling pressure, indicative of a market that is hesitant to commit to a clear direction without further catalysts.
The Tug-of-War at $77.24
The $77.24 price point is not just an arbitrary number; it represents a significant psychological and technical barrier. Looking at the 1-hour data, we see immediate resistance identified at $80.51, $80.76, and $81.11. Conversely, support is clustered around $79.91, $79.56, and $79.31. However, the broader daily timeframe places key support much lower, at $77.30, $75.19, and $73.84. This wide gap between short-term and long-term support levels underscores the current indecision. The fact that WTI is trading near the upper end of its daily support range while struggling to break through its short-term resistance at $80.51 suggests that sellers are active in the upper bounds, while buyers are hesitant to step in aggressively at these levels, perhaps waiting for a more definitive dip towards the lower daily support zones.
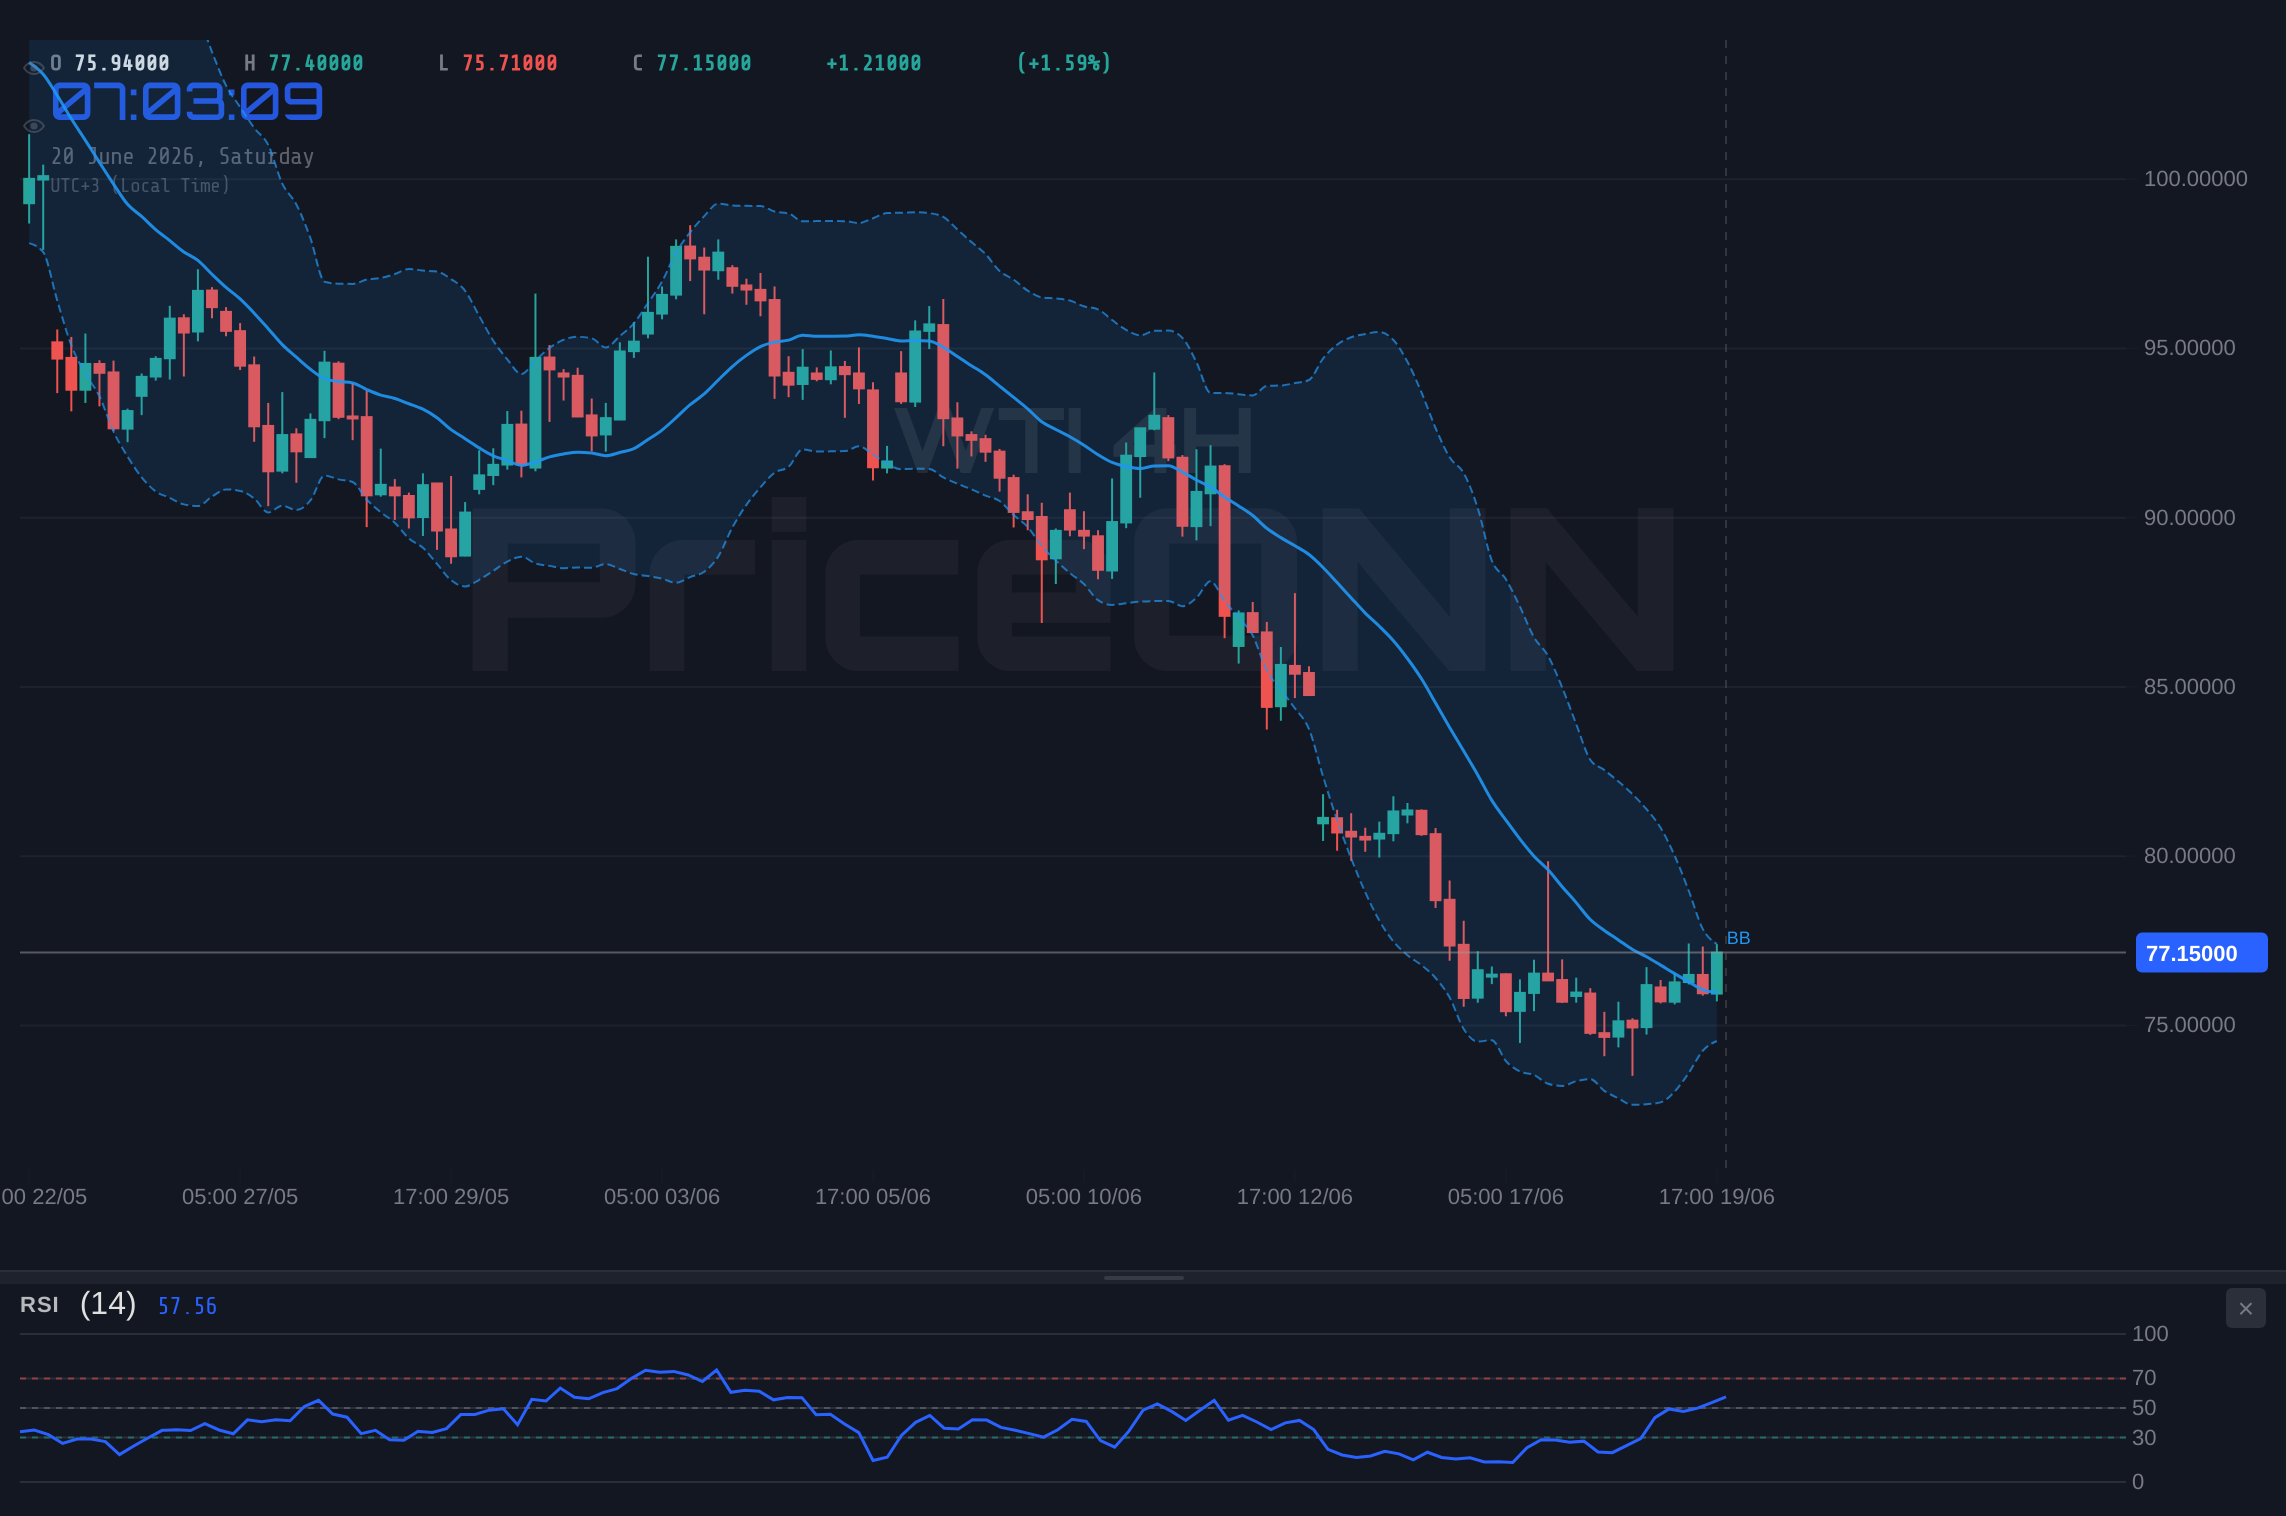
The intraday trading on Friday, for example, saw WTI rally towards $77.42 before encountering selling pressure that pushed it back down. This pattern repeated several times, indicating a lack of conviction from either bulls or bears to force a significant breakout. The ADX indicator, a measure of trend strength, shows a strong downtrend on the daily (ADX: 36.72) and 4-hour (ADX: 31.81) charts, but the 1-hour chart’s ADX at 32.8 also reinforces this. However, the RSI readings present a conflicting narrative. On the 1-hour chart, RSI is 61.31, suggesting upward momentum, while on the daily chart, it sits at 32.4, indicating a move towards oversold territory. This interplay of indicators is crucial; it suggests that while the overall trend might be down, there are intraday opportunities and potential for short-term bounces, or conversely, the daily oversold condition could be nearing a point where buyers might step in more forcefully.
Furthermore, the broader market context cannot be ignored. The US Dollar Index (DXY) is currently at 100.85, with its 1-hour and 4-hour charts showing upward momentum and strong trend strength respectively (ADX 38.71 and 45). A strengthening dollar typically exerts downward pressure on dollar-denominated commodities like oil, as it makes them more expensive for holders of other currencies. This correlation suggests that any sustained rally in the DXY could act as a headwind for WTI prices. Conversely, if the DXY falters, it could provide some relief to oil bulls. The current DXY trend, despite a slight daily pullback, indicates dollar strength remains a dominant theme, which is a bearish signal for WTI.
Navigating the Indicator Maze: Signals and Noise
Diving deeper into the technical indicators, we see a mixed bag that requires careful interpretation. On the 1-hour chart, the Stochastic oscillator (K=81.23, D=51.11) is showing a bullish signal, with the %K line above the %D line, suggesting upward momentum is building in the very short term. This aligns somewhat with the RSI(14) at 61.31, which, while not yet overbought, indicates a positive bias. However, the MACD on the 1-hour chart shows positive momentum with the MACD line above the signal line, but the Bollinger Bands are showing the price moving below the middle band, indicating a bearish tendency within this timeframe. This conflict is typical in choppy markets where short-term trends are battling against a larger, more established trend.
When we shift to the daily timeframe, the picture darkens considerably for the bulls. The RSI(14) at 32.4 is approaching oversold territory, which might suggest a potential for a bounce, but it is not yet a definitive buy signal. The MACD is firmly in negative momentum territory, with the MACD line below the signal line, reinforcing the bearish outlook. The Bollinger Bands are also indicating a bearish trend, with the price trading below the middle band. The Stochastic oscillator (K=11.73, D=9.8) is deep in oversold territory, and while this can signal a potential reversal, it can also persist in oversold conditions during strong downtrends. The ADX at 36.72 on the daily chart confirms a strong downtrend is in place. This strong trend reading suggests that any short-term bullish signals from shorter timeframes or oversold oscillators should be treated with extreme caution, as the underlying trend remains firmly bearish.
The 4-hour timeframe offers a bridge between these conflicting signals. Here, the ADX at 31.81 still indicates a strong downtrend, but the RSI at 45.71 is more neutral than the daily reading. The MACD shows negative momentum, and the Bollinger Bands are below the middle band, consistent with the daily bearish bias. However, the Stochastic oscillator (K=78.01, D=54.64) is showing a bullish signal, and the price is above the middle band, suggesting a potential for a short-term upward move. This conflicting data across timeframes highlights the difficulty in calling a precise short-term direction. The market is essentially stuck between the gravitational pull of the established daily downtrend and the potential for short-term bounces driven by intraday momentum or oversold conditions.
The Geopolitical Undercurrents and Supply Side Story
Beyond the charts, fundamental factors continue to shape the WTI narrative. Recent news indicates that India has ordered a major expansion of its strategic oil reserves, a move that could increase demand for crude in the medium term. However, this is counterbalanced by reports suggesting that WTI Crude Oil may struggle to recover as sellers remain active, with a major bearish trend line forming resistance. This implies that immediate supply-side dynamics and seller sentiment are currently outweighing potential future demand increases. The ongoing geopolitical tensions, while not currently flaring up into major supply disruptions, always present a background risk that could quickly shift the market's focus.
The recent commentary from commodity analysts suggests a cautious outlook. While the AI revolution is creating demand for electricity, which indirectly impacts oil markets, the immediate bottleneck for AI is not metals but energy infrastructure itself. This suggests that while long-term energy demand might be supported by technological shifts, the current market is more sensitive to immediate supply-demand balances and macroeconomic headwinds. The fact that Canada's headline inflation is expected to edge higher, while core inflation remains near target, adds another layer of complexity. Central bank policies, particularly those of the US Federal Reserve, remain a key driver. FX forecasts suggest USD strength is expected to extend, aided by Fed repricing, which, as mentioned, typically weighs on oil prices. This macro backdrop of a strong dollar and active sellers reinforces the bearish sentiment observed in the technicals.
Furthermore, the UK jobs market has shown mixed signals, with growth stalling and wage pressures easing slightly. While seemingly unrelated, these indicators contribute to the global economic sentiment. A cooling labor market in a major economy could signal broader economic weakness, which would translate into lower oil demand expectations. The overall theme emerging from these fundamental factors is one of caution: potential demand support from strategic reserve building is being overshadowed by immediate selling pressure, a strong US dollar, and concerns about global economic growth. This complex interplay of factors leaves WTI in a precarious position, susceptible to sharp moves based on incoming data and geopolitical headlines.
Bearish Scenario: Sellers Reinforce Grip
65% ProbabilityNeutral Scenario: Consolidation Around $77.24
25% ProbabilityBullish Scenario: Short-Term Bounce
10% ProbabilityThe technical indicators across multiple timeframes paint a rather consistent picture of a market under pressure, though not without potential for short-term fluctuations. On the daily chart, the ADX at 36.72 screams strong downtrend, a sentiment echoed by the MACD and Bollinger Bands. However, the RSI at 32.4 is inching towards oversold territory, and the Stochastic oscillator is deeply oversold at K=11.73. This suggests that while the trend is down, the downside might be becoming exhausted in the longer term. On the 1-hour chart, the picture is more mixed, with rising RSI (61.31) and positive MACD momentum, but Bollinger Bands sitting below the middle band and a strong ADX (32.8) still point to bearish control. This conflict suggests that any upward moves might be met with selling pressure as traders attempt to fade rallies against the dominant daily downtrend, or conversely, that the daily oversold condition could eventually trigger a bounce if key intraday levels hold.
The correlation with the DXY is a significant factor here. With the DXY at 100.85 and showing strong upward momentum on the 4-hour (ADX 45) and daily (ADX 32.38) charts, the path of least resistance for WTI is likely downward, assuming this dollar strength persists. The news flow, while mixed, leans towards caution. India's strategic reserve expansion is a demand positive, but the active sellers and bearish trend line resistance reported elsewhere suggest immediate supply concerns or macro headwinds are dominating sentiment. The fact that WTI crude oil may struggle to recover as sellers stay active, coupled with the expectation of continued USD strength aided by Fed repricing, paints a picture where upside potential is limited in the short to medium term.
From a trading perspective, this environment calls for patience and a focus on risk management. The wide gap between the 1-hour support ($79.31) and the daily support ($77.30) indicates that a breakdown of the current intraday range could lead to a swift move lower. Conversely, any sustained push above the $80.51 resistance on the 1-hour chart would require significant conviction and likely a shift in broader market sentiment or a significant geopolitical event. The current readings suggest that the most probable outcome in the near term is continued choppiness around the $77.24 level, with a potential bias towards the downside given the prevailing daily trend and dollar strength. Traders should be looking for clear breaks of key levels with confirming volume and momentum to guide their positions, rather than trying to anticipate a reversal against strong technical trends.
The energy market is always a delicate balance of supply, demand, and geopolitical risk. Currently, the supply side appears relatively stable, with OPEC+ adhering to production quotas, but spare capacity remains a concern. Demand, however, is facing headwinds from a strengthening dollar and potential global economic slowdown fears, despite the long-term AI-driven energy demand narrative. The technical picture reinforces this caution, with daily charts screaming 'downtrend' while shorter timeframes show signs of consolidation or potential short-term bounces. This makes the $77.24 level a critical pivot. A break below it could accelerate selling towards $75.19, while a strong hold and subsequent push above $79.31 might signal a temporary reprieve. Until a clearer directional signal emerges, characterized by sustained moves above key resistance or decisive breaks below support with confirming indicators, caution is the prudent approach. The market is waiting for a definitive catalyst, be it a shift in Fed policy, a major geopolitical development, or a significant change in global growth expectations.
Frequently Asked Questions: WTI Analysis
What happens if WTI breaks below the $77.30 daily support level?
A break below the $77.30 daily support level, reinforced by strong downtrend signals like an ADX above 30 and negative MACD momentum, would likely trigger further selling pressure. The next key support levels to watch would be $75.19 and then $73.84, suggesting a potential downside target of over $3-$4 from the current price.
Should I consider buying WTI at current levels of $77.24 given the daily RSI is at 32.4?
While the daily RSI at 32.4 suggests WTI is approaching oversold territory, it is not a direct buy signal, especially with a strong downtrend indicated by ADX 36.72. A more prudent approach would be to wait for confirmation, such as a hold above $77.30 and a subsequent break of intraday resistance at $79.31, or a clear bullish divergence on shorter timeframes before considering a long position.
Is the RSI at 61.31 on the 1-hour chart a bullish signal for WTI?
An RSI of 61.31 on the 1-hour chart indicates rising bullish momentum in the very short term. However, it must be viewed in context. With the daily chart showing a strong downtrend and the DXY strengthening, this intraday bullish signal might be a precursor to a fade rally rather than a sustained move higher. Confirmation through a break of key intraday resistance levels like $79.31 would be needed to validate any bullish intent.
How might the expected continued USD strength affect WTI prices this week?
Continued USD strength, as suggested by FX forecasts and the DXY's upward momentum (4-hour ADX 45), typically exerts downward pressure on dollar-denominated commodities like WTI. This macro headwind could limit upside potential for oil prices and increase the likelihood of sellers stepping in at higher levels, reinforcing the bearish trend observed on the daily chart.
Looking ahead, the WTI market remains at a critical juncture. The technical indicators present a conflicting picture, with strong daily downtrend signals battling against potential oversold conditions and intraday momentum. Key levels to watch remain the $77.30 daily support and the $79.31 intraday resistance. A decisive break of either, confirmed by volume and accompanying shifts in broader market sentiment, will likely dictate the next major move. Until then, expect continued volatility around the $77.24 mark. The interplay between dollar strength, geopolitical headlines, and shifting demand expectations will be crucial in determining whether the bears can solidify their grip or if a short-term relief rally can take hold. Traders should remain vigilant, focusing on risk management and waiting for clear signals rather than attempting to predict the unpredictable.
Track markets in real-time
AI-powered analysis, technical indicators and real-time price data.
Join Our Telegram Channel
Breaking market news, AI analysis and trading signals instantly.
Join Channel