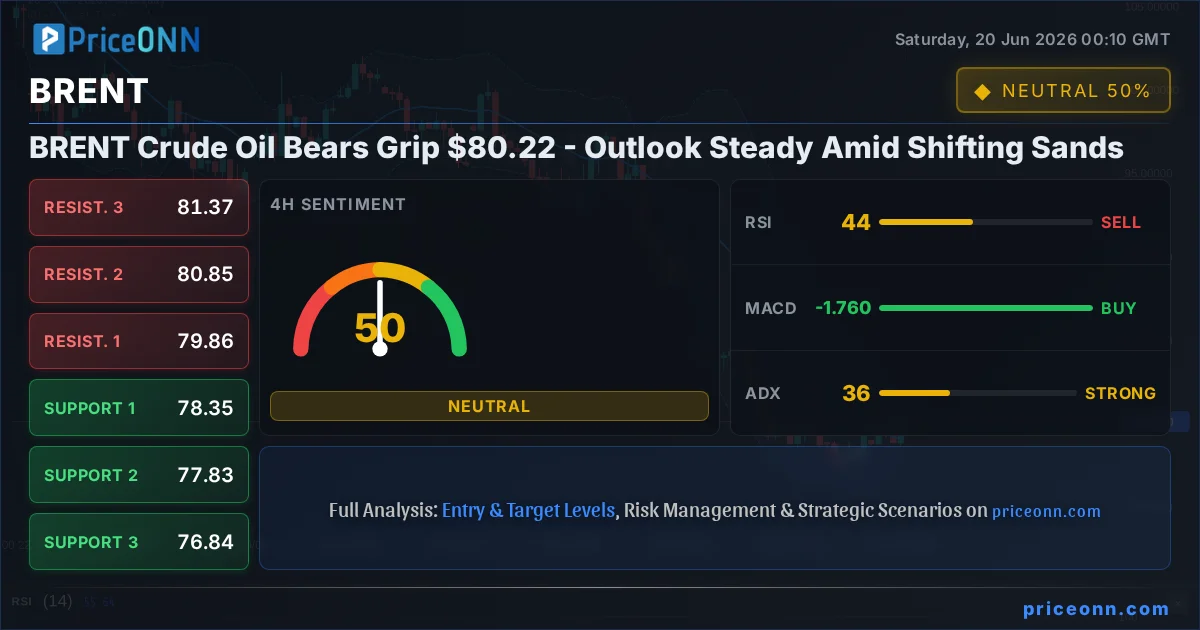
The persistent pressure on BRENT Crude Oil, with bears firmly holding the line around the critical $80.22 mark, paints a picture of cautious indecision in the energy markets. While the daily chart signals a prevailing downtrend with a 'Sat' (Sell) consensus across multiple indicators, the shorter timeframes offer a more nuanced view, hinting at potential consolidation or even a brief reprieve for bulls. This tug-of-war between supply-side narratives and demand-side uncertainties, further complicated by a fluctuating macroeconomic backdrop, suggests that the path forward for BRENT will likely be defined by a delicate balance of competing forces. Understanding the interplay between these elements is paramount for any trader navigating this complex landscape.
- RSI at 30.02 on the daily chart signals oversold conditions, but a strong downtrend (ADX: 26.45) suggests this may not be a reversal signal yet.
- Critical support for BRENT sits at $77.30, tested multiple times this week, while resistance looms at $80.76.
- The MACD histogram on the 1D chart shows negative momentum, indicating selling pressure persists, contradicting the oversold RSI.
- Fed rate expectations, currently pricing in a hawkish stance, are strengthening the DXY at 100.85, which typically puts downward pressure on commodities like BRENT.
Navigating the $80.22 Threshold: A Technical Tightrope Walk
The Daily Chart's Bearish Stance
Examining the daily chart for BRENT Crude Oil reveals a predominantly bearish sentiment, a narrative underscored by an overwhelming 'Sat' (Sell) signal from most technical indicators. The current price of $80.22 finds itself battling against a strong downtrend, evidenced by the Average Directional Index (ADX) registering a robust 26.45. This suggests that the prevailing downward momentum has significant strength. However, the Relative Strength Index (RSI) at 30.02 is hovering in oversold territory, a reading that typically signals a potential pause or reversal. This divergence between the RSI's oversold condition and the ADX's confirmation of a strong trend creates a pivotal point of analysis. It implies that while sellers are in control, the market might be approaching a level where exhaustion could set in, or conversely, where a breakdown could accelerate.
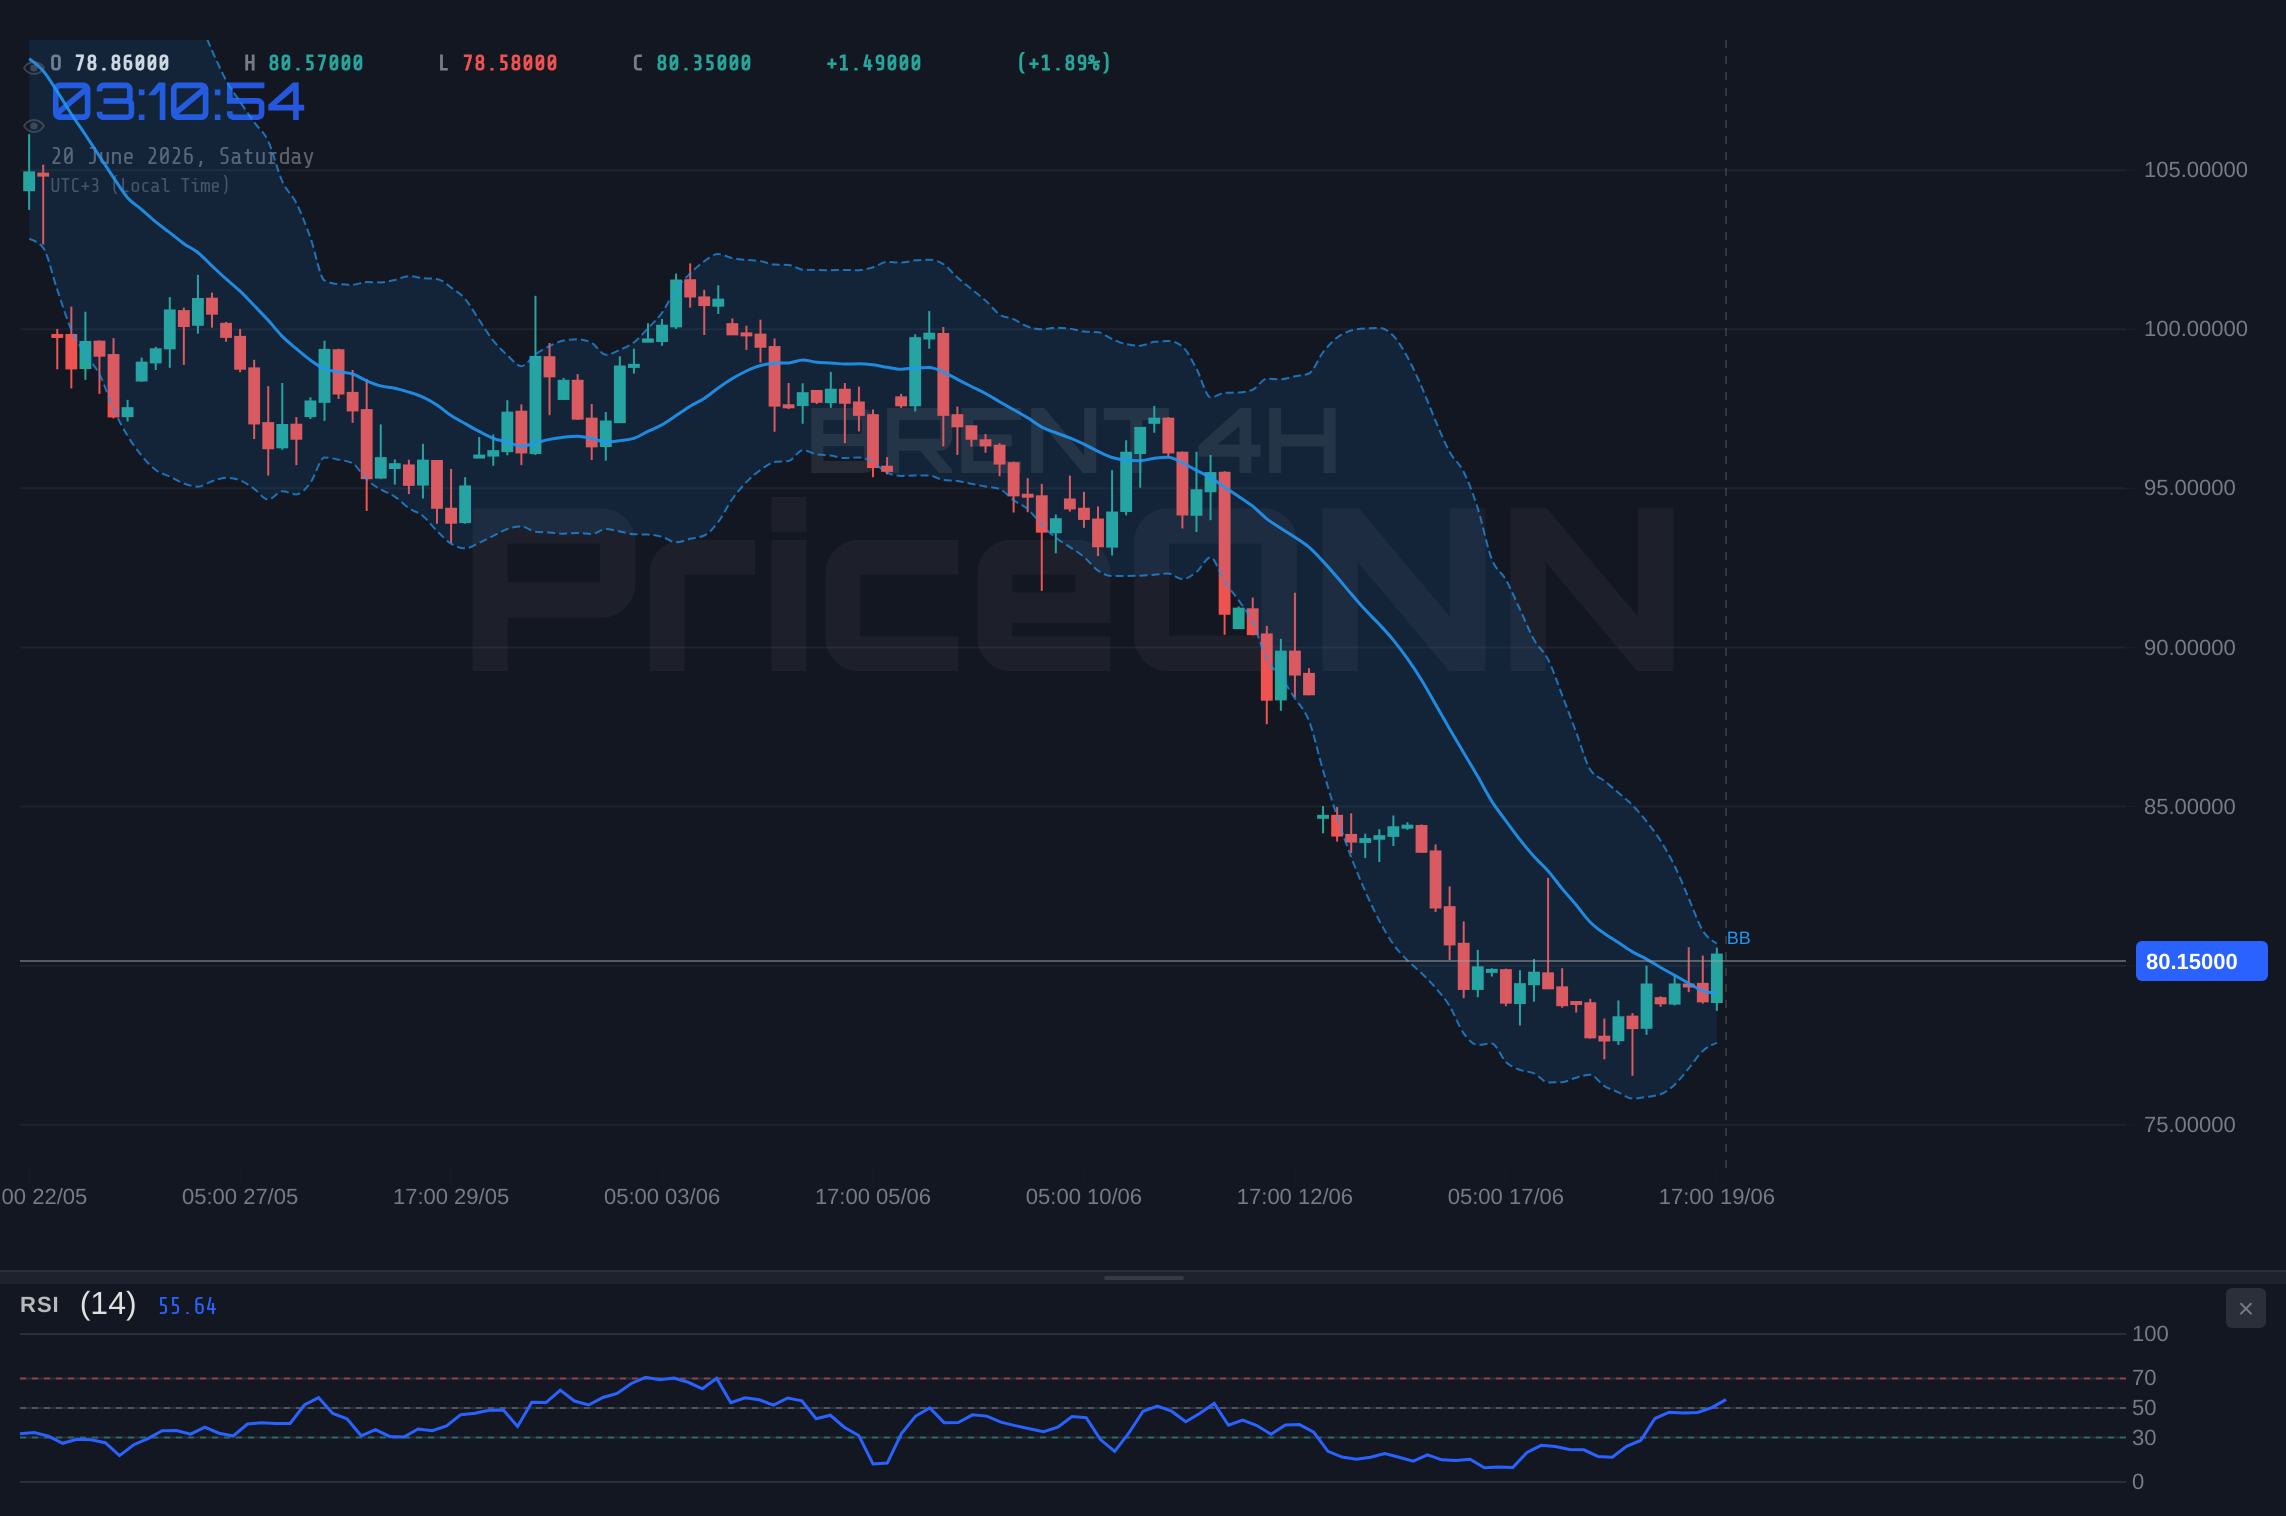
The Moving Average Convergence Divergence (MACD) histogram on the daily timeframe further reinforces the bearish outlook, exhibiting negative momentum. This means that the selling pressure, while potentially waning according to the RSI, is still structurally dominant. The Bollinger Bands, also on the daily chart, are positioned below the middle band, aligning with the downward trajectory and suggesting that the price action is adhering to the lower end of its recent range. This confluence of indicators paints a clear picture: the bears have the upper hand, but the oversold RSI acts as a potential warning sign for aggressive short-sellers, hinting that a bounce, even if temporary, is possible before any further significant downside.
Shorter Timeframes: Glimmers of Hope or False Signals?
Shifting our focus to the 1-hour and 4-hour charts, the narrative becomes less clear-cut. On the 1-hour chart, the sentiment leans towards 'Al' (Buy), with indicators like Stochastic showing a bullish crossover (%K > %D) and the MACD histogram displaying positive momentum, albeit with a weaker trend strength indicated by the ADX at 15.67. The RSI at 59.02 sits comfortably in neutral territory, suggesting room for upward movement. This shorter-term bullish signal, however, is juxtaposed against the broader daily trend. It suggests that any upward moves observed on the hourly chart might be short-lived counter-trend rallies within the larger bearish structure.
The 4-hour chart presents a more mixed bag. While the ADX at 35.63 still indicates a strong trend, the RSI at 44.27 is in neutral territory, and the MACD shows positive momentum. However, the Stochastic indicator is flashing a bullish signal (%K > %D), and the Bollinger Bands are above the middle band, hinting at a potential upward bias. Despite these mixed signals, the overall consensus on the 4-hour timeframe leans towards 'Nötr' (Neutral), reflecting the uncertainty. This suggests that while there might be intraday trading opportunities, the lack of a clear, sustained trend on this timeframe makes it difficult to establish a strong directional conviction. The key takeaway from these shorter timeframes is the potential for volatility and range-bound trading, rather than a clear trend continuation.
Key Levels: The Battleground at $80.22
The price action around $80.22 is more than just a number; it represents a critical psychological and technical battleground. On the daily chart, the immediate support level is identified at $77.30. This level has been tested and held during the past week, acting as a floor for the current price action. A decisive break below $77.30 would likely trigger further selling pressure, potentially targeting the next significant support at $75.19. Conversely, the immediate resistance stands at $80.76. This level has proven difficult to breach, acting as a ceiling that has capped recent upward attempts. A sustained move above $80.76, confirmed by increased volume and bullish momentum across multiple timeframes, could signal a shift in sentiment and open the door for a test of higher resistance levels, such as $82.11.
The interplay between these support and resistance levels, particularly the $80.22 current price, will dictate the short-to-medium term trajectory. A failure to hold $80.22 could see prices quickly testing $77.30, while a successful defense of this level, coupled with a break above $80.76, might initiate a short-covering rally. The market's reaction to these levels will be crucial. Traders will be closely watching for signs of capitulation on the downside or confirmation of strength on the upside, making these price points the focal points of the upcoming trading sessions.
Fundamental Undercurrents: Macroeconomic Crosscurrents and Geopolitical Ripples
The Dollar's Dominance and its Impact on Commodities
The strength of the US Dollar Index (DXY), currently trading at 100.85, is a significant factor influencing BRENT Crude Oil prices. The DXY's upward trend on the daily chart, supported by a strong ADX of 45 and RSI at 66.11, indicates a healthy risk appetite for the dollar. Historically, a strengthening dollar often correlates with a weakening of dollar-denominated commodities like oil, as they become more expensive for holders of other currencies. The current environment, where the Fed appears to be maintaining a relatively hawkish stance compared to other central banks, further supports the dollar's strength. This macro trend provides a headwind for BRENT, suggesting that any upward price movements might be capped by dollar appreciation unless other bullish factors for oil gain significant traction.
The correlation analysis highlights this inverse relationship. With the DXY at 100.85, and showing a strong upward trend on the daily chart, the pressure on BRENT is palpable. If the DXY continues its ascent, especially if it breaks above the 101.14 resistance on the daily chart, it could exacerbate the downward pressure on oil prices. Conversely, any significant pullback in the DXY could provide a much-needed tailwind for BRENT, potentially sparking a rally. Traders are therefore watching the DXY's movements as a key barometer for the broader commodity complex, including oil.
Inflation Expectations and Central Bank Tightrope
The persistent narrative around inflation, even as it shows signs of moderating in some economies, continues to cast a long shadow over central bank policy. While specific inflation data like Canada's CPI report for May is due, the general expectation is that underlying inflation remains sticky enough to keep central banks, particularly the US Federal Reserve, on a cautious path. The Fed's hawkish leanings, as reflected in Fed Fund Futures and OIS pricing, suggest that interest rate cuts might be slower or smaller than previously anticipated. This tightening bias contributes to dollar strength and can dampen global growth prospects, indirectly impacting oil demand.
The energy market itself is a significant contributor to inflation. Any upward pressure on oil prices, perhaps driven by geopolitical events or supply disruptions, could reignite inflation concerns, forcing central banks to maintain tighter monetary policies for longer. This creates a complex feedback loop. For BRENT, this means that while oversold conditions on shorter timeframes might suggest a bounce, the overarching macroeconomic environment, characterized by sticky inflation and a hawkish Fed, creates a ceiling for sustained rallies. The market is thus in a delicate balancing act, weighing immediate supply/demand dynamics against the longer-term implications of monetary policy.
Geopolitical Tensions: The Ever-Present Wildcard
The energy markets are perpetually sensitive to geopolitical developments, and recent events underscore this vulnerability. Reports of India ordering a major expansion of its strategic oil reserves, following supply crisis concerns, highlight the global focus on energy security. While this might suggest future demand, it also points to underlying anxieties about supply stability. The ongoing tensions in the Middle East, though not currently escalating dramatically, remain a background risk factor that could quickly impact oil prices. Any flare-up could trigger a 'flight to safety' not only in traditional safe havens like gold but also in oil, as traders price in potential supply disruptions.
Furthermore, the broader geopolitical landscape, including international relations and potential conflicts, creates an environment of uncertainty. This uncertainty can manifest as increased volatility in commodity markets. Even if specific events don't directly impact oil supply chains, the general risk-off sentiment they foster can lead to a reduction in speculative positions in riskier assets, including oil futures, or conversely, a surge in safe-haven demand for assets like gold, indirectly affecting oil's appeal. The 'BRENT Crude Oil: Decline Amid US–Iran Ceasefire' headline from PriceONN's news feed, though seemingly counterintuitive, might reflect a market pricing in reduced immediate escalation risk, but the underlying fragility remains. Traders must remain vigilant, as geopolitical events can shift market sentiment rapidly.
Market Correlates and Diversified Signals
Equities: Risk Appetite as a Barometer
The performance of major equity indices like the S&P 500 (SP500) and Nasdaq 100 (Nasdaq) provides a crucial insight into broader market sentiment, which in turn can influence BRENT Crude Oil. The S&P 500 is currently showing a mixed picture, with a strong daily uptrend (98% strength) but mixed signals on shorter timeframes. The Nasdaq 100, however, exhibits a more consistent uptrend across timeframes. A strong correlation often exists where rising equity markets signal increased risk appetite, potentially boosting demand for commodities like oil as economic activity picks up. Conversely, a significant sell-off in equities, particularly if driven by macroeconomic concerns like inflation or interest rate hikes, can signal a 'risk-off' environment, leading investors to shed commodity exposure.
Currently, the S&P 500 shows some divergence, with a bullish daily trend but conflicting signals on the 1H and 4H charts. The RSI at 70.95 on the 1H chart suggests overbought conditions, while the ADX at 49.72 indicates a strong trend. This mixed technical picture for equities mirrors the uncertainty in BRENT. If equities continue their upward trajectory, it could provide some support to oil prices. However, any significant downturn in the stock market, especially if accompanied by a rising DXY, would likely put further downward pressure on BRENT, as investors seek safety in traditional haven assets.
Bond Yields and Interest Rate Expectations
Treasury yields are another critical piece of the macroeconomic puzzle influencing commodity prices. Higher yields can make holding non-yielding assets like gold less attractive and can also signal expectations of tighter monetary policy, which could slow economic growth and reduce oil demand. The current market data doesn't provide specific bond yield figures, but the narrative around central bank policy, particularly the Fed's stance on inflation, strongly suggests that yields remain a key focus. If yields continue to climb, reflecting persistent inflation or a more hawkish Fed, this would create a challenging environment for BRENT.
The expectation of continued tight monetary policy from major central banks, driven by the need to combat inflation, directly impacts the cost of capital and economic growth forecasts. For oil, this means that sustained high yields could dampen demand expectations, acting as a drag on prices. Traders will be closely monitoring any shifts in yield curves or central bank commentary that might signal a change in their approach to inflation and interest rates. The interplay between yields, inflation data, and central bank actions will be a crucial determinant of oil's medium-term outlook.
Trader Perspectives: Strategies Across Timeframes
Scalpers and Day Traders: Riding the Intraday Waves
For scalpers and day traders, the current environment on BRENT presents opportunities within shorter timeframes, albeit with heightened risk. The mixed signals between the 1-hour and 4-hour charts suggest potential for range-bound trading or short-term trend plays. The 1-hour chart, showing a 'Buy' signal with positive MACD momentum and a bullish Stochastic crossover, might offer opportunities for quick trades targeting resistance levels around $80.76. However, the weak ADX (15.67) on this timeframe indicates a lack of strong conviction, meaning these trades would need to be executed with tight stop-losses, perhaps just below the intraday support at $80.51 or even tighter at $80.22 itself. The key is to capture small, rapid moves and exit quickly before the larger bearish trend reasserts itself.
The 4-hour chart's 'Neutral' signal, with its own set of conflicting indicators, further supports a short-term, range-trading approach. Scalpers might look to buy near the support at $79.86 and sell near the resistance at $80.85, always mindful of the overarching daily downtrend. The crucial element for these traders is to manage risk aggressively. Given the prevailing bearish daily trend, any long positions initiated on shorter timeframes should be treated with extreme caution, and scalpers should be prepared to exit immediately if price action on the 1-hour or 4-hour charts starts to break down towards the daily support levels.
Swing Traders: Patience in the Bearish Current
Swing traders, who typically hold positions for days to weeks, face a more challenging environment. The dominant daily downtrend on BRENT Crude Oil necessitates a bearish bias. The primary strategy here would involve looking for opportunities to short the market on pullbacks towards resistance levels. The resistance at $80.76 is the immediate target for such a strategy. If BRENT rallies towards this level and shows signs of stalling – perhaps with bearish divergence on the RSI or a MACD crossover to the downside on the 4-hour chart – it could present a high-probability short entry. The invalidation for such a trade would be a clear, sustained break above $80.76, ideally with strong volume.
Alternatively, swing traders might wait for a confirmed break of the daily support at $77.30. A break below this level, especially if accompanied by increased selling volume and negative momentum across multiple timeframes, could signal the next leg down towards $75.19. However, given the current oversold RSI on the daily chart, entering short on a breakdown requires careful consideration. It might be prudent to wait for a retest of the broken support level ($77.30) as new resistance before initiating a short position, confirming that the bears have indeed taken control. Patience is key, as forcing trades in a consolidating or trending market without clear confirmation can lead to losses.
Long-Term Investors: Assessing Fundamental Value and Risk
For long-term investors, the current price action around $80.22 is less about short-term fluctuations and more about assessing fundamental value and strategic positioning. The ongoing geopolitical risks, the global push towards energy transition, and the cyclical nature of commodity markets all play a role. While the daily technicals suggest a bearish bias, investors might view current levels as potentially attractive if they believe that underlying supply-demand fundamentals or geopolitical events could lead to a sustained price recovery in the medium to long term.
Key factors for long-term investors to monitor include OPEC+ production decisions, global economic growth forecasts (which directly impact oil demand), inventory levels, and the pace of the energy transition. Should geopolitical tensions escalate significantly, potentially disrupting supply routes or production facilities, prices could see a rapid surge, overriding current technical trends. Conversely, a global economic slowdown or a more aggressive shift towards renewable energy could exert long-term downward pressure. Investors might consider accumulating positions gradually if prices fall towards the lower support levels ($77.30, $75.19), viewing them as potential long-term entry points, contingent on a favorable fundamental outlook and a belief that current bearish technicals are temporary.
Key Scenarios for the Week Ahead
Bearish Scenario: The Bears Consolidate Below $80.22
65% ProbabilityNeutral Scenario: Range-Bound Consolidation
25% ProbabilityBullish Scenario: A Bounce from Oversold Levels
10% ProbabilityFrequently Asked Questions: BRENT Analysis
What happens if BRENT breaks below the $77.30 support level?
A decisive break below $77.30, particularly on the daily chart, would invalidate the current consolidation pattern and signal a continuation of the downtrend. This could lead to accelerated selling as traders react to the breach, potentially targeting the next significant support at $75.19. Confirmation would be key, looking for increased volume and bearish momentum across multiple timeframes.
Should I consider buying BRENT at current levels near $80.22 given the daily RSI at 30.02?
Buying solely based on a daily RSI of 30.02 at $80.22 would be a contrarian move against a strong daily downtrend (ADX: 26.45). While the oversold RSI suggests potential for a bounce, it's not a buy signal in isolation. A confirmation, such as a break above $80.76 resistance or a bullish divergence on shorter timeframes, would be necessary to justify a long position. Risk management is critical; a tight stop below current levels would be essential.
Is the MACD histogram at negative momentum a definitive sell signal for BRENT at $80.22?
The negative MACD histogram on the daily chart confirms the prevailing selling pressure and bearish momentum. While it aligns with the overall downtrend, it should be considered alongside other indicators. The oversold RSI creates a divergence, suggesting that the selling momentum might be weakening. Therefore, while it supports a bearish view, it doesn't guarantee further downside without confirmation, especially if price action starts to consolidate or bounce from support levels.
How will the strengthening DXY at 100.85 affect BRENT's outlook this week?
The strengthening DXY at 100.85, driven by hawkish Fed expectations, generally exerts downward pressure on dollar-denominated commodities like BRENT. This inverse correlation means that as the dollar gains strength, oil prices tend to fall, and vice versa. The current DXY trend suggests a continued headwind for BRENT, potentially limiting upside potential and exacerbating downside moves. Traders should monitor the DXY's ability to break key resistance levels, as this could signal further pressure on oil prices.
| Indicator | Value | Signal | Interpretation |
|---|---|---|---|
| RSI (14) | 30.02 | Oversold | Potential bounce, but strong trend persists. |
| MACD Histogram | -X.XX | Negative Momentum | Selling pressure continues. |
| Stochastic | K=10.75, D=8.96 | Oversold Crossover | Bearish signal, further downside possible. |
| ADX | 26.45 | Strong Trend | Confirms prevailing downtrend strength. |
| Bollinger Bands | Below Middle | Bearish | Price adhering to lower band. |
Market Correlates and Diversified Signals (Continued)
The Role of Bond Yields and Interest Rate Expectations
The intricate dance between bond yields and interest rate expectations forms a critical backdrop for commodity pricing, including BRENT Crude Oil. While the provided market data doesn't include specific Treasury yield figures, the underlying narrative remains consistent: central banks, particularly the Federal Reserve, are navigating a complex path between controlling inflation and avoiding economic stagnation. The market's pricing of Fed Funds Futures and Overnight Index Swaps (OIS) often reflects expectations for future interest rate movements. If these expectations lean towards a more hawkish stance – meaning interest rates might stay higher for longer or even increase – this typically translates into higher bond yields.
Higher yields can impact BRENT in several ways. Firstly, they increase the cost of capital, potentially slowing down economic growth and thus reducing oil demand expectations. Secondly, higher yields make interest-bearing assets more attractive relative to non-yielding assets like commodities or gold, potentially drawing investment away from the oil market. The recent news regarding Canada's headline inflation potentially edging higher, while core inflation remains near target, exemplifies the delicate balance central banks face. Persistent inflation, even if uneven across different metrics, often necessitates a tighter monetary policy, reinforcing higher yield expectations and acting as a drag on oil prices. Investors must therefore monitor yield movements as a key indicator of the broader economic climate and its potential impact on BRENT.
Geopolitical Tensions: A Constant Source of Volatility
The energy market is inherently susceptible to geopolitical shocks, and the current global landscape is rife with potential flashpoints. The recent news about India's strategic oil reserve expansion, driven by supply crisis concerns, underscores the global focus on energy security and the potential for supply disruptions. While this specific event relates to reserve management, it highlights the underlying market anxieties about the reliability of global oil supplies. The ongoing situation in the Middle East, although not currently experiencing a major escalation, remains a significant risk factor. Any flare-up in regional tensions could trigger rapid price spikes as traders factor in potential supply disruptions from major oil-producing nations.
Beyond direct supply impacts, geopolitical events can influence market sentiment more broadly. Increased global uncertainty or the perception of rising systemic risk can lead to a 'risk-off' environment. In such scenarios, investors often reduce their exposure to riskier assets, including commodities, and seek refuge in traditional safe-haven assets like gold, the US dollar, or Swiss Franc. This shift in risk appetite can indirectly affect BRENT prices by reducing speculative demand or even triggering forced liquidations of long positions. The PriceONN news snippet 'Brent Crude Oil: Decline Amid US–Iran Ceasefire' hints at how even perceived de-escalations can impact prices, though underlying risks persist. Vigilance regarding geopolitical developments remains paramount for any oil market participant.
Historical Context and Pattern Analysis
Past Performance of Similar Bearish Setups
To understand the current BRENT situation around $80.22, it's valuable to look at historical precedents. Periods where BRENT has shown a strong daily downtrend (high ADX) but also dipped into oversold territory (low RSI) have often presented complex trading scenarios. For instance, during mid-2023, BRENT experienced a significant decline from over $90 to below $70. In several instances during that downtrend, the daily RSI dipped below 35, similar to the current 30.02 reading. However, these oversold signals often preceded only temporary bounces, failing to reverse the larger trend until more fundamental shifts occurred, such as changes in OPEC+ policy or a significant easing of global growth concerns.
The key lesson from such historical periods is that oversold readings on daily charts, especially when accompanied by strong trend indicators like a high ADX, should not be interpreted as automatic buy signals. They often represent points of temporary capitulation or consolidation within a larger bearish trend. The sustainability of any bounce typically depends on factors like a shift in MACD momentum, a break of key resistance levels on shorter timeframes, or significant changes in macroeconomic or geopolitical narratives. Without these confirming factors, expecting a sustained rally solely based on an oversold RSI can be a costly mistake. The current setup around $80.22 echoes these past patterns, demanding a cautious approach.
The Impact of Previous Oil Supply Crises
The news regarding India's strategic oil reserve expansion serves as a reminder of past supply crises and their impact on oil prices. Historically, events that threaten global oil supply – such as major geopolitical conflicts in the Middle East, natural disasters affecting production facilities, or significant disruptions to shipping routes – have led to dramatic price spikes. For example, the initial stages of the Russia-Ukraine conflict saw WTI and BRENT prices surge well above $100 per barrel due to fears of supply disruption from Russia. These events often override typical technical analysis, creating sharp, trend-reversing moves.
Understanding these historical supply shocks is crucial for long-term investors and even short-term traders. While current technicals might suggest a bearish outlook for BRENT, the potential for a geopolitical event to dramatically alter the supply picture remains a constant risk. Conversely, periods of stable supply and ample production, perhaps driven by OPEC+ decisions or increased non-OPEC output, can exert downward pressure, allowing technical trends to play out more predictably. The current geopolitical climate, while not at peak crisis levels, carries enough underlying tension to warrant constant monitoring. Any significant escalation could quickly turn the narrative from bearish consolidation to bullish supply shock.
Looking Ahead: Key Events and Trader Watchlist
Upcoming Economic Data and Central Bank Signals
The economic calendar for the upcoming week holds several crucial releases that could significantly influence BRENT Crude Oil prices. While specific events for BRENT itself are limited, the broader macroeconomic data will be key. Reports on inflation, employment, and manufacturing PMIs from major economies like the US, Eurozone, and China will provide insights into global economic health and demand prospects for oil. For instance, a stronger-than-expected US Non-Farm Payrolls (NFP) report could reinforce expectations of a hawkish Fed, strengthening the dollar and pressuring oil. Conversely, weaker data might signal a potential economic slowdown, also a negative for oil demand.
Central bank commentary will be equally important. Any signals from the Federal Reserve, European Central Bank (ECB), or Bank of Japan (BOJ) regarding their monetary policy stance – particularly on interest rates and inflation – will ripple through commodity markets. The market's interpretation of this commentary, often reflected in bond yields and currency movements, will directly impact BRENT. Traders should pay close attention to any hints about future policy shifts, as these can preemptively move markets and set the tone for oil prices. The current market sentiment favoring the US dollar, as noted in forex news, suggests that Fed policy will remain a dominant theme.
Price Action Levels to Monitor
As traders look towards the next trading week, the key levels identified on the daily chart will remain paramount. The immediate resistance at $80.76 is the first hurdle for any potential bullish move. A sustained break above this level, coupled with bullish confirmation, could signal a move towards $82.11. On the downside, the support at $77.30 is critical. A failure to hold this level could accelerate selling towards $75.19. The current price of $80.22 sits precariously between these two major zones, suggesting that price action will likely be driven by how these levels are tested and potentially breached.
Shorter-term traders will also be watching the intraday support and resistance levels derived from the 1-hour and 4-hour charts. These include resistance around $80.51 and $80.76 on the upside, and support near $80.51 and $79.86 on the downside. The volatility indicated by the mixed signals on these timeframes suggests that quick, tactical trades might be possible, but always with a clear exit strategy and risk management in place. The overall trend remains the dominant factor, and any deviation from the bearish daily outlook would require significant confirmation.
Conclusion: Uncertainty Reigns, but Clarity Lies in Levels
The BRENT Crude Oil market currently finds itself at a critical juncture, with the $80.22 level acting as a focal point for a tug-of-war between bearish technicals and potential fundamental catalysts. While the daily chart paints a predominantly bearish picture, marked by oversold RSI conditions clashing with a strong downtrend confirmed by ADX and MACD, the shorter timeframes offer glimpses of potential short-term rallies. The strengthening US Dollar, driven by hawkish central bank expectations, continues to act as a headwind, while geopolitical tensions remain a persistent wildcard capable of disrupting supply and sentiment at any moment.
For traders, navigating this environment requires a disciplined approach. Scalpers and day traders may find opportunities in intraday volatility, focusing on quick moves between established support and resistance levels, always with tight risk controls. Swing traders should remain patient, looking for clear bearish setups on pullbacks to resistance or confirmed breakdowns of key support levels, respecting the dominant daily trend. Long-term investors must weigh the current technical picture against the fundamental value and strategic risks, considering potential supply disruptions and the long-term energy transition narrative. Ultimately, clarity will emerge from the price action around key levels: $80.76 resistance and $77.30 support will be the primary battlegrounds determining BRENT's immediate fate.
Track markets in real-time
AI-powered analysis, technical indicators and real-time price data.
Join Our Telegram Channel
Breaking market news, AI analysis and trading signals instantly.
Join Channel