The global financial stage is set for a critical juncture for gold, as the precious metal hovers around the $4,155.56 mark. This pivotal level is currently acting as a crucial support zone, and its resilience is being closely monitored by traders and analysts alike. The recent price action for XAUUSD, currently showing a daily decline of 1.27% and trading at $4,155.56, underscores the dynamic interplay between macroeconomic forces, central bank policy expectations, and the inherent safe-haven appeal of gold. As the US dollar index (DXY) experiences a slight pullback, currently at 100.85, it provides a tentative reprieve for dollar-denominated assets like gold, though the broader trend in both markets remains a key determinant of future price direction. Understanding the confluence of these factors is paramount for navigating the current trading environment.
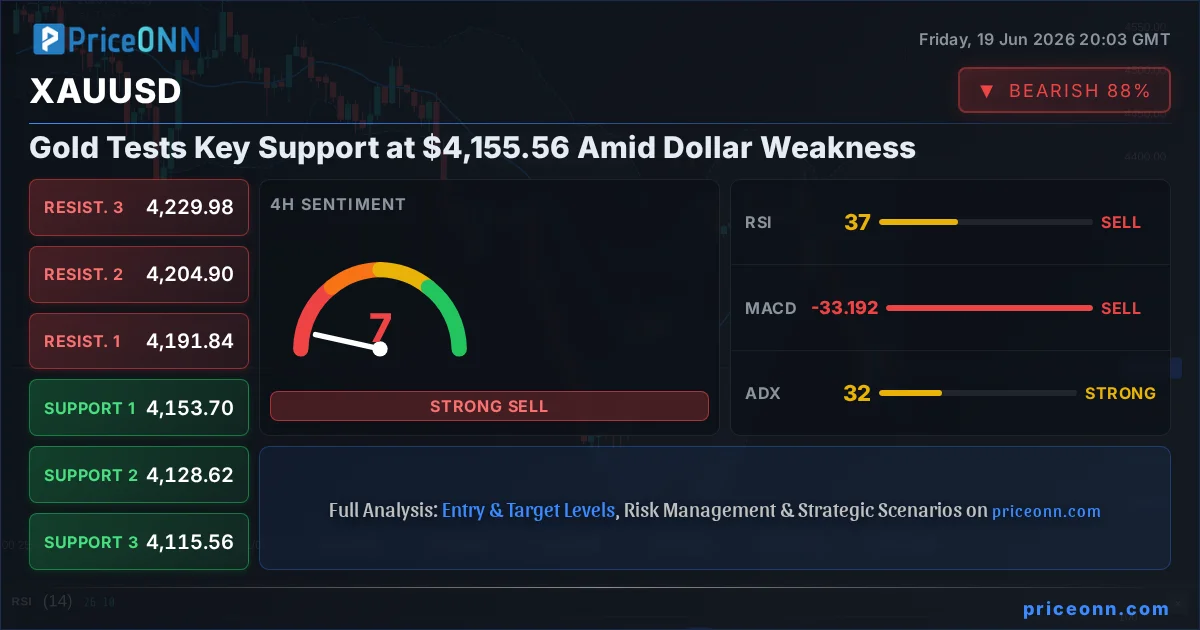
- XAUUSD is currently trading at $4,155.56, testing critical support levels, with a 1H RSI at 39.76 indicating a leaning towards oversold conditions.
- The US Dollar Index (DXY) is at 100.85, showing a slight pullback that offers some support to gold, but the overall trend remains strong.
- The 1D trend for XAUUSD is decisively bearish (98% strength), with a key support at $4,118.59 and resistance at $4,291.86.
- Upcoming inflation data and central bank commentary are expected to be major catalysts, influencing the direction of both the dollar and gold prices.
- Market sentiment is mixed, with equities showing divergent trends; SP500 is rising (0.74%) while Nasdaq is falling (-0.26%), suggesting a cautious risk environment.
The macroeconomic landscape continues to be a primary driver for gold prices, and the current environment presents a complex tapestry of influences. The US dollar, a perennial counterpoint to gold, has seen its strength tested. The DXY's current position at 100.85, down slightly from recent highs, offers a glimmer of hope for gold bulls. Historically, a weakening dollar often correlates with an increased demand for gold as investors seek alternative stores of value, especially when inflation concerns linger. However, the narrative isn't purely about dollar weakness. The Federal Reserve's monetary policy stance remains a significant overhang. Recent commentary, though not explicitly detailed in the provided data, often points towards a cautious approach to interest rate cuts, keeping yields elevated and potentially capping gold's upside. The tension between a potentially softening dollar and a still-hawkish Fed creates a delicate balance, making gold's $4,155.56 support level a critical battleground.
Looking at the technical indicators on the 1-hour chart for XAUUSD, we see a picture of consolidation with a slight bearish leaning. The RSI(14) is hovering at 39.76, firmly in neutral territory but trending downwards, suggesting that while not yet oversold, the selling pressure has been persistent. The MACD, while showing positive momentum with the MACD line above the signal line, is in a context where the overall trend on higher timeframes is bearish. The Bollinger Bands are trading below the middle band, reinforcing the short-term downward pressure. Stochastic indicators show %K at 38.41 and %D at 55.96, a bearish crossover that aligns with the prevailing short-term sentiment. The ADX at 36.37 confirms a strong trend, and given the price action, it's a strong downtrend. The overall signal on this timeframe leans towards 'SELL' (7 sell, 1 buy, 0 neutral), indicating that short-term traders are favoring downside movement, but the proximity to the $4,155.56 support might temper aggressive bets.
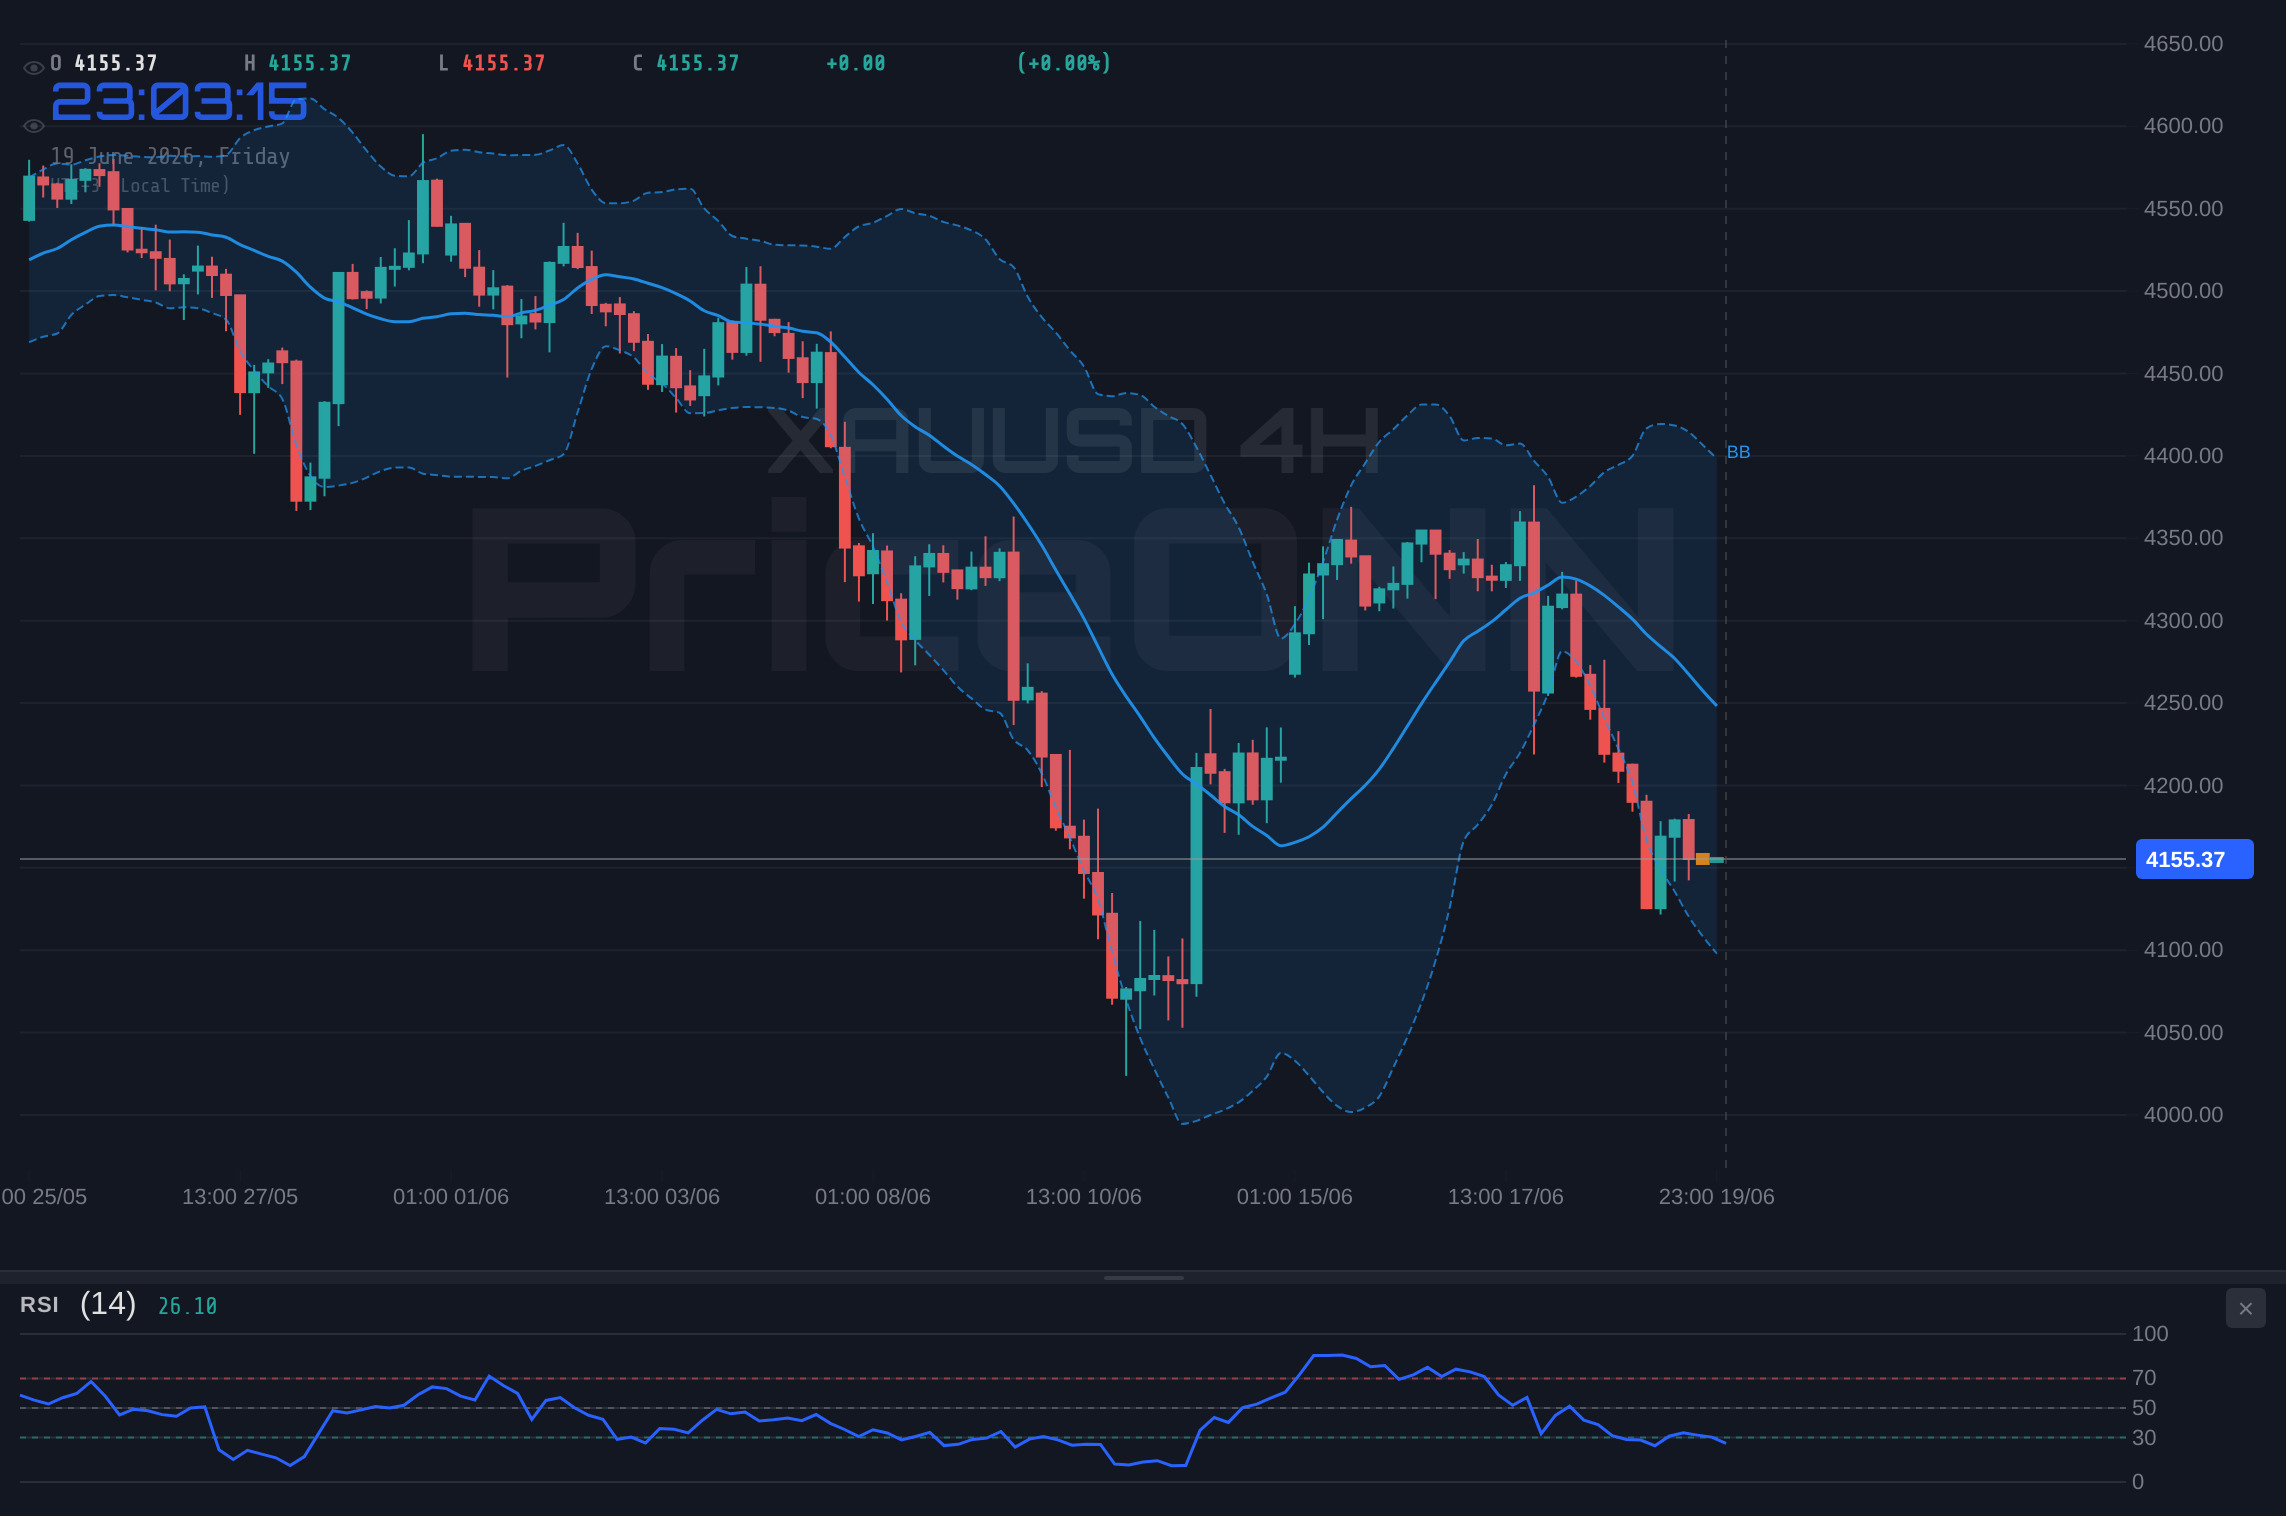
The situation becomes more pronounced when we examine the 4-hour timeframe. Here, the trend is still classified as neutral, but the underlying strength of the downtrend is becoming more apparent with an ADX reading of 32.07. The RSI(14) dips further to 36.9, reinforcing the bearish sentiment. The MACD is now firmly in negative momentum, with the MACD line below the signal line, indicating that selling pressure is building. Bollinger Bands remain below the middle band, a classic sign of bearish consolidation or continuation. Interestingly, the Stochastic indicator shows a contrasting bullish signal (%K at 22.3, %D at 10.29, with %K > %D), suggesting a potential for a short-term bounce or divergence. However, the overwhelming 'SELL' signal (7 sell, 1 buy, 0 neutral) across multiple indicators on this timeframe implies that the path of least resistance is still downwards, with the $4,153.70 level emerging as a critical immediate support. This conflict between Stochastic and other indicators warrants caution, hinting at potential volatility around key levels.
The daily chart paints the most definitive picture, clearly identifying the prevailing trend as bearish with an overwhelming strength of 98%. This long-term perspective is crucial for understanding the broader market forces at play. The RSI(14) at 35.65 continues to trend downwards, suggesting ample room for further declines before gold enters oversold territory. The MACD indicator is firmly in negative territory, with both the MACD line and histogram below the signal line, confirming sustained selling pressure. Bollinger Bands are trading below the middle band, indicating a bearish bias. The Stochastic indicator, with %K at 46.51 and %D at 46.65, is on the cusp of a bearish crossover, reinforcing the downside outlook. The ADX reading of 36.72 solidifies the presence of a strong downtrend. The 'SELL' signal is unanimous across all indicators on this timeframe (8 sell, 0 buy, 0 neutral), making the $4,163.76 support level the immediate focus, followed by deeper levels at $4,118.59. This strong bearish conviction on the daily chart suggests that any short-term rallies might be viewed as opportunities for further selling, especially if key resistance levels hold.
The correlation with other markets is also providing valuable context. The US Dollar Index (DXY) is currently at 100.85, which, while slightly down for the day, indicates a generally strong dollar environment. A persistently strong dollar typically exerts downward pressure on gold, as it becomes more expensive for holders of other currencies. This inverse relationship is a fundamental driver that cannot be ignored. Meanwhile, US equity markets present a mixed picture. The SP500 is showing resilience, trading up 0.74% at 6572.87, suggesting some level of risk appetite. However, the Nasdaq 100 is down 0.26% at 30329.02, indicating sector-specific weakness or a rotation out of growth stocks. This divergence in equity performance can lead to choppier market conditions, potentially increasing volatility in gold as traders assess broader risk sentiment. The geopolitical backdrop, with ongoing global uncertainties, typically supports gold as a safe-haven asset, but current price action suggests that macroeconomic factors, particularly interest rate expectations and dollar strength, are currently dominating the narrative.
From a fundamental perspective, the upcoming economic calendar holds significant potential to sway gold prices. Inflationary pressures remain a key concern for central banks worldwide. While specific data points like CPI or PPI figures for the current period are not provided, the general expectation is that inflation, though potentially moderating, remains a factor that the Federal Reserve and other major central banks are closely watching. Any indication that inflation is proving more persistent than anticipated could lead to a re-pricing of interest rate expectations, potentially strengthening the dollar and pressuring gold. Conversely, signs of rapidly cooling inflation could fuel expectations of earlier or deeper rate cuts, weakening the dollar and providing a tailwind for gold. Traders will be dissecting any central bank commentary for clues on future policy direction, particularly regarding the timing and magnitude of potential rate adjustments. This data-driven environment makes precise price action around key support and resistance levels even more critical.
The recent news flow offers further color to the current market dynamics. Reports suggest that India is expanding its strategic oil reserves, a move that could signal concerns about future energy supply stability and potentially influence inflation expectations. While this is directly related to oil prices, broader energy market stability has ripple effects across the global economy and commodity prices, including gold. Furthermore, news indicating that the US dollar strength is expected to extend, aided by Fed re-pricing, directly challenges any bullish narrative for gold in the short to medium term. This suggests that the current support at $4,155.56 for XAUUSD may face significant headwinds if the dollar continues its upward trajectory. The market seems to be prioritizing the Fed's policy path over other geopolitical or supply-side concerns for now, making any shifts in Fed sentiment the primary catalyst to watch.
Considering the technical confluence and fundamental drivers, the $4,155.56 level for XAUUSD is more than just a price point; it represents a critical psychological and technical barrier. A failure to hold this level on the daily chart could trigger a cascade of stop-loss orders, accelerating the descent towards the next significant support at $4,118.59. Conversely, a strong bounce from $4,155.56, confirmed by increasing volume and a shift in momentum indicators, could signal a short-term reprieve for gold. However, given the dominant bearish trend on the daily timeframe, any such bounce would need to overcome substantial resistance, starting with the $4,160.36 level on the 1-hour chart and extending towards the more significant daily resistance at $4,291.86. The overall market sentiment, heavily influenced by Fed policy and dollar strength, suggests that upside potential may be limited unless there's a significant shift in macroeconomic data or central bank communication.
The interplay between gold and other precious metals, like silver (XAGUSD), also provides valuable insights. Currently trading at $64.84, XAGUSD is also under pressure, showing a daily decline of 1.29%. Its technical indicators mirror gold's bearish leanings on higher timeframes, with a strong downtrend indicated by the ADX at 30.31 on the daily chart. The RSI at 36.85 suggests room for further downside. This đồng pha (confluence) in precious metals reinforces the broader bearish sentiment in the sector, suggesting that systemic factors are weighing on both gold and silver rather than asset-specific issues. Any significant move in gold is likely to be accompanied by a similar move in silver, amplifying the overall market reaction.
Forex markets are also reflecting these underlying tensions. EUR/USD is trading at 1.14756, showing a slight daily gain of 0.16%. However, its 4-hour and 1-day charts both display a strong bearish trend with low RSI values, indicating that this current strength might be a temporary consolidation within a larger downtrend. USD/JPY, on the other hand, shows a strong bullish trend on its 4-hour and daily charts, trading at 161.307. This strength in the dollar against the yen, coupled with a strong dollar index, reinforces the narrative of dollar resilience driven by interest rate differentials or safe-haven demand, which is generally negative for gold. GBP/USD and AUD/USD are both showing bearish trends on their daily charts, further supporting the idea of a stronger dollar environment. The overall forex picture paints a consistent theme of dollar strength, which acts as a significant headwind for gold prices testing the $4,155.56 support.
The energy market, particularly Brent Crude oil trading at $80.22 and WTI at $77.24, presents a dual narrative. Both are showing daily gains, suggesting a recovery in energy prices. Higher oil prices can contribute to inflation, which is traditionally a positive catalyst for gold. However, the daily charts for both Brent and WTI show strong bearish trends (98% and 97% strength respectively), indicating that this current uptick might be a short-term correction within a larger downtrend. If energy prices were to sustain a significant rally, it could reignite inflation fears and provide a boost to gold. But given the current technical setups in oil, it's more likely that the bearish trend will resume, diminishing its potential to act as a strong inflation hedge for gold in the immediate future.
Cryptocurrencies, represented by BTCUSD at $63,039 and ETHUSD at $1700.57, are also showing bearish leanings on their daily charts, albeit with mixed signals across shorter timeframes. Bitcoin, in particular, has seen its ADX at 38.06 on the daily chart confirming a strong downtrend, with RSI at 35.99. Ethereum's daily chart also shows a bearish trend with RSI at 39.26. While cryptocurrencies are often seen as alternative assets, their correlation with risk sentiment can be high. The current weakness in crypto, alongside gold's struggles, suggests that risk aversion might be leading investors to more traditional safe havens or simply to hold cash, rather than allocate capital to volatile assets. This broad-based weakness across commodities and risk assets reinforces the challenge gold faces at its $4,155.56 support.
The current market sentiment, as indicated by the S&P 500's rise and the Nasdaq's dip, points towards a cautious or selective risk appetite. A strong S&P 500 usually implies higher risk tolerance, which can be negative for gold. However, the Nasdaq's decline suggests that growth-oriented assets are facing pressure, possibly due to rising yields or inflation concerns. This bifurcation means that capital flows are not uniformly moving into risk-on assets, creating a mixed environment. Gold's role as a safe haven is typically amplified during periods of broad market uncertainty or sharp declines in equities. While the S&P 500 is currently showing strength, the underlying divergence and the bearish technicals on the Nasdaq warrant attention. If risk sentiment deteriorates further, gold could see renewed safe-haven demand, potentially supporting the $4,155.56 level and beyond.
The Federal Reserve's policy path remains the central theme influencing gold. Market participants are closely watching for any signals that might indicate a shift in the Fed's stance on interest rates. Persistent inflation data or hawkish commentary from Fed officials could lead to higher yields and a stronger dollar, both of which are headwinds for gold. Conversely, signs of cooling inflation or a more dovish tone from the Fed could prompt a reassessment of rate cut expectations, potentially weakening the dollar and providing a significant boost to gold prices. The current technical setup, with gold testing support at $4,155.56 amidst a strong dollar and bearish daily trend, suggests that the bulls need a clear fundamental catalyst - likely a shift in Fed policy expectations or a significant increase in geopolitical risk - to mount a sustainable recovery. Without such a catalyst, the risk of a breakdown below this crucial support level remains elevated.
The coming week's economic calendar is packed with events that could significantly impact gold's trajectory. Key inflation reports, central bank speeches, and employment figures will provide crucial data points for markets to digest. Traders will be looking for any indication that inflation is either stubbornly high or falling faster than expected, as this will directly influence the Fed's policy decisions. Furthermore, geopolitical developments continue to be a background risk factor. Any escalation of global tensions could trigger a flight to safety, benefiting gold. However, as of now, the market appears more focused on monetary policy. Therefore, any price action around the $4,155.56 support level should be viewed through the lens of these upcoming macro events and their potential to shift the fundamental narrative for gold and the US dollar.
Gold is at a critical juncture, testing the $4,155.56 support level. The daily chart shows a strong bearish trend, reinforced by a firm dollar and cautious risk sentiment in equities. While short-term indicators offer mixed signals, the overarching fundamental and technical picture suggests that the bears have the upper hand. Any sustained move higher would require a significant shift in macroeconomic drivers, such as a dovish pivot from the Federal Reserve or a surge in geopolitical risk. Until then, traders will be closely watching the $4,155.56 level as a key battleground, with a decisive break below potentially opening the door to further declines. Conversely, holding this level could set the stage for a short-term technical bounce, but the broader trend remains a significant hurdle.
Frequently Asked Questions: XAUUSD Analysis
What happens if XAUUSD breaks below the $4,155.56 support level?
A break below $4,155.56 on the daily chart could trigger further selling pressure, potentially accelerating towards the next key support at $4,118.59. This would likely be driven by continued dollar strength or bearish inflation data.
Should I buy XAUUSD at current levels of $4,155.56 given the mixed signals?
Buying at current levels carries risk due to the strong bearish daily trend (98% strength) and ADX at 36.72. While short-term indicators show some divergence, confirmation of a bullish reversal, such as holding above $4,160.36 with increasing volume, is advised for a higher probability setup.
Is the RSI at 39.76 a sell signal for XAUUSD right now?
An RSI of 39.76 on the 1-hour chart is in neutral territory but trending down, suggesting bearish momentum. While not yet oversold, it indicates that sellers are more active than buyers in the short term, aligning with the overall bearish bias.
How will upcoming inflation data affect XAUUSD this week?
Higher-than-expected inflation data could strengthen the dollar and pressure gold, while lower-than-expected data might lead to dollar weakness and support gold prices by increasing rate cut expectations from the Fed.
Track markets in real-time
AI-powered analysis, technical indicators and real-time price data.
Join Our Telegram Channel
Breaking market news, AI analysis and trading signals instantly.
Join Channel