The relentless slide in gold prices continues, with XAUUSD currently trading around $4,155.56. This critical juncture marks a significant point for the precious metal, as traders and investors grapple with a confluence of technical signals and underlying market sentiment. After a notable weekly decline, the question on everyone's mind is whether this downward momentum will persist, or if current levels represent a potential bottoming formation. This analysis delves into the intricate technical landscape, examining multiple timeframes and indicators to decipher the most probable path forward for gold, while also considering the broader macroeconomic environment that shapes its trajectory. Understanding the interplay between central bank policies, geopolitical shifts, and market psychology is paramount in navigating the current choppy waters.
- RSI at 35.65 on the daily chart signals further downside potential, indicating neutral territory but leaning towards bearish sentiment.
- Critical support for XAUUSD is located at $4,147.54 on the 1-hour chart, a level that has shown some resilience but is under increasing pressure.
- The ADX at 36.72 on the daily chart confirms a strong downward trend, suggesting that any rallies may be short-lived without significant fundamental shifts.
- Correlation with the DXY, currently at 100.85, indicates that dollar strength continues to weigh on gold prices, a dynamic that could persist if Fed hawkishness remains a dominant theme.
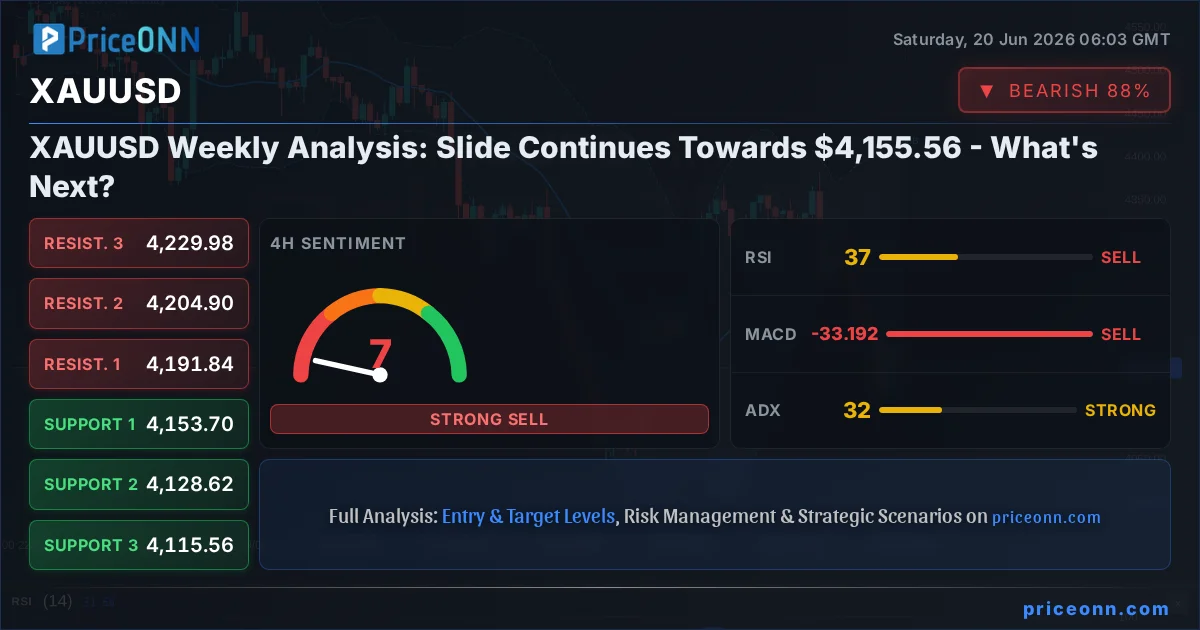
This week's price action for gold has been characterized by a persistent bearish undertone. The daily chart paints a picture of a market under pressure, with the price consolidating below key moving averages and facing resistance at higher levels. The current price of $4,155.56 is a crucial psychological and technical level, and its inability to hold could invite further selling pressure. The daily trend strength is overwhelmingly bearish at 98%, underscoring the prevailing sentiment in the market. While short-term fluctuations may offer brief reprieves, the overarching trend suggests caution for bullish positions. The strength of the downward trend, as indicated by the ADX at 36.72, means that market participants are actively participating in the bearish move, making reversals challenging without significant catalysts.
Examining the 1-hour timeframe provides a granular view of intraday dynamics. Here, the trend is neutral with a power of 50%, suggesting a battle between buyers and sellers within a defined range. Support levels are identified at $4,147.54, $4,144.32, and $4,141.22, with resistance looming at $4,153.86, $4,156.96, and $4,160.18. The RSI(14) is hovering at 39.89, firmly in neutral territory but showing a slight downward inclination. This suggests that while the market isn't oversold, there's no immediate buying interest emerging. The Stochastic oscillator, with %K at 29.63 and %D at 51.25, also points towards a bearish signal, as the %K line is below the %D line, indicating a potential continuation of the downtrend. The ADX at 35.02 reinforces the presence of a strong trend, although the neutral trend strength on this shorter timeframe indicates intraday volatility could lead to some range-bound trading before the next significant move.
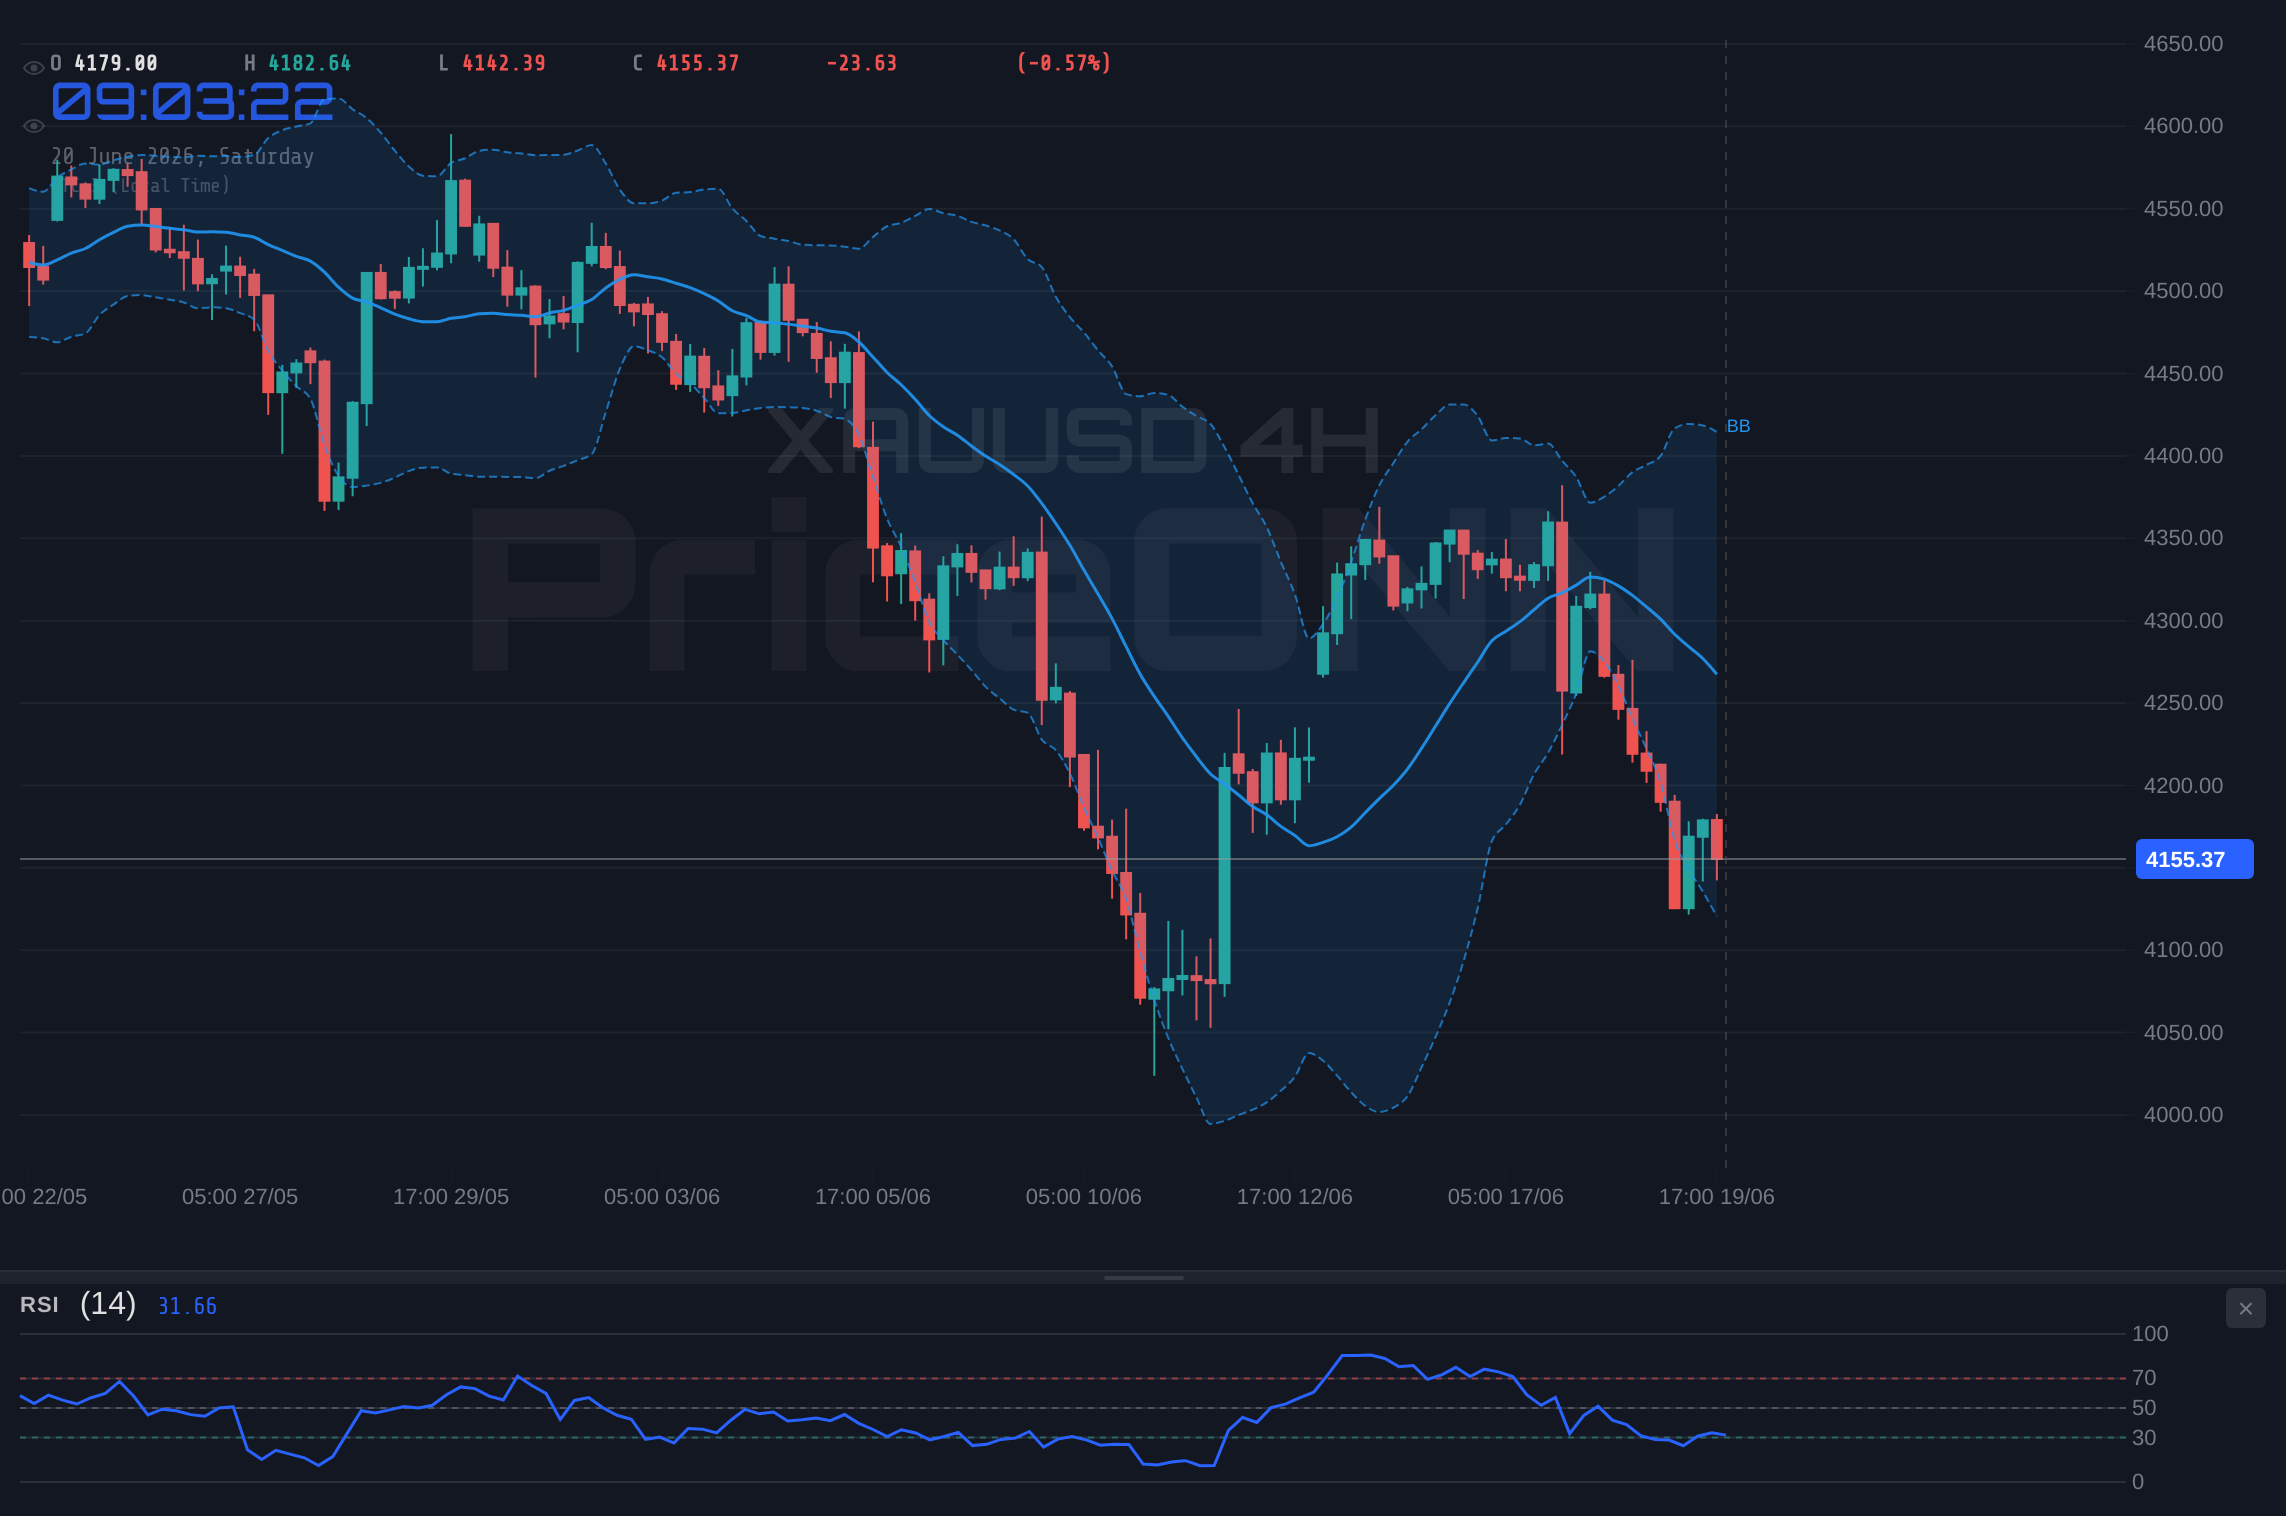
Moving to the 4-hour chart, the picture remains predominantly bearish, despite a neutral trend strength of 50%. The price is trading below the middle Bollinger Band, a common indicator of bearish momentum, with the bands themselves suggesting a potential for further downside if the current trend accelerates. Key support levels are seen at $4,153.70, $4,128.62, and $4,115.56, while resistance is situated at $4,191.84, $4,204.90, and $4,229.98. The RSI(14) is at 36.9, reinforcing the bearish bias observed on the shorter timeframe. However, there's a conflicting signal from the Stochastic oscillator, where %K (22.3) is above %D (10.29), suggesting a potential short-term bounce or oversold condition. This divergence between the RSI and Stochastic on the 4-hour chart highlights the complexity of the current market structure, where conflicting signals can lead to whipsaws for unwary traders. The ADX at 32.07 continues to affirm a strong trend, emphasizing that the prevailing market direction is down, regardless of these short-term oscillator readings.
The daily chart solidifies the bearish outlook for XAUUSD. With a trend strength of 98% and a clear 'SAT' (Sell) signal across most indicators, the path of least resistance appears to be downwards. The daily support levels are critically placed at $4,163.76, $4,118.59, and $4,035.66, while resistance is a considerable distance away at $4,291.86, $4,374.79, and $4,419.96. The RSI(14) at 35.65 indicates that gold is not yet in oversold territory, leaving room for further price depreciation. MACD continues to show negative momentum, with the MACD line below the signal line, confirming the bearish sentiment. The Bollinger Bands are positioned below the middle band, suggesting a bearish trend continuation. The Stochastic oscillator, with %K at 46.51 and %D at 46.65, is on the cusp of a bearish crossover, further supporting the prevailing downtrend. This consistent bearish signal across the daily timeframe is a strong indicator that the underlying trend remains firmly in place.
The Bearish Case: Navigating the Downtrend Towards $4,141
The current technical setup strongly favors a bearish continuation, with several key indicators aligning to suggest further downside for XAUUSD. The daily chart's overwhelming bearish trend strength (98%) and the 'SELL' signal from the majority of indicators provide a robust foundation for this outlook. The price action observed over the past week, characterized by lower highs and lower lows, reinforces this narrative. The inability of gold to reclaim the $4,200 level, which previously acted as a significant psychological barrier, has emboldened sellers. The current price of $4,155.56 is precariously perched above the first key support level on the 1-hour chart at $4,147.54. A decisive break below this level could trigger a cascade of stop-loss orders, accelerating the decline towards the subsequent support at $4,144.32 and potentially $4,141.22. The ADX reading of 35.02 on the 1-hour chart and 36.72 on the daily chart confirms that the trend is strong, meaning that counter-trend moves are likely to be short-lived and met with aggressive selling.
The RSI's position below 40 on multiple timeframes, coupled with the Stochastic oscillator's bearish signals on the 1-hour and daily charts, further bolsters the bearish thesis. While the 4-hour Stochastic shows a conflicting bullish signal (%K > %D), this is often a sign of a market that is oversold but still trending downwards, a condition that can persist for some time. The Bollinger Bands on the daily chart are hugging the lower band, a classic sign of strong downward momentum. This suggests that any upward retracements are likely to be capped by the middle band, which now acts as dynamic resistance. The correlation with the US Dollar Index (DXY), currently trading around 100.85 and showing signs of strength, adds another layer to the bearish argument. A stronger dollar typically exerts downward pressure on gold, as it becomes more expensive for holders of other currencies. This relationship is a critical factor to monitor, as any sustained dollar rally could exacerbate gold's decline.
Furthermore, the recent news flow, while mixed, has not provided a strong enough fundamental catalyst to reverse the bearish trend. Reports of potential easing of geopolitical tensions, even if temporary, can reduce safe-haven demand for gold. While concerns about inflation persist in some economies, the dominant narrative in major central banks, particularly the US Federal Reserve, remains focused on combating it, often through hawkish monetary policy. This environment, characterized by higher interest rates or the prospect thereof, generally dampens the appeal of non-yielding assets like gold. The lack of significant positive news specifically for gold, combined with the prevailing technical weakness, makes the bearish scenario the most probable outcome in the short to medium term. The market appears to be pricing in a continuation of the current trend, with key psychological levels acting as magnets for price.
The Bullish Scenario: A Rebound Above $4,160?
Despite the prevailing bearish sentiment, a bullish scenario for XAUUSD cannot be entirely discounted. For gold to reverse its downward trajectory, several conditions must be met, and specific technical levels must be breached. The first hurdle for the bulls would be to reclaim the resistance levels identified on the 1-hour chart, particularly the cluster around $4,153.86 to $4,160.18. A sustained move and close above $4,160.18 would be a significant technical development, potentially signaling a short-term bottom. This would likely require a shift in market sentiment, perhaps driven by a sudden escalation of geopolitical risks or a dovish surprise from a major central bank, although the latter seems unlikely given current Fed rhetoric.
On the 4-hour chart, breaking above the middle Bollinger Band and the immediate resistance at $4,191.84 would be a crucial step towards validating a bullish reversal. This would require significant buying pressure to overcome the existing bearish momentum. A sustained push above $4,204.90 would further strengthen the bullish case, targeting the higher resistance levels. The RSI(14) would need to move decisively above 50, ideally breaking through the 60-level, to confirm a shift in momentum. Similarly, the MACD would need to generate a strong bullish crossover, with the MACD line crossing significantly above the signal line, and the histogram turning positive. The conflicting Stochastic signal on the 4-hour chart, where %K > %D, could be the initial spark for such a move, but it would need to be confirmed by other indicators and sustained price action.
On the daily timeframe, the bullish case becomes more challenging. A break above the significant resistance at $4,291.86 would be necessary to even question the dominant downtrend. This would require a fundamental shift in the global economic outlook or a substantial change in central bank policy. Until then, any rallies are likely to be met with profit-taking and renewed selling pressure. The ADX reading of 36.72 on the daily chart suggests that the current downtrend is strong and resilient. For a true bullish reversal to take hold, we would need to see a sustained period of consolidation, followed by a clear break of key resistance levels, accompanied by positive divergence in indicators like the RSI and MACD. Without these confluence factors, the bullish scenario remains a less probable outcome, serving more as a potential counter-trend trade opportunity rather than a sustainable trend change.
The Neutral Scenario: Range-Bound Trading and Consolidation
In the absence of clear directional catalysts, gold could enter a period of consolidation, trading within a defined range. This neutral scenario would see XAUUSD oscillating between established support and resistance levels, reflecting a market in equilibrium or one waiting for decisive news. On the 1-hour chart, this range is relatively tight, primarily defined by support at $4,147.54 and resistance at $4,160.18. Within this narrow band, scalpers and range traders might find opportunities, but the overall trend bias remains a significant factor.
The 4-hour chart offers a slightly wider range for consolidation, with support at $4,153.70 and resistance at $4,191.84. A neutral market here would involve price oscillating between these levels, potentially forming minor support and resistance zones within the broader range. The ADX values across different timeframes (35.02 on 1H, 32.07 on 4H, 36.72 on 1D) indicate a strong trend is present, which typically works against sustained range-bound trading. However, market participants might be hesitant to commit to a new direction ahead of significant economic data releases or geopolitical events. This indecision can lead to periods of consolidation, even within a strong trend, as the market digests information and awaits confirmation.
For a neutral scenario to persist, key levels would need to hold firm. Support at $4,147.54 and resistance at $4,160.18 on the 1-hour chart would be the primary battlegrounds. A failure to break these levels, coupled with a lack of significant fundamental news, could lead to choppy, range-bound trading for several sessions. However, given the strong daily downtrend, any consolidation is more likely to be a pause before the next leg lower rather than a prelude to a significant reversal. The market might be coiling for another move, but the direction remains uncertain until a clear break of the established range occurs. Traders operating in such an environment would need to exercise caution, employing range-trading strategies with tight stop-losses and being prepared for a potential breakout in either direction, though the technicals lean towards a downside breakout.
Scenario Probabilities and The Most Likely Outcome
Weighing the technical indicators, price action, and broader market context, the bearish scenario appears to be the most probable outcome for XAUUSD in the near term. The overwhelming 'SELL' signals across daily and 4-hour timeframes, coupled with a strong ADX reading confirming a robust downtrend, provide significant weight to this outlook. The persistent strength of the DXY at 100.85 further supports this view, as dollar strength typically exerts downward pressure on gold. While short-term fluctuations and potential consolidation periods are possible, the underlying technical structure suggests that any rallies are likely to be temporary and met with selling pressure.
The bullish scenario, while not impossible, faces considerable headwinds. It would require a significant shift in fundamental drivers, such as a sharp escalation in geopolitical tensions or a dovish pivot from the Federal Reserve, neither of which appears imminent. The technical hurdles for a sustained bullish move, including breaking through multiple resistance levels and reclaiming key moving averages, are substantial.
The neutral scenario, characterized by range-bound trading, is plausible as the market awaits clearer direction. However, given the strength of the current downtrend, such consolidation is more likely to be a temporary pause before further declines rather than a stable equilibrium.
Therefore, based on the current data:
Bearish Scenario: The Path of Least Resistance
65% ProbabilityNeutral Scenario: Consolidation Around $4,155
25% ProbabilityBullish Scenario: A Reversal Attempt
10% ProbabilityThe bearish scenario holds the highest probability due to the confluence of strong technical signals and the prevailing macroeconomic backdrop. The key will be monitoring price action around the immediate support levels. A break below $4,147.54 could initiate the most probable downside move.
What I'm Watching This Week
As we head into the remainder of the week and look towards the next, several key triggers will be crucial in determining the direction of XAUUSD. Firstly, the ability of gold to hold above or break below the $4,147.54 support level on the 1-hour chart will be paramount. A decisive close below this level could confirm the continuation of the bearish trend. Secondly, I will be closely monitoring the US Dollar Index (DXY). With its current level at 100.85 and showing signs of strength, any further upward movement could put additional pressure on gold. Conversely, a significant pullback in the DXY could offer some respite for gold.
Finally, any major shifts in geopolitical headlines or unexpected economic data releases that deviate significantly from expectations could act as a catalyst for a reversal or acceleration of the current trend. While specific economic events like Fed speeches or inflation reports are not highlighted in the immediate data, the general market sentiment driven by these factors is crucial. Traders should remain vigilant for any news that might alter the perceived trajectory of central bank policies, as this remains a primary driver for gold prices in the current environment. The strength of the trend indicators suggests that until a clear fundamental catalyst emerges, the technical picture will likely continue to dictate price action, favoring the downside.
FAQ Section: XAUUSD Analysis
Frequently Asked Questions: XAUUSD Analysis
What happens if XAUUSD breaks below the $4,147.54 support level this week?
If XAUUSD breaks decisively below $4,147.54, it would likely trigger further selling pressure, confirming the bearish trend. The immediate downside target would then be $4,141.22, with a more significant support level at $4,118.59 on the daily chart. This move would align with the dominant bearish signals from daily indicators like RSI and ADX.
Is the RSI at 35.65 on the daily chart a sell signal for XAUUSD?
An RSI reading of 35.65 is in the neutral zone but indicates a leaning towards bearish sentiment, as it is below 40. While not an oversold signal requiring an immediate buy, it suggests that there is room for further price depreciation before entering oversold territory. It supports the current bearish trend rather than signaling a reversal on its own.
How will the current DXY strength around 100.85 affect XAUUSD?
The current strength of the DXY at 100.85 typically exerts downward pressure on gold prices. A stronger US dollar makes gold more expensive for holders of other currencies, potentially reducing demand. This inverse correlation is a key factor supporting the bearish outlook for XAUUSD, especially if the dollar continues to rally on hawkish Fed expectations.
Should traders consider buying XAUUSD at current levels near $4,155.56 given the technical indicators?
Buying XAUUSD at current levels around $4,155.56 is not advisable given the prevailing bearish technical signals and strong downtrend. The probability of a bullish scenario is low (10%), and such trades would be considered counter-trend. A more prudent approach would be to wait for a confirmed break of resistance levels like $4,160.18 or a clear bottoming pattern to form.
Track markets in real-time
AI-powered analysis, technical indicators and real-time price data.
Join Our Telegram Channel
Breaking market news, AI analysis and trading signals instantly.
Join Channel