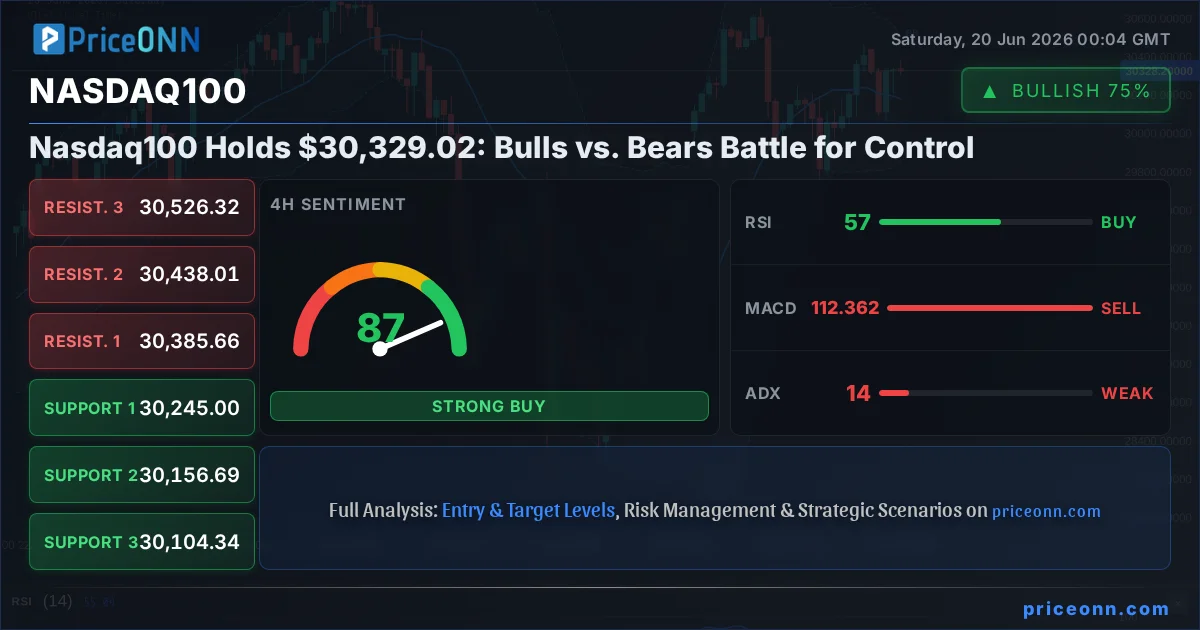
The Nasdaq100 index, a bellwether for the tech-heavy market, finds itself at a critical juncture, hovering just above the $30,329.02 mark. This level, seemingly insignificant on a chart, represents the battleground where bulls and bears are currently locked in a fierce contest. After a week characterized by mixed signals and indecisive price action, the question on every trader's mind is: who will emerge victorious? Will the bulls manage to push the index higher, building on the existing upward momentum, or will the bears seize control, triggering a significant pullback? This analysis delves deep into the technical indicators, market correlations, and underlying economic currents to understand the forces at play and to forecast the Nasdaq100's likely trajectory in the coming week. We will dissect the chart patterns, examine the signals from key technical indicators like RSI, MACD, and ADX, and consider the broader macroeconomic landscape, including the dollar's movement and interest rate expectations, to provide a comprehensive outlook. Understanding this battleground is crucial for all market participants, from short-term scalpers to long-term investors, as it dictates the immediate direction and potential volatility of the tech sector.
- RSI at 54.69 on the 1H chart signals neutral momentum, but a slight upward lean, suggesting neither bulls nor bears have a firm grip yet.
- Critical support sits at $30,337.37 on the 1H chart, tested multiple times this week, while immediate resistance is found at $30,388.48.
- The ADX at 14.02 on the 1H time frame indicates a weak trend, suggesting consolidation is more likely than a decisive breakout in the short term.
- Fed rate expectations remain a dominant driver; any shift in pricing for future rate cuts or hikes will significantly influence the Nasdaq100's correlation with the DXY.
The Bulls' Stand: Holding the Line Above $30,329.02
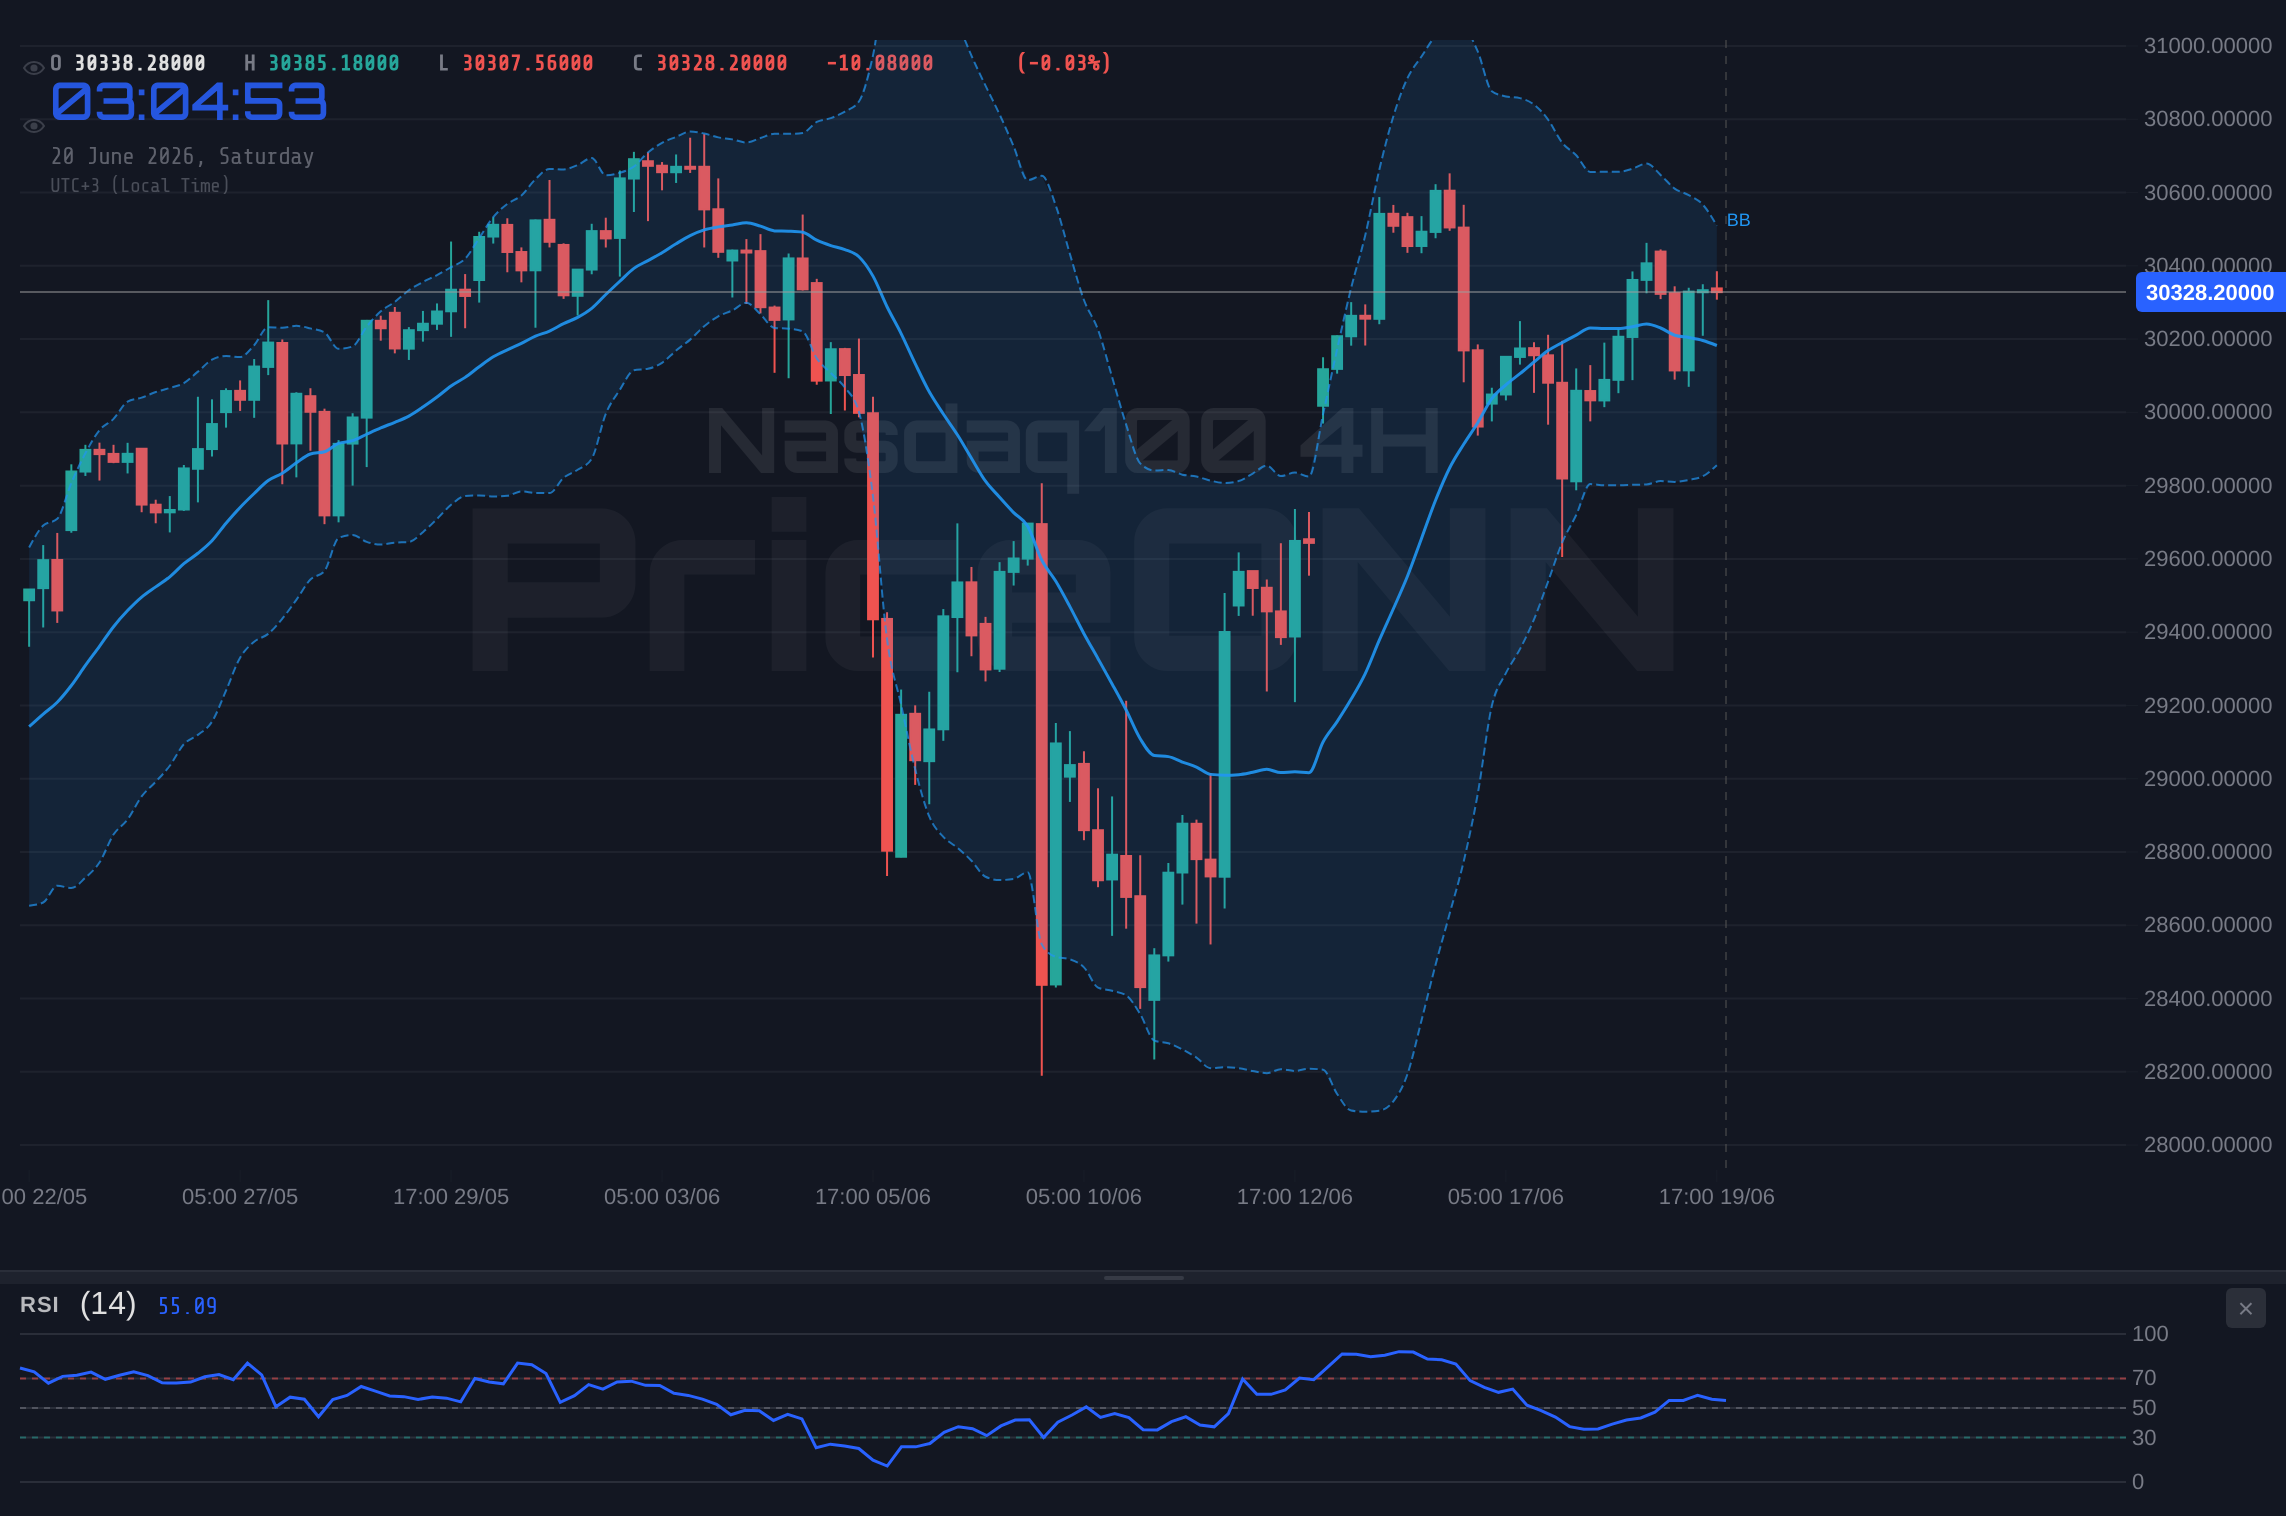
The bulls have managed to keep the Nasdaq100 afloat, preserving the index's overall upward trend despite a week of choppy price action. The current price of $30,329.02, while precarious, is still within striking distance of recent highs. On the 1-hour chart, the RSI at 54.69 offers a neutral reading, but its slight upward trajectory hints at latent buying interest. This isn't an aggressive 'buy' signal by any means, but it suggests that sellers haven't completely overwhelmed the market. The MACD, which is currently positive and above its signal line on the 1H chart, further bolsters the bullish argument, indicating that short-term momentum is still favoring buyers. This positive momentum, though not yet powerful enough to drive a significant breakout, provides a foundation for potential upside. The Bollinger Bands on the 1H chart are also showing price action above the middle band, which, in isolation, could be interpreted as a sign of strength, though the overall trend context needs to be considered. The Stochastic Oscillator, with %K at 84.36 and %D at 85.77, is entering overbought territory on the 1H time frame. While this can sometimes signal an impending reversal, it also shows strong buying pressure is present, preventing a sharper decline. This delicate balance suggests that as long as key support levels hold, the bulls have room to maneuver.
Furthermore, the 4-hour chart, while showing mixed signals, still contains elements that the bulls can latch onto. The RSI at 58.24 on the daily chart, while not overtly bullish, is comfortably in the neutral zone and trending higher, indicating that the broader upward sentiment hasn't been entirely extinguished. The MACD on the 4-hour chart is positive and above its signal line, reinforcing the idea that the underlying trend, despite short-term fluctuations, remains constructive. The Bollinger Bands on the 4-hour chart are also trading above the middle band, suggesting a potential for further upside if the bulls can regain their footing. The Stochastic Oscillator on the 4-hour timeframe, with %K at 74.65 and %D at 80.85, is also in overbought territory, but the fact that %K is still above %D suggests that upward momentum is still present, albeit potentially weakening. On the daily timeframe, the ADX reading of 24.48, while indicating a trend of moderate strength, is still in positive territory, supporting the idea of an ongoing, albeit potentially slowing, uptrend. The bulls' immediate objective is to defend the $30,337.37 support level on the 1-hour chart. A failure to hold this level would significantly weaken their case, but as long as it remains intact, the possibility of a retest of higher resistance levels, such as $30,388.48, remains on the table. The key for the bulls is to consolidate their position around the $30,329.02 mark and build momentum for a decisive move upwards.
The historical performance of the Nasdaq100 during periods of similar indecision offers some perspective. In late 2023, for instance, the index experienced a prolonged period of consolidation around key psychological levels before embarking on a significant rally. During that phase, technical indicators often flashed conflicting signals, with RSI oscillating between overbought and oversold conditions, and MACD showing brief divergences. The crucial factor then, as it may be now, was the resilience of key support levels. When these levels held, despite the noise from oscillators and short-term trend indicators, the broader uptrend eventually reasserted itself. This historical parallel suggests that even in the current environment of mixed signals and choppy price action around $30,329.02, a sustained defense of the immediate support structure could set the stage for another upward leg. The bulls are counting on this historical precedent, believing that the current consolidation is merely a prelude to further gains, provided the fundamental backdrop remains supportive and key technical levels are defended. The strength of the tech sector's underlying fundamentals, driven by AI innovation and corporate earnings, provides a solid foundation for this optimistic outlook.
The Bears' Counterattack: Is $30,329.02 a Trap?
While the bulls are fighting to maintain their ground, the bears see the current price action around $30,329.02 as a potential trap and an opportunity to push the index lower. Several technical indicators and market conditions lend credence to their bearish outlook. On the 1-hour chart, the Stochastic Oscillator is flashing a warning sign as it hovers in overbought territory (K=84.36, D=85.77). While this doesn't guarantee a reversal, it indicates that the recent upward move may be overextended in the very short term, making it susceptible to profit-taking or a reversal. The ADX on the 1-hour chart is at 14.02, which signifies a very weak trend. This low ADX reading implies a lack of conviction behind the current price movement, suggesting that any upward momentum could easily falter. A weak trend environment often precedes a significant move in the opposite direction, as underlying selling pressure builds. Furthermore, the daily chart presents a more concerning picture for the bulls. The RSI at 45.35, while neutral, is trending downwards, indicating waning buying interest over a longer timeframe. The MACD on the daily chart is negative and below its signal line, pointing to bearish momentum building on a daily basis. The Bollinger Bands on the daily chart are also trading below the middle band, reinforcing the bearish sentiment and suggesting that the index is under pressure.
The 4-hour chart adds further weight to the bears' argument. The RSI at 56.65, while not overtly bearish, is showing a slight downward tilt, and the MACD is negative and below its signal line, indicating that selling pressure is present on this intermediate timeframe. The Stochastic Oscillator on the 4-hour chart (K=74.65, D=80.85) is also in overbought territory and showing a bearish crossover, suggesting that the recent bounce might be losing steam. The ADX on the 4-hour chart is at 24.23, which, while indicating a moderate trend, is still on the lower side, suggesting that the trend lacks strong conviction. The bears are keenly watching the $30,337.37 support level on the 1-hour chart. A decisive break below this level would be a significant bearish signal, potentially triggering stop-loss orders and accelerating the decline. Their immediate targets would then be the next support levels at $30,310.16 and $30,286.26. The bears also point to the broader market context. The DXY (Dollar Index) is showing strength on the 4-hour (ADX 45) and daily (ADX 32.38) charts, with its daily RSI at 70.85 indicating potential for further upside. A stronger dollar typically puts pressure on risk assets like the Nasdaq100. Similarly, the SP500, a key risk barometer, is showing a bearish signal on its daily chart (ADX 47.51), despite a recent uptick. This correlation suggests that a broader risk-off sentiment could drag the Nasdaq100 down with it, regardless of its internal technical strength.
Historically, periods where the Nasdaq100 has struggled to decisively break higher from a consolidation phase have often preceded sharp reversals. For instance, during the tech bubble burst in 2000, numerous attempts to recapture key levels were met with strong selling pressure, and the subsequent declines were swift and brutal. While current market conditions are vastly different, the principle remains: prolonged indecision at elevated price levels can be a precursor to a significant move lower if underlying selling pressure is not absorbed. The bears are drawing parallels to such historical patterns, arguing that the current stalemate around $30,329.02, coupled with the mixed signals from technical indicators and a strengthening dollar, points towards an increased probability of a bearish resolution. They are betting that the market has perhaps overextended its optimism and that a correction is due, especially if key economic data or central bank commentary shifts towards a more hawkish stance. The bears' strategy is to wait for a confirmed break of support, then capitalize on the ensuing momentum. They are not just looking for a minor dip, but a significant liquidation of the current bullish structure, targeting levels significantly below the current price range.
The Technical Tiebreaker: What the Indicators Say
When the bulls and bears are locked in such a tight battle, the technical indicators often provide the crucial clues needed to break the stalemate. Looking at the Nasdaq100's charts, the picture is complex and, frankly, mixed. On the 1-hour timeframe, the RSI is holding steady at 54.69, a neutral reading that offers little conviction. However, the MACD is positive and above its signal line, suggesting short-term bullish momentum. Conversely, the Stochastic Oscillator is pushing into overbought territory (K=84.36, D=85.77), a signal that often precedes a pullback, especially when ADX is low at 14.02, indicating a weak trend. This suggests the 1-hour chart is primed for consolidation or a potential short-term reversal. Moving to the 4-hour chart, the signals become more cautionary for the bulls. The RSI at 58.24 is still in neutral territory but trending down, and the MACD is negative and below its signal line, indicating bearish momentum is building on this intermediate timeframe. The Stochastic Oscillator here is also in overbought territory (K=74.65, D=80.85) with a bearish crossover, further supporting the idea that the recent bounce might be losing steam. The ADX at 24.23 suggests a moderate trend, but its lack of strong upward momentum indicates the market is not yet committed to a clear direction.
The daily timeframe provides the broadest perspective and, arguably, the most significant signals. Here, the RSI stands at 45.35, a neutral reading that is trending downwards, suggesting that longer-term buying interest is not as robust as bulls might hope. The MACD is firmly negative and below its signal line, confirming bearish momentum on a daily basis. This divergence between the short-term MACD and the longer-term daily MACD is a key point of tension. The Bollinger Bands on the daily chart are trading below the middle band, which is a bearish sign, indicating that the index is under downward pressure. The ADX on the daily chart is at 47.51, a remarkably high reading that signals a strong trend, but in this context, it's a strong *downward* trend that is currently being tested by a short-term bounce. This high ADX indicates that if the bears succeed in pushing the price lower, the move could be significant and swift. The conflicting signals across different timeframes - bullish short-term momentum versus bearish longer-term indicators and a strong underlying downtrend on the daily chart - create a classic range-bound scenario. The inability of the index to decisively break above resistance or fall decisively below support points to a market waiting for a catalyst. The low ADX readings on the 1-hour and 4-hour charts (14.02 and 24.23 respectively) suggest that the current price action around $30,329.02 is more about consolidation than a committed trend, making the next directional move heavily dependent on external factors or a significant break of key levels.
The interplay between these indicators is crucial. For example, the bullish MACD on the 1-hour chart is being overshadowed by the bearish MACD on the daily chart. Similarly, while the 1-hour Stochastic is flirting with overbought, the daily Stochastic is still in a relatively neutral position but trending lower. This kind of divergence is exactly what creates the 'battleground' scenario we are witnessing. For the bulls to regain control, they would need to see a sustained move above the $30,388.48 resistance, confirmed by a daily RSI moving above 50 and a MACD crossover on the daily chart. Conversely, for the bears to seize the initiative, a clear break below the $30,337.37 support level is required, which would then likely trigger a cascade of sell orders, pushing the index towards the $30,310.16 and $30,286.26 levels. The current ADX readings across all timeframes (14.02 on 1H, 24.23 on 4H, 47.51 on 1D) present a complex picture: a weak trend in the very short term, a moderate trend on the 4-hour, and a strong trend on the daily. This suggests that while the immediate direction is unclear, the underlying daily trend still holds significant sway, and any move that strengthens that daily trend - whether up or down - will likely dominate market sentiment.
Correlation Analysis: The Dollar, Bonds, and Oil's Shadow
The Nasdaq100 does not operate in a vacuum. Its movements are intricately linked to broader market forces, and understanding these correlations is paramount for a complete analysis. The Dollar Index (DXY) currently stands at 100.85, with its daily RSI at 70.85 indicating it is in overbought territory, but its ADX at 32.38 shows a strong upward trend. Historically, a strengthening dollar often correlates with pressure on global risk assets like the Nasdaq100, as it makes US assets more expensive for foreign buyers and can signal tighter global liquidity. The bulls in the Nasdaq100 would ideally want to see the DXY falter, perhaps retreating from its overbought levels, to alleviate this headwind. Conversely, the bears can point to the dollar's strength as a supporting factor for their thesis, suggesting that capital might be flowing into safe-haven assets, away from riskier tech stocks. The current situation, with the dollar strong but potentially overextended, creates a point of tension that could influence the Nasdaq100's direction.
Bond yields also play a critical role. While specific yield data isn't provided in the market context, the general relationship between yields and tech stocks is well-established. Higher yields typically increase the cost of capital for growth companies, making their future earnings less valuable in present terms, and thus pressuring their stock prices. Conversely, falling yields can boost tech valuations. If bond yields are rising, it would add another layer of pressure on the Nasdaq100, reinforcing the bearish case. If they are falling, it could provide a tailwind for the tech index, supporting the bulls. The correlation here is usually inverse: rising yields often mean a stronger dollar and weaker stocks, while falling yields can lead to a weaker dollar and stronger stocks. Understanding the recent trajectory of Treasury yields is therefore essential for a complete picture. Furthermore, oil prices, currently showing a strong upward move with WTI at $77.24 and Brent at $80.22, can impact inflation expectations. Rising oil prices can signal increased inflationary pressures, which might lead central banks to maintain a tighter monetary policy, indirectly pressuring growth stocks like those in the Nasdaq100. However, rising oil prices can also be driven by supply constraints or geopolitical tensions, which can sometimes lead to a flight to safety, benefiting certain assets while hurting others. In this complex web, the Nasdaq100's correlation with these major asset classes provides vital context. A risk-on environment typically sees the Nasdaq100, DXY, and oil moving in different directions (Nasdaq up, DXY down, oil up on demand), while a risk-off environment might see the Nasdaq100 and oil fall, while the DXY rises. The current mixed signals from these correlations suggest a market that is uncertain about the overall economic direction.
Navigating the Crossroads: Scenarios for the Nasdaq100
Given the current technical indecision and the interplay of various market forces, several scenarios are plausible for the Nasdaq100 in the coming week. The primary narrative revolves around the battle for control around the $30,329.02 level, with key support at $30,337.37 and resistance at $30,388.48 on the 1-hour chart.
Bearish Scenario: The Bears Seize Control
60% ProbabilityNeutral Scenario: Consolidation Continues
25% ProbabilityBullish Scenario: Bulls Reignite the Rally
15% ProbabilityThe bearish scenario appears most probable given the daily chart's indicators and the strength of the dollar. A break below $30,337.37 would likely trigger a cascade of selling, targeting $30,310.16 and then $30,286.26. The high ADX on the daily chart (47.51) suggests that if a downtrend resumes, it could be powerful. The neutral scenario, characterized by continued range-bound trading between $30,310.16 and $30,388.48, is also a strong possibility, especially if no significant economic data or geopolitical events emerge. This would align with the weak trend signals on the 1-hour and 4-hour charts. The bullish scenario, while less probable in the short term due to conflicting daily indicators, remains a possibility if strong buying pressure emerges, perhaps driven by unexpectedly dovish central bank commentary or exceptionally strong corporate earnings reports. A breakout above $30,388.48 would be the key, targeting $30,412.38 and $30,439.59.
For short-term scalpers, the focus will be on defending or breaking the immediate 1-hour support and resistance levels ($30,337.37 and $30,388.48). A break of these levels could offer quick profit opportunities. Swing traders will be looking for confirmation on the 4-hour chart, waiting for a clear signal of trend continuation or reversal, possibly targeting the $30,310.16 support or $30,412.38 resistance. Long-term investors, however, will be paying closer attention to the daily chart's signals and the broader macroeconomic picture. The bearish momentum indicated by the daily MACD and RSI needs to be watched closely. If these indicators continue to deteriorate, or if key support levels on the daily chart (like $29,975.12) are threatened, it could signal a more significant trend change, prompting a re-evaluation of long-term positions. The current price action around $30,329.02 is a critical test, and the resolution of this battle will likely set the tone for the Nasdaq100's performance in the near future. The interplay between technical signals, central bank policy expectations, and geopolitical stability will ultimately determine which scenario plays out.
The Impact of Geopolitics and Central Banks
In today's interconnected financial markets, geopolitical developments and central bank policies are no longer distant considerations; they are immediate drivers of price action, particularly for a growth-oriented index like the Nasdaq100. The recent news flow highlights several factors that could influence the market's direction. For instance, the ongoing strength of the US dollar, as indicated by the DXY's upward trend and overbought RSI, suggests a potential global preference for safe-haven assets or a reflection of a hawkish Federal Reserve stance. If the Fed continues to signal a higher-for-longer interest rate environment, or even hints at further tightening, it would likely weigh on growth stocks by increasing borrowing costs and reducing the present value of future earnings. Market participants are closely watching Fed commentary for any shifts in tone, as even subtle changes in language can trigger significant repricing across asset classes. The CME FedWatch tool, if available, would provide concrete probabilities for future rate hikes or cuts, offering a more precise gauge of market expectations. Without explicit data, we must rely on broader commentary, but the underlying message from the dollar's strength suggests that the market is pricing in a relatively tight monetary policy environment.
Geopolitical tensions also cast a long shadow. The ongoing concerns surrounding energy supplies, highlighted by India's strategic oil reserve expansion and the fluctuations in WTI and Brent crude prices, can fuel inflation fears. While rising oil prices can sometimes be a sign of robust global demand, they can also signal supply-side disruptions or geopolitical risks, both of which can dampen economic growth and increase market volatility. A sudden escalation of geopolitical conflict could trigger a flight to safety, benefiting assets like US Treasuries and the dollar, while simultaneously pressuring equities. Conversely, de-escalation of tensions could reduce inflation fears and support a more risk-on environment, potentially benefiting the Nasdaq100. The current market sentiment appears to be navigating these crosscurrents cautiously. News regarding the US-China trade relationship, although not explicitly mentioned in the provided data, remains a background factor that could quickly resurface and impact global trade and technology sectors. Similarly, developments in other major economies, such as Canada's headline inflation data or the UK's employment figures, provide broader economic context. A weaker-than-expected inflation report from Canada, for example, could signal cooling global demand, potentially influencing the Fed's policy outlook. The Nasdaq100's sensitivity to these macro factors means that traders must remain attuned to the global economic narrative, not just the technical charts.
The correlation between the Nasdaq100 and the DXY is a particularly important one to monitor. The DXY's current strength, coupled with its strong daily trend, suggests a potential headwind for the tech index. If the dollar continues to appreciate, it could signal a broader risk-off sentiment, which typically weighs heavily on growth stocks. Traders are looking for any signs of dollar weakness to emerge, which would likely coincide with a more favorable environment for the Nasdaq100. The relationship with bond yields is also critical. While not explicitly provided, rising yields generally put downward pressure on growth stocks like those in the Nasdaq100. If market expectations shift towards higher-for-longer interest rates, bond yields could remain elevated, acting as a drag on the index. Conversely, any indication that yields might be peaking or about to decline could provide a significant boost. The recent news about the US dollar cracking and the market knowing it, combined with the potential for higher energy prices impacting inflation, creates a complex backdrop. This suggests that the Federal Reserve's actions and communications will be paramount. Any hint of a pivot or a pause in rate hikes could unleash significant buying pressure on the Nasdaq100, while continued hawkishness would likely favor the bears. The interplay of these global factors with the Nasdaq100's technical picture creates a high-stakes environment where clarity is scarce, and risk management is paramount.
What Different Traders Should Watch
The current market environment around the $30,329.02 level presents distinct opportunities and challenges for traders with different time horizons and strategies. For scalpers, the immediate focus will be on the 1-hour chart and its tight support and resistance levels at $30,337.37 and $30,388.48, respectively. These levels represent potential entry and exit points for very short-term trades, capitalizing on minor price fluctuations within the current range. The low ADX of 14.02 on the 1-hour chart signals a lack of strong directional conviction, meaning scalpers should be wary of expecting large moves and should prioritize tight stop-losses to manage risk in this choppy environment. They will be looking for quick entries on bounces off support or quick entries on rejections at resistance, aiming for smaller, more frequent profits.
Swing traders, operating on the 4-hour and daily charts, will be looking for more conviction before committing to positions. They will be closely monitoring the MACD and RSI on these timeframes. A bearish MACD crossover on the 4-hour chart, coupled with a daily RSI trending below 50, would be a significant signal to consider short positions, targeting the $30,310.16 support level. Conversely, a decisive break above the $30,388.48 resistance, confirmed by a bullish MACD crossover on the 4-hour chart and a daily RSI moving back towards 50 or above, would signal an opportunity to enter long positions, targeting higher resistance levels. The Stochastic Oscillator's behavior across these timeframes will also be key; a divergence or a clear crossover in oversold or overbought territory could provide an edge. Swing traders need to see a clearer trend emerge or a confirmed reversal pattern before deploying significant capital, as the current indecision poses a risk of whipsaws.
Long-term investors, on the other hand, will view this period of consolidation around $30,329.02 as a potential accumulation phase or a time for caution, depending on their risk tolerance and outlook. They will be less concerned with short-term fluctuations and more focused on the underlying fundamentals and the broader trend established on the weekly and monthly charts. The daily chart's bearish signals, particularly the negative MACD and downward-trending RSI, warrant attention. Investors might consider this a time to reduce exposure or wait for a clearer signal of trend resumption. However, if they believe in the long-term growth story of the tech sector, particularly driven by AI and innovation, they might see this consolidation as an opportunity to gradually build positions at attractive prices, provided key long-term support levels, such as those around $29,975.12 on the daily chart, remain intact. They will also be evaluating the macroeconomic outlook: if inflation cools and central banks signal a potential pivot towards easing monetary policy, it could create a very favorable environment for growth stocks in the long run. The key for long-term investors is to differentiate between short-term noise and long-term trend changes, and to align their strategy with their overall investment objectives and risk appetite.
Frequently Asked Questions: Nasdaq100 Analysis
What happens if the Nasdaq100 breaks below the $30,337.37 support level on the 1-hour chart?
A break below $30,337.37 would likely trigger further selling pressure, invalidating the immediate bullish scenario. Bears would then target the $30,310.16 support level, with a potential extension to $30,286.26 if momentum accelerates. This would confirm the bearish outlook suggested by the daily chart's indicators.
Should I buy Nasdaq100 at current levels of $30,329.02 given the mixed signals?
Buying at current levels carries significant risk due to the conflicting technical signals and the low ADX indicating a weak trend. A more prudent approach for risk-averse traders would be to wait for a clear breakout above $30,388.48 or a confirmed bounce from $30,337.37, ideally with increased volume and clearer indicator confirmation.
Is the RSI at 45.35 on the daily chart a sell signal for the Nasdaq100?
An RSI of 45.35 on the daily chart is considered neutral but trending downwards, which suggests waning buying interest over the longer term. While not an immediate sell signal on its own, it supports a cautious or bearish outlook, especially when combined with the negative MACD and downward-trending Bollinger Bands on the same timeframe.
How might the strong US Dollar (DXY at 100.85) affect the Nasdaq100 this week?
The DXY's strong upward trend and overbought RSI (70.85) suggest potential headwinds for the Nasdaq100. A persistently strong dollar can pressure growth stocks by increasing borrowing costs and signaling risk aversion. Traders should watch for any signs of dollar weakness, which could provide a tailwind for the Nasdaq100.
The Nasdaq100 is at a pivotal moment, trading around $30,329.02, with both bulls and bears presenting compelling arguments. The technical indicators offer a mixed bag, with short-term momentum showing flickers of life while longer-term daily indicators lean bearish. The strength of the US dollar and the broader economic context add further layers of complexity. Ultimately, the resolution of this battle will likely hinge on whether key support at $30,337.37 can hold or if resistance at $30,388.48 can be decisively breached. For now, patience and rigorous risk management are advised as the market digests these conflicting signals and awaits a clearer directional catalyst. The path forward will be shaped by the interplay of technical levels, central bank policy expectations, and global macroeconomic trends.
Track markets in real-time
AI-powered analysis, technical indicators and real-time price data.
Join Our Telegram Channel
Breaking market news, AI analysis and trading signals instantly.
Join Channel