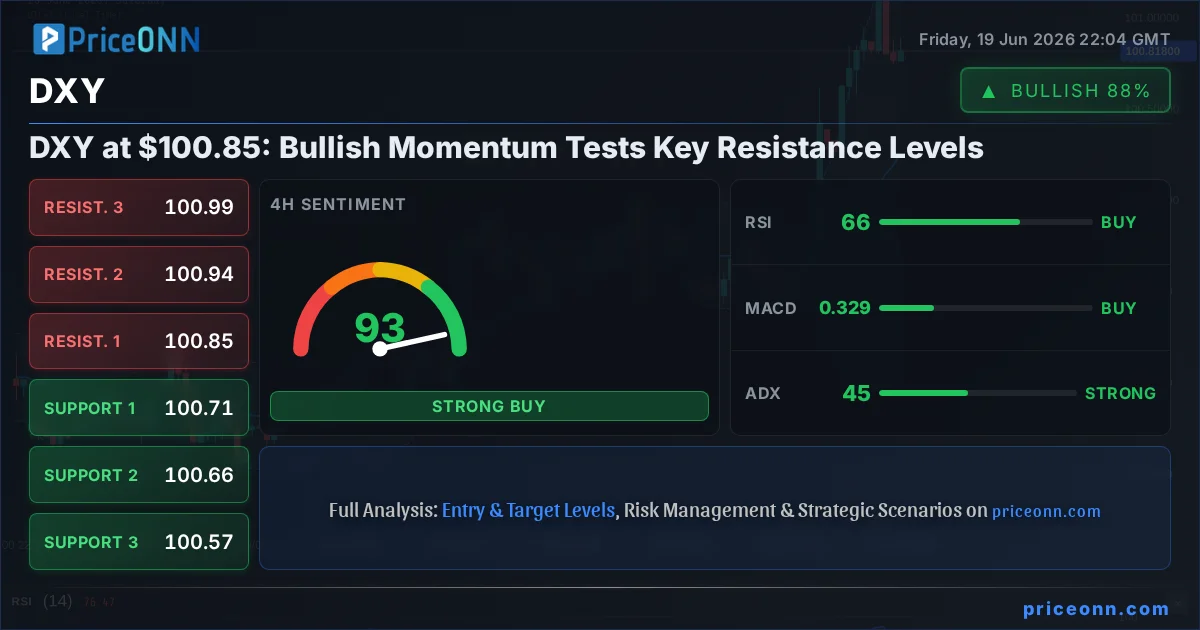
The US Dollar Index (DXY) is at a critical juncture, currently trading at $100.85. This level represents more than just a price point; it's a battleground where the dollar's recent bullish momentum faces significant resistance. For traders and analysts alike, understanding the forces at play behind this key index is paramount, as its movements ripple across global currency pairs, commodities, and equity markets. The question on everyone's mind is whether the dollar can push higher, or if this resistance will force a pullback. This article delves into the current technical landscape, explores the underlying fundamental drivers, and outlines potential scenarios for the DXY in the coming days and weeks.
- The DXY is currently trading at $100.85, facing significant resistance.
- The ADX indicator at 45 suggests a strong trend is in play, while RSI at 66.11 indicates strong upward momentum but is approaching overbought territory.
- Key resistance levels are at $100.85, $100.94, and $100.99, while support lies at $100.71, $100.66, and $100.57.
- A break above $100.85 could target $100.94 and $100.99, while a sustained break below $100.71 might signal a short-term reversal.
- Geopolitical tensions and diverging central bank policies continue to support the dollar's strength.
The Dollar's Ascent: What's Driving the Strength?
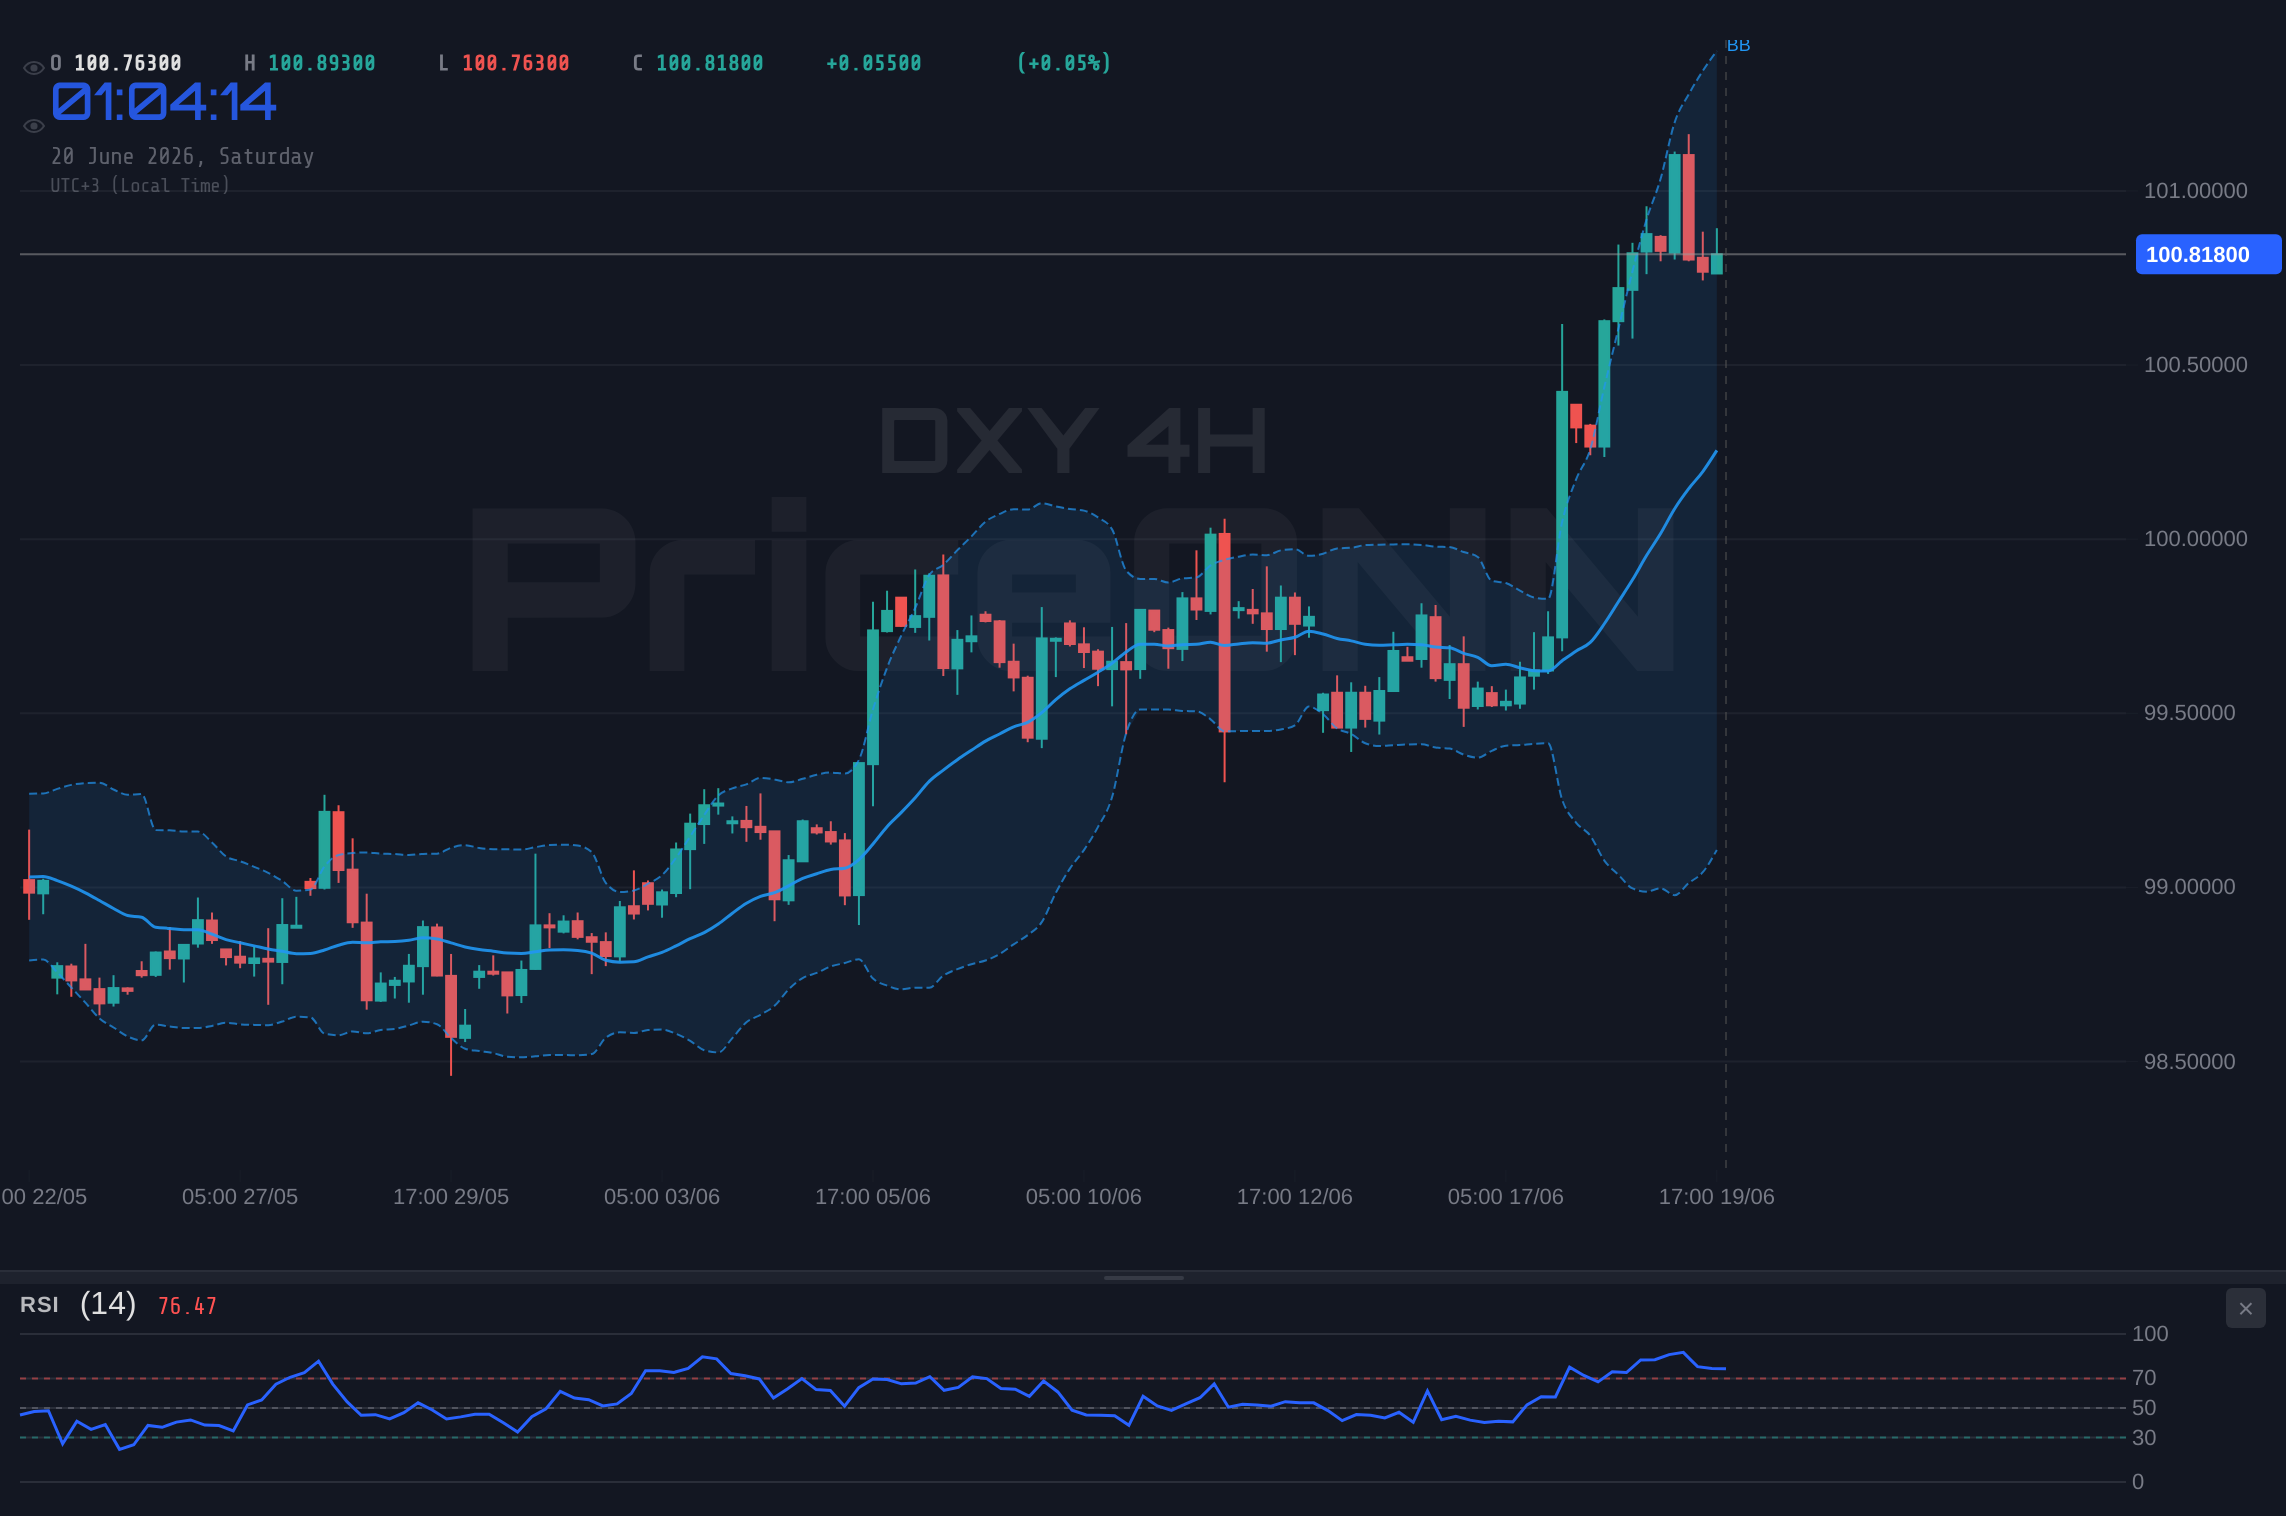
The DXY's recent rally has been underpinned by a confluence of factors, most notably the persistent strength of the US economy relative to other major economies. While global growth concerns linger, the United States has shown remarkable resilience. This economic outperformance, coupled with the Federal Reserve's hawkish stance - or at least its prolonged higher-for-longer interest rate policy - continues to attract capital to dollar-denominated assets. The Fed's most recent projections suggest a more cautious approach to rate cuts, contrasting with the more dovish outlooks from the ECB and potentially the Bank of Japan. This divergence in monetary policy is a powerful tailwind for the dollar, making it an attractive proposition for carry trades and a safe-haven asset in times of global uncertainty. The chart shows a strong upward trend on the 4-hour timeframe, with the ADX at 45 confirming a robust trend, while the RSI at 66.11 indicates strong positive momentum, though it's nearing overbought territory on the daily chart.
Furthermore, global risk sentiment plays a crucial role. In environments where geopolitical tensions flare or economic uncertainty rises, investors tend to flock to the perceived safety of the US dollar. While this week has seen some mixed signals, with WTI crude oil showing some recovery and geopolitical headlines from the Middle East, the underlying risk aversion often benefits the DXY. The recent news about India ordering strategic oil reserve expansion after a supply crisis and ongoing discussions around the US-China trade relationship, while not directly impacting the DXY's immediate price action, contribute to an overall global macro backdrop that can favor dollar strength. The dollar's ability to absorb these global shocks and maintain its upward trajectory underscores its position as the world's primary reserve currency.
Technical Battle at $100.85: Bulls vs. Bears
The technical picture for the DXY is currently one of consolidation at a key resistance level. On the 1-hour chart, the trend is neutral with a strength of 50%, but the ADX at 35.02 indicates a strong trend is still present, albeit potentially slowing. The RSI (14) at 39.89 is in neutral territory but shows a downward eğilim, while the Stochastic oscillator (%K: 29.63, %D: 51.25) provides a clear bearish signal as %K is below %D. However, the 4-hour chart presents a slightly different story, with the ADX at 32.07 still indicating a strong trend, but the Stochastic oscillator (%K: 22.3, %D: 10.29) is now suggesting a potential upward move as %K crosses above %D, despite the MACD being in negative momentum. This divergence across timeframes highlights the indecision at current levels.
The daily chart solidifies the longer-term bullish bias, with the trend strength at 98% and a strong ADX of 36.72. However, the RSI (14) at 35.65, while indicating room for further upside before becoming overbought, is showing a bearish eğilim. The Stochastic oscillator (%K: 46.51, %D: 46.65) is on the cusp of a bearish signal. The immediate price action is confined between the support at $100.71 and resistance at $100.85. A decisive break above $100.85, targeting $100.94 and then $100.99, would confirm the continuation of the bullish trend. Conversely, a failure to hold the support at $100.71, with a close below $100.66, could open the door for a deeper correction towards $100.57, invalidating the immediate bullish outlook.
The Bull's Roadmap: Pushing Past $100.85
For the bulls to maintain control and push the DXY higher, a decisive break above the current resistance at $100.85 is paramount. This level has acted as a significant ceiling, and a clear, sustained move above it would signal strong buying conviction. The immediate target would then be the next resistance level at $100.94. If this level is overcome with strong momentum, the path could open towards the subsequent resistance at $100.99. Confirmation of this bullish scenario would likely involve continued strength in US economic data, perhaps a slightly more hawkish tone from the Federal Reserve in its upcoming communications, or a renewed increase in global risk aversion that drives safe-haven flows into the dollar. The 1-hour chart's signals, with a general buy sentiment (5/3), provide some initial encouragement, although the daily chart's overall 'Sell' signal (0/8) tempers immediate expectations.
The ADX indicator on the 4-hour chart, at 32.07, suggests that if a breakout occurs, the trend could be strong enough to sustain the upward momentum. The Stochastic oscillator on the 4-hour chart is also showing a bullish signal (%K > %D), which could align with a breakout. However, the daily RSI at 35.65 indicates there's still ample room before hitting overbought conditions, suggesting that a sustained rally is technically feasible. The key would be to see this move validated by increasing volume and a clear break of the psychological $101.00 level. Any move above $100.99 would likely see increased volatility as traders reposition. The probability of this scenario playing out hinges heavily on the market's interpretation of upcoming economic data and central bank commentary.
Where Bears Take Control: A Pullback Scenario
On the flip side, the bears have a clear line in the sand: the support level at $100.71. A decisive break below this level, especially with increasing volume, would signal a potential reversal or at least a significant correction. The immediate target in such a scenario would be the next support at $100.66. If this level also fails to hold, the path towards $100.57 becomes more probable. This bearish scenario would be catalyzed by stronger-than-expected inflation data from other major economies, a more dovish surprise from the Federal Reserve, or a significant improvement in global risk sentiment that reduces the demand for safe-haven assets like the dollar. The mixed signals from the shorter-term indicators, particularly the 1-hour RSI showing a downward eğilim and the Stochastic providing a bearish signal, lend some credence to this possibility.
The daily chart's general 'Sell' signal (0/8) and the RSI's downward eğilim cannot be ignored. If the DXY fails to break above $100.85 and instead reverses, it could signal that the market has already priced in the current bullish narrative, and a period of consolidation or correction is due. The ADX on the daily chart at 36.72 still indicates a strong trend, meaning that even a pullback might be met with buying interest at lower levels, but a decisive break of key support could initiate a more significant downward move. Traders watching for a bearish signal would look for a confirmed close below $100.71 on the 4-hour chart, ideally accompanied by a bearish crossover in the MACD or a decline in ADX below 30, suggesting trend weakening.
The Waiting Game: Consolidation Around $100.85
It's also entirely plausible that the DXY will remain range-bound around the $100.85 level for the immediate future. This would occur if the market lacks a clear catalyst to push it decisively in either direction. Incoming data might be mixed, economic news from different regions could offer conflicting signals, and geopolitical events might be significant but not severe enough to trigger a major flight to safety. In such a scenario, the DXY could oscillate between the support at $100.71 and the resistance at $100.85, possibly tightening the range further as it approaches psychological levels like $101.00. The neutral trend strength (50%) on the 1-hour and 4-hour charts, along with the conflicting signals from oscillators like the Stochastic (bullish on 4H, bearish on 1H), support the idea of a consolidation phase.
During a consolidation phase, traders often look for lower volatility setups or wait for a clear breakout signal. This period of indecision can be frustrating for those seeking immediate action, but it often precedes a significant move. The market is essentially absorbing information and building energy for the next directional push. The key levels of $100.71 (support) and $100.85 (resistance) would become the primary focus. A break outside this tight range would then signal the next intended direction. The ADX reading of 9.9 on the 1-hour chart, indicating a weak trend, particularly supports this neutral outlook for the very short term, suggesting that immediate strong directional moves are less likely without a significant catalyst.
Most Likely Scenario: A Cautiously Bullish Outlook
Considering the current technical indicators and the prevailing macroeconomic backdrop, the most probable scenario leans towards a cautiously bullish outlook for the DXY, with a high probability of testing and potentially breaking the key resistance at $100.85. The strong ADX readings across multiple timeframes (45 on 4H, 36.72 on 1D) confirm that a robust trend is in place. While the RSI is approaching overbought levels on the daily chart, it hasn't yet entered extreme territory, leaving room for further appreciation. The Federal Reserve's commitment to maintaining a higher interest rate environment for longer, compared to other major central banks, provides a fundamental underpinning for dollar strength. Furthermore, the ongoing geopolitical uncertainties globally tend to favor the dollar as a safe-haven asset. Therefore, the path of least resistance appears to be upwards, targeting higher resistance levels.
The probability of this scenario is estimated at approximately 65%. The trigger would be a decisive close above $100.85, confirmed by strong volume and follow-through buying. The invalidation point for this bullish thesis would be a sustained break below the $100.71 support level, indicating that the bears have regained control. The primary target would be $100.94, with a secondary target at $100.99. It's crucial to note that this outlook is contingent on upcoming economic data releases and central bank communications. Any unexpected dovish signals from the Fed or significant positive news from other economies could quickly shift this probability. The market sentiment, currently favoring the dollar, could also change rapidly, especially if risk appetite surges unexpectedly.
Bullish Scenario: Dollar Strength Continues
65% ProbabilityBearish Scenario: Resistance Holds Firm
25% ProbabilityNeutral Scenario: Range-Bound Trading
10% ProbabilityWhat I'm Watching This Week
My focus this week will be on a few key triggers that could dictate the DXY's next move. Firstly, I'll be watching for a decisive close above the $100.85 resistance level on the 4-hour chart. This would be a strong signal for the bullish scenario. Secondly, I am monitoring the support at $100.71. A failure to hold this level, especially with increased selling pressure, would invalidate the bullish thesis and point towards a deeper correction. Finally, I will be paying close attention to any new commentary from Federal Reserve officials or significant shifts in global risk sentiment. Any hints of a more dovish Fed policy or a sudden surge in risk appetite could quickly alter the outlook.
The correlation with other markets will also be crucial. A strengthening DXY typically puts pressure on XAUUSD and XAGUSD. Currently, gold is trading at $4155.56, showing a daily decline of -1.27%, and silver at $64.84, down -1.29%. This inverse relationship suggests that if the DXY breaks higher, precious metals could face further headwinds. Conversely, a weaker dollar often supports commodities and emerging market currencies. The recent news about Canada's headline inflation edging higher and the UK's jobs growth stalling provides context for potential divergence in global monetary policy, which could indirectly influence the DXY's path.
Upcoming economic events, such as key inflation reports and central bank speeches, carry the potential for significant volatility. Traders should exercise caution and ensure adequate risk management is in place, particularly around these data releases. The current technical setup suggests a potential breakout, but unexpected news can rapidly change market dynamics.
Frequently Asked Questions: DXY Analysis
What happens if DXY breaks above the $100.85 resistance level?
If the DXY breaks decisively above $100.85, it suggests strong bullish momentum. The immediate target would be $100.94, followed by $100.99. This scenario is supported by strong ADX readings and a Fed policy that remains relatively hawkish compared to its peers.
Should I buy DXY at current levels of $100.85 given the RSI is at 66.11?
Buying at current resistance levels carries risk. While the trend is strong, RSI at 66.11 on the 4-hour chart suggests upward momentum is significant but approaching overbought territory. A confirmed breakout above $100.85 would be a stronger buy signal than entering at resistance.
Is the ADX at 45 a strong sell signal for DXY right now?
An ADX reading of 45 indicates a strong trend, but it doesn't specify the direction. In this case, the trend is bullish, supported by other indicators. Therefore, ADX at 45 is a signal of trend strength, not necessarily a sell signal on its own; it confirms that if a breakout occurs, the trend could be sustained.
How will upcoming Fed commentary affect DXY around $100.85 this week?
Hawkish Fed commentary would likely reinforce dollar strength, potentially pushing the DXY above $100.85 towards $100.94 and beyond. Conversely, any dovish hints could invalidate the bullish setup and lead to a pullback towards $100.71 or lower.
Technical Outlook Summary
| Indicator | Value | Signal | Interpretation |
|---|---|---|---|
| RSI (14) | 66.11 | Neutral | Approaching overbought, strong momentum. |
| MACD Histogram | Positive | Bullish | Positive momentum on 4H chart. |
| Stochastic | K=61.42, D=83.45 | Bearish | Bearish crossover on 4H chart, caution needed. |
| ADX | 45 | Bullish | Strong trend identified on 4H chart. |
| Bollinger | Upper Band | Watch | Price above middle band, indicating upward pressure. |
Key Levels
Support Levels
Resistance Levels
Track markets in real-time
AI-powered analysis, technical indicators and real-time price data.
Join Our Telegram Channel
Breaking market news, AI analysis and trading signals instantly.
Join Channel