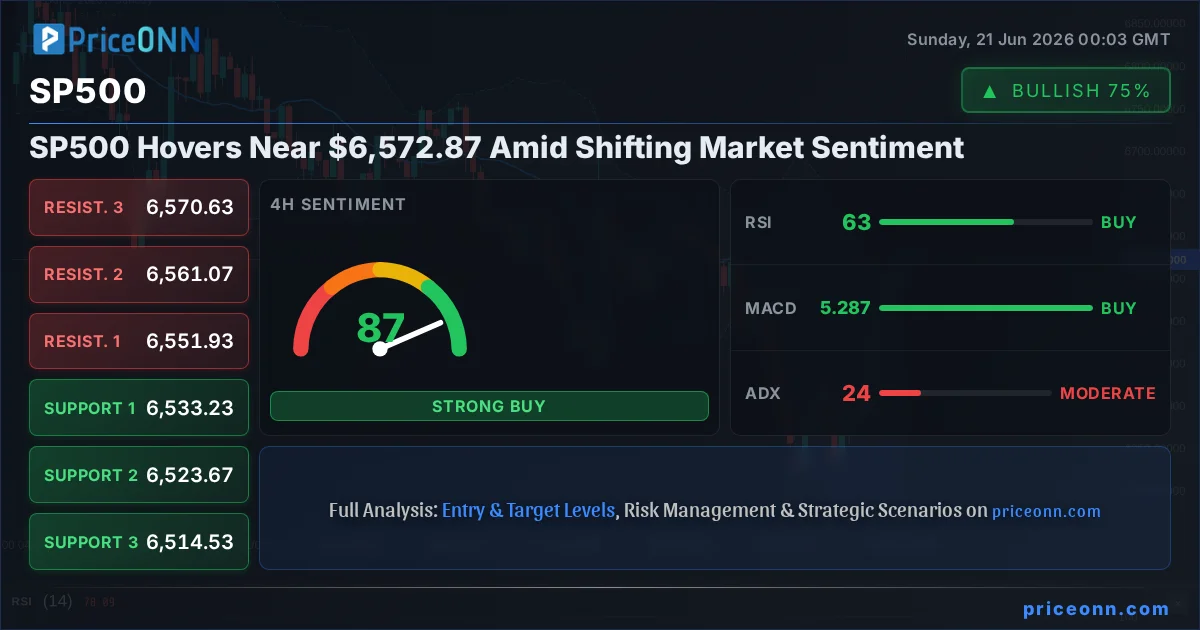
The global financial stage has been a theater of shifting sentiments, with markets grappling to interpret the latest economic whispers and policy pronouncements. Last week, the S&P 500 managed a marginal gain, closing near the $6,572.87 mark. However, beneath this surface of apparent stability, a persistent bearish trend on the daily charts signals that the bulls may be facing a formidable challenge. This dichotomy between short-term resilience and long-term bearish pressure creates a complex trading environment, demanding a closer look at the underlying technicals and macroeconomic currents that are shaping the index's trajectory.
- The SP500 finished the week with a 0.74% gain, closing around $6,572.87, but the daily chart displays a strong bearish trend.
- Daily RSI at 45.35 indicates a bearish inclination, while the 1-hour RSI at 70.95 shows overbought pressure in the short term.
- Critical support for the SP500 is established at $6,377.47, with resistance looming at $6,605.07.
- The strengthening US Dollar Index (DXY) to 100.82 is exerting pressure on risk assets like the SP500.
The recent price action in the S&P 500 paints a picture of cautious optimism, a narrative that is becoming increasingly difficult to sustain. While the index managed to eke out a 0.74% gain for the week, settling around $6,572.87, the underlying technical structure remains decidedly bearish on the daily timeframe. This divergence is crucial; it suggests that the recent upward movement might be nothing more than a temporary reprieve within a larger downtrend, a 'bear flag' pattern that could precede a more significant decline. Traders are left to navigate a landscape where short-term fluctuations might lull them into a false sense of security, while the longer-term trend continues to whisper warnings of caution.
The daily chart analysis reveals a powerful bearish trend, underscored by a robust ADX reading of 47.51. This indicator, a measure of trend strength, signifies that the downward momentum is not merely a fleeting sentiment but a deeply entrenched market condition. The RSI(14) at 45.35 further reinforces this view, sitting comfortably in bearish territory and suggesting that there is ample room for further downside before any oversold conditions might even be considered. The MACD, currently below its signal line with negative momentum, adds another layer to this bearish conviction. These indicators collectively paint a picture of an index under pressure, where any rallies are likely to be met with selling interest as market participants position themselves for further declines.
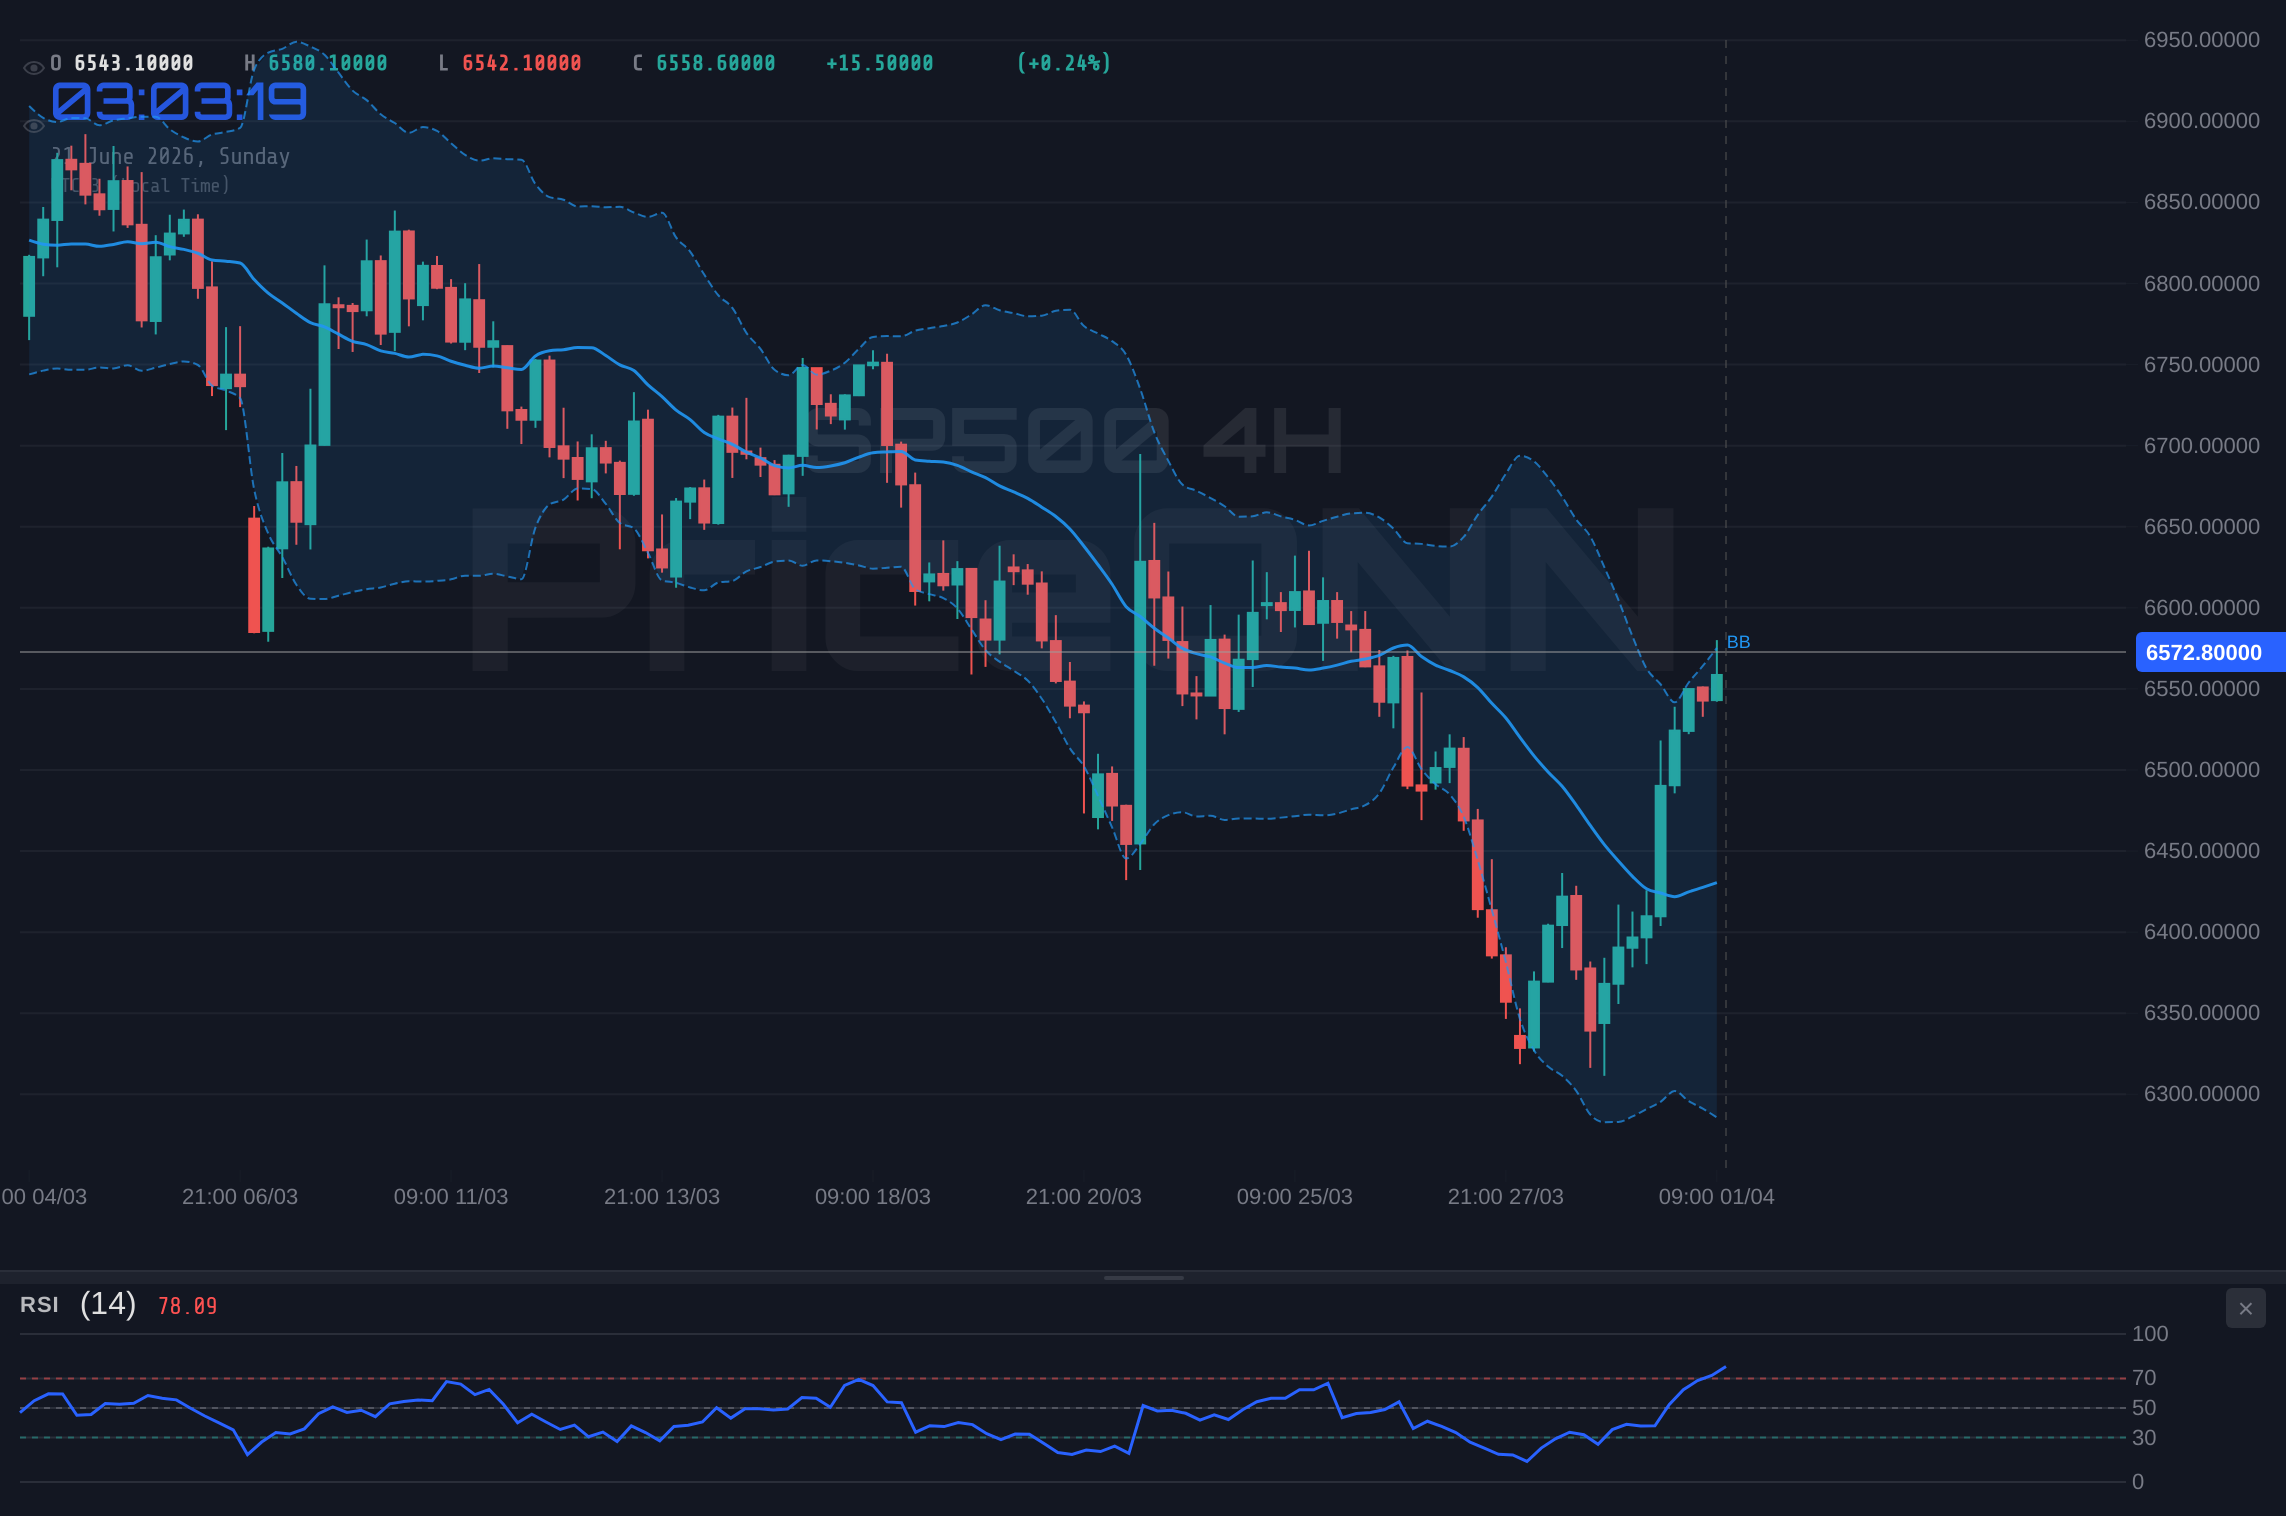
However, the 1-hour and 4-hour charts offer a slightly different, albeit still cautious, perspective. The 1-hour RSI is currently at 70.95, firmly in overbought territory. This suggests that in the very short term, the index might be due for a pullback or consolidation. The MACD on the 1-hour timeframe shows negative momentum, indicating that the recent upward push is losing steam. The Stochastic Oscillator, with %K at 65.73 and %D at 73.5, also signals a potential downward turn from overbought levels. This short-term overbought condition, juxtaposed with the longer-term bearish trend, creates a critical juncture. It implies that while the overall direction is down, there might be short-term trading opportunities for nimble traders, but these must be approached with extreme caution, respecting the dominant daily bearish sentiment.
The strength of the US Dollar Index (DXY) is a significant factor influencing the S&P 500's performance. With the DXY currently trading at 100.82 and showing a strong upward trend on the 4-hour and daily charts, it typically exerts downward pressure on risk assets like equities. This inverse correlation is a well-established market dynamic: as the dollar strengthens, it becomes more expensive for foreign investors to hold US assets, potentially leading to outflows from the stock market. The DXY's current bullish stance, supported by an RSI of 65.62 on the 4-hour chart and even higher at 70.32 on the daily, suggests that the dollar has further room to appreciate, which could translate into continued headwinds for the S&P 500.
The macroeconomic backdrop adds further complexity to the S&P 500's outlook. Recent news highlights a resilient US economy, yet underlying fundamentals continue to weaken. Reports suggest consumer spending remains robust, but this resilience might be masking deeper structural issues. The prospect of renewed Federal Reserve tightening, even if not immediate, looms large. Any indication from Fed officials that inflation remains 'stubborn' or that further rate hikes might be necessary could easily spook the markets. The current market sentiment seems to be caught between the expectation of a 'soft landing' and the fear of a policy misstep that could tip the economy into recession. This uncertainty fuels volatility and makes clear directional bets challenging.
Looking at the weekly performance, the S&P 500's 0.74% gain, closing at $6,572.87, belies the underlying weakness observed in its daily technicals. The ADX at 47.51 on the daily chart is a strong indicator of a trending market, and its value here points towards a dominant downward move. The RSI at 45.35 is below the neutral 50 level, indicating bearish momentum is in play. The MACD histogram is negative, and the MACD line is below the signal line, further confirming the bearish bias. This technical picture is not one of a healthy uptrend but rather a market that might be experiencing a temporary bounce within a broader decline. It’s the kind of environment where bears can be patient, waiting for the opportune moment to strike.
On the 4-hour timeframe, the picture is slightly mixed but still leans bearish. The ADX at 42.66 suggests a strong trend, but the RSI at 36.11 is in oversold territory, hinting at potential short-term bounces. The Stochastic Oscillator, with %K at 42.57 and %D at 17.48, shows a bullish crossover, suggesting a potential upward move. However, the MACD is showing negative momentum, and the Bollinger Bands are below the middle band, indicating a bearish tendency. This conflicting signal between the Stochastic and other indicators suggests that the 4-hour trend is not as firmly established as the daily one, and any upward moves might be short-lived before resuming the dominant daily downtrend.
Examining the 1-hour chart provides the most immediate signals, and here, the picture is one of potential short-term exhaustion. The RSI at 70.95 is deeply overbought, and the Stochastic Oscillator (%K=65.73, %D=73.5) is showing a bearish crossover from overbought levels. The ADX at 49.72 indicates a strong trend, but when combined with overbought RSI, it suggests the current upward move might be nearing exhaustion. The MACD histogram is positive, but the MACD line is close to crossing its signal line, hinting at a potential shift in momentum. This short-term overbought condition, coupled with the prevailing bearish sentiment on longer timeframes, suggests that any rallies are likely to be capped and could offer selling opportunities for short-term traders, provided they manage risk meticulously.
The correlation with other markets cannot be overlooked. The recent news regarding oil prices, while showing some upward movement in Brent crude to $80.12 and WTI to $77.16, also hints at underlying supply concerns that could feed into inflation. If oil prices continue to climb, it could reignite inflation fears, prompting a more hawkish stance from central banks and pressuring equity markets. Conversely, falling energy prices have recently supported a dollar rally, as seen with the DXY at 100.82. This complex interplay between energy, inflation, and monetary policy creates a volatile environment for the S&P 500. The market is constantly reassessing the inflation outlook, and any data that suggests inflation is proving 'stubborn' will likely be met with a negative reaction.
The current technical setup on the SP500 presents a classic scenario of resistance meeting a prevailing bearish trend. The key resistance level identified at $6,605.07 is a critical barrier. A sustained break above this level, especially on significant volume and confirmed by bullish divergences across multiple indicators, would be required to invalidate the current bearish thesis. Until then, the path of least resistance appears to be downwards. The support levels at $6,377.47 (S1), $6,230.63 (S2), and $6,149.87 (S3) represent potential downside targets should the bearish trend reassert itself with force. Traders will be closely watching price action around these levels for signs of capitulation or consolidation.
The market's reaction to economic data releases will be paramount in the coming week. With consumer spending showing resilience but underlying fundamentals weakening, any indication of a slowdown could be a catalyst for a sharper sell-off. The Fed's stance on inflation and interest rates remains a key driver. If comments from Fed officials lean hawkish, reinforcing the idea that rates may stay higher for longer, or even rise further, this would likely weigh heavily on the SP500. Conversely, any signs of dovishness or a pivot in policy could provide a temporary boost, but given the strong bearish technicals, such rallies might be short-lived and offer opportunities for short sellers.
The interplay between the US Dollar Index (DXY) and the S&P 500 is a critical theme to monitor. At 100.82, the DXY is showing strength, particularly on the daily timeframe with an RSI of 70.32. This suggests that dollar appreciation is a dominant force, potentially drawing capital away from riskier assets like equities. A sustained rise in the DXY could signal a broader risk-off sentiment, which would typically translate into further downside pressure on the SP500. Traders must remain vigilant, as a strong dollar often acts as a headwind for corporate earnings, especially for multinational companies that derive a significant portion of their revenue from overseas.
The Nasdaq 100, often seen as a bellwether for growth stocks, presents a similar, though slightly more nuanced, picture. While its daily trend is also classified as bullish (92% strength), its 1-hour and 4-hour charts show more mixed signals than the SP500. The 1-hour RSI at 55.53 is neutral, and the MACD shows positive momentum, suggesting some short-term resilience. However, the 4-hour ADX at 13.52 indicates a weak trend, and the Stochastic Oscillator is showing a bearish crossover from overbought levels. This suggests that while the Nasdaq might experience pockets of strength, it is not immune to the broader bearish pressures affecting the equity market. Its correlation with the SP500 remains high, meaning its movements will likely mirror those of the broader index.
The Dow Jones Industrial Average (DJIA) offers another perspective, currently exhibiting a neutral trend on the daily timeframe (50% strength) but with a bearish inclination on the 1-hour chart (82% strength). The daily RSI at 57.12 is in bullish territory, but the MACD shows positive momentum with the line above the signal line, suggesting potential upside. However, the 1-hour ADX at 14.68 indicates a weak trend, and the Stochastic Oscillator is showing a bearish crossover. This mixed picture on the Dow Jones suggests it might be more sensitive to short-term fluctuations and less committed to a strong directional move compared to the SP500's pronounced daily bearish trend. Its performance will likely be influenced by the overall market sentiment and any specific news impacting blue-chip companies.
Energy markets, particularly Brent crude at $80.12 and WTI at $77.16, present a potential inflation narrative that could significantly impact central bank policy and, consequently, the S&P 500. While oil prices have seen a recent uptick, the daily charts for both benchmarks show strong bearish trends (98% for Brent, 97% for WTI). This suggests that despite the short-term gains, the underlying market sentiment for oil is bearish. If these bearish trends continue, it could alleviate some inflationary pressures, potentially giving central banks more room to consider rate cuts. However, any geopolitical flare-ups in oil-producing regions could quickly reverse this trend, leading to higher energy prices and renewed inflation concerns, which would be detrimental to equity markets.
The cryptocurrency market, with Bitcoin at $64,303 and Ethereum at $1,740.03, presents a unique set of dynamics. Bitcoin shows a bullish trend on the 1-hour chart but a neutral daily trend, while Ethereum exhibits a bullish 1-hour trend but a neutral daily trend. The daily RSI for both are in bearish territory (BTC 41.09, ETH 43.19), indicating a cooling-off period after recent rallies. The ADX readings on the daily charts are also relatively strong (BTC 36.92, ETH 39.27), suggesting established trends, albeit bearish ones. The correlation between cryptocurrencies and the broader equity market, particularly tech stocks like the Nasdaq 100, remains a key factor. If the S&P 500 experiences a significant downturn, it is likely that cryptocurrencies will follow suit, despite their own internal technical signals.
Given the prevailing bearish sentiment on the daily charts for the S&P 500, coupled with a strengthening US dollar and mixed signals from other major indices, the outlook remains cautious. The key levels to watch are the immediate resistance at $6,605.07 and the critical support at $6,377.47. A decisive break below this support level would likely confirm the continuation of the bearish trend and open the door for further declines towards $6,230.63 and $6,149.87. Conversely, a sustained move above $6,605.07, supported by bullish divergences and increasing volume, would be necessary to challenge the current bearish thesis, but this seems less probable given the current technical and fundamental backdrop.
The persistent bearish trend on the daily charts for the S&P 500, underscored by strong ADX readings and bearish RSI momentum, suggests that the recent upward price action may be a temporary retracement within a larger downtrend. While short-term indicators on the 1-hour chart show overbought conditions, hinting at potential short-term pullbacks, they do not negate the dominant bearish sentiment. The strengthening DXY and the complex macroeconomic environment further add to the caution. Investors and traders must remain vigilant, respecting the key support level at $6,377.47 and the resistance at $6,605.07, as the market navigates these challenging conditions.
Bearish Scenario: Trend Continuation
65% ProbabilityNeutral Scenario: Consolidation and Choppy Action
25% ProbabilityBullish Scenario: Short-Term Bounce
10% ProbabilityFrequently Asked Questions: SP500 Analysis
What happens if the SP500 breaks below the $6,377.47 support level?
A break below $6,377.47 on the daily chart would confirm the continuation of the bearish trend. This would likely trigger further selling pressure, with potential downside targets at $6,230.63 and $6,149.87 as market participants adjust to renewed downward momentum.
Should I consider buying the SP500 at current levels around $6,572.87 given the mixed signals?
Given the strong bearish trend on the daily chart (ADX 47.51), buying at current levels carries significant risk. While the 1-hour chart shows overbought conditions suggesting a potential short-term bounce, this is a low-probability bullish scenario (10%). A more prudent approach might be to wait for a confirmed break above $6,605.07 or a clear retest of support levels.
Is the RSI at 45.35 on the daily chart a strong sell signal for the SP500?
An RSI of 45.35 on the daily chart is considered bearish, indicating that selling momentum is stronger than buying momentum. While not an extreme oversold reading, it aligns with the overall bearish trend, suggesting that upside potential is limited and further downside is more probable.
How will the strengthening DXY at 100.82 affect the SP500 this week?
A stronger US Dollar Index (DXY) typically exerts downward pressure on US equities like the SP500. With the DXY showing a bullish trend and an RSI of 70.32 on the daily chart, this could continue to act as a headwind for the SP500, potentially limiting any upside attempts and increasing the probability of a move towards support levels.
Track markets in real-time
AI-powered analysis, technical indicators and real-time price data.
Join Our Telegram Channel
Breaking market news, AI analysis and trading signals instantly.
Join Channel