Is the current downturn in gold a temporary pause or the start of a deeper correction? XAUUSD is currently trading around the critical $4,098.15 level, a price point that has seen significant action and is now acting as a battleground between bullish and bearish forces. After a sharp decline, the precious metal is testing key support zones, leaving traders and investors on edge. The question on everyone's mind is whether this weakness will persist, driven by a strengthening dollar and shifting market sentiment, or if the fundamental appeal of gold as a safe-haven asset will prevail. This analysis delves into the intricate technical indicators, macroeconomic undercurrents, and geopolitical factors shaping the immediate future for gold.
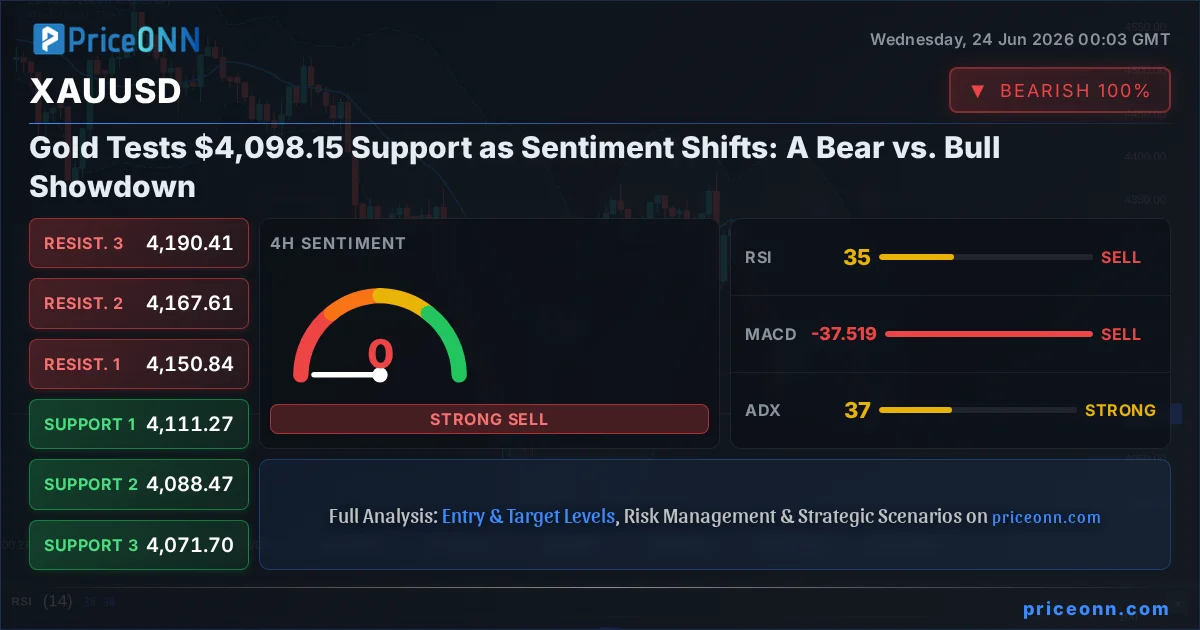
- The RSI at 33.5 signals oversold conditions on the 1-hour chart, but the overall trend remains bearish with ADX at 31.07.
- Critical support for XAUUSD sits at $4,095.92, with a decisive break below this level potentially targeting $4,078.12.
- The Dollar Index (DXY) is exhibiting strong upward momentum, currently at 101.44, increasing pressure on gold prices.
- Geopolitical tensions in the Middle East, as reported by Reuters, could provide a floor for gold, but current market sentiment favors the bears.
The narrative surrounding gold has taken a decidedly bearish turn. Following a significant drop, XAUUSD is finding itself in a precarious position, battling to hold the $4,098.15 mark. This sharp move lower, contributing to a -2.22% daily change, suggests that the bulls have lost considerable ground. The 1-hour trend analysis confirms this downward momentum, showing a strong 96% bearish trend strength with an ADX reading of 31.07, indicating a robust downtrend is in play. On this shorter timeframe, the immediate support level to watch is $4,095.92. A failure to hold this level could trigger a cascade towards the next support at $4,087.61, and potentially further down to $4,078.12. The RSI(14) at 33.5, while technically in the neutral zone, is trending downwards, mirroring the price action and suggesting that while oversold conditions might be approaching, the immediate pressure is to the downside. The MACD also reinforces this bearish outlook, showing negative momentum with the MACD line firmly below its signal line. This technical picture paints a grim short-term outlook for gold, suggesting that further declines are more probable than a swift recovery.
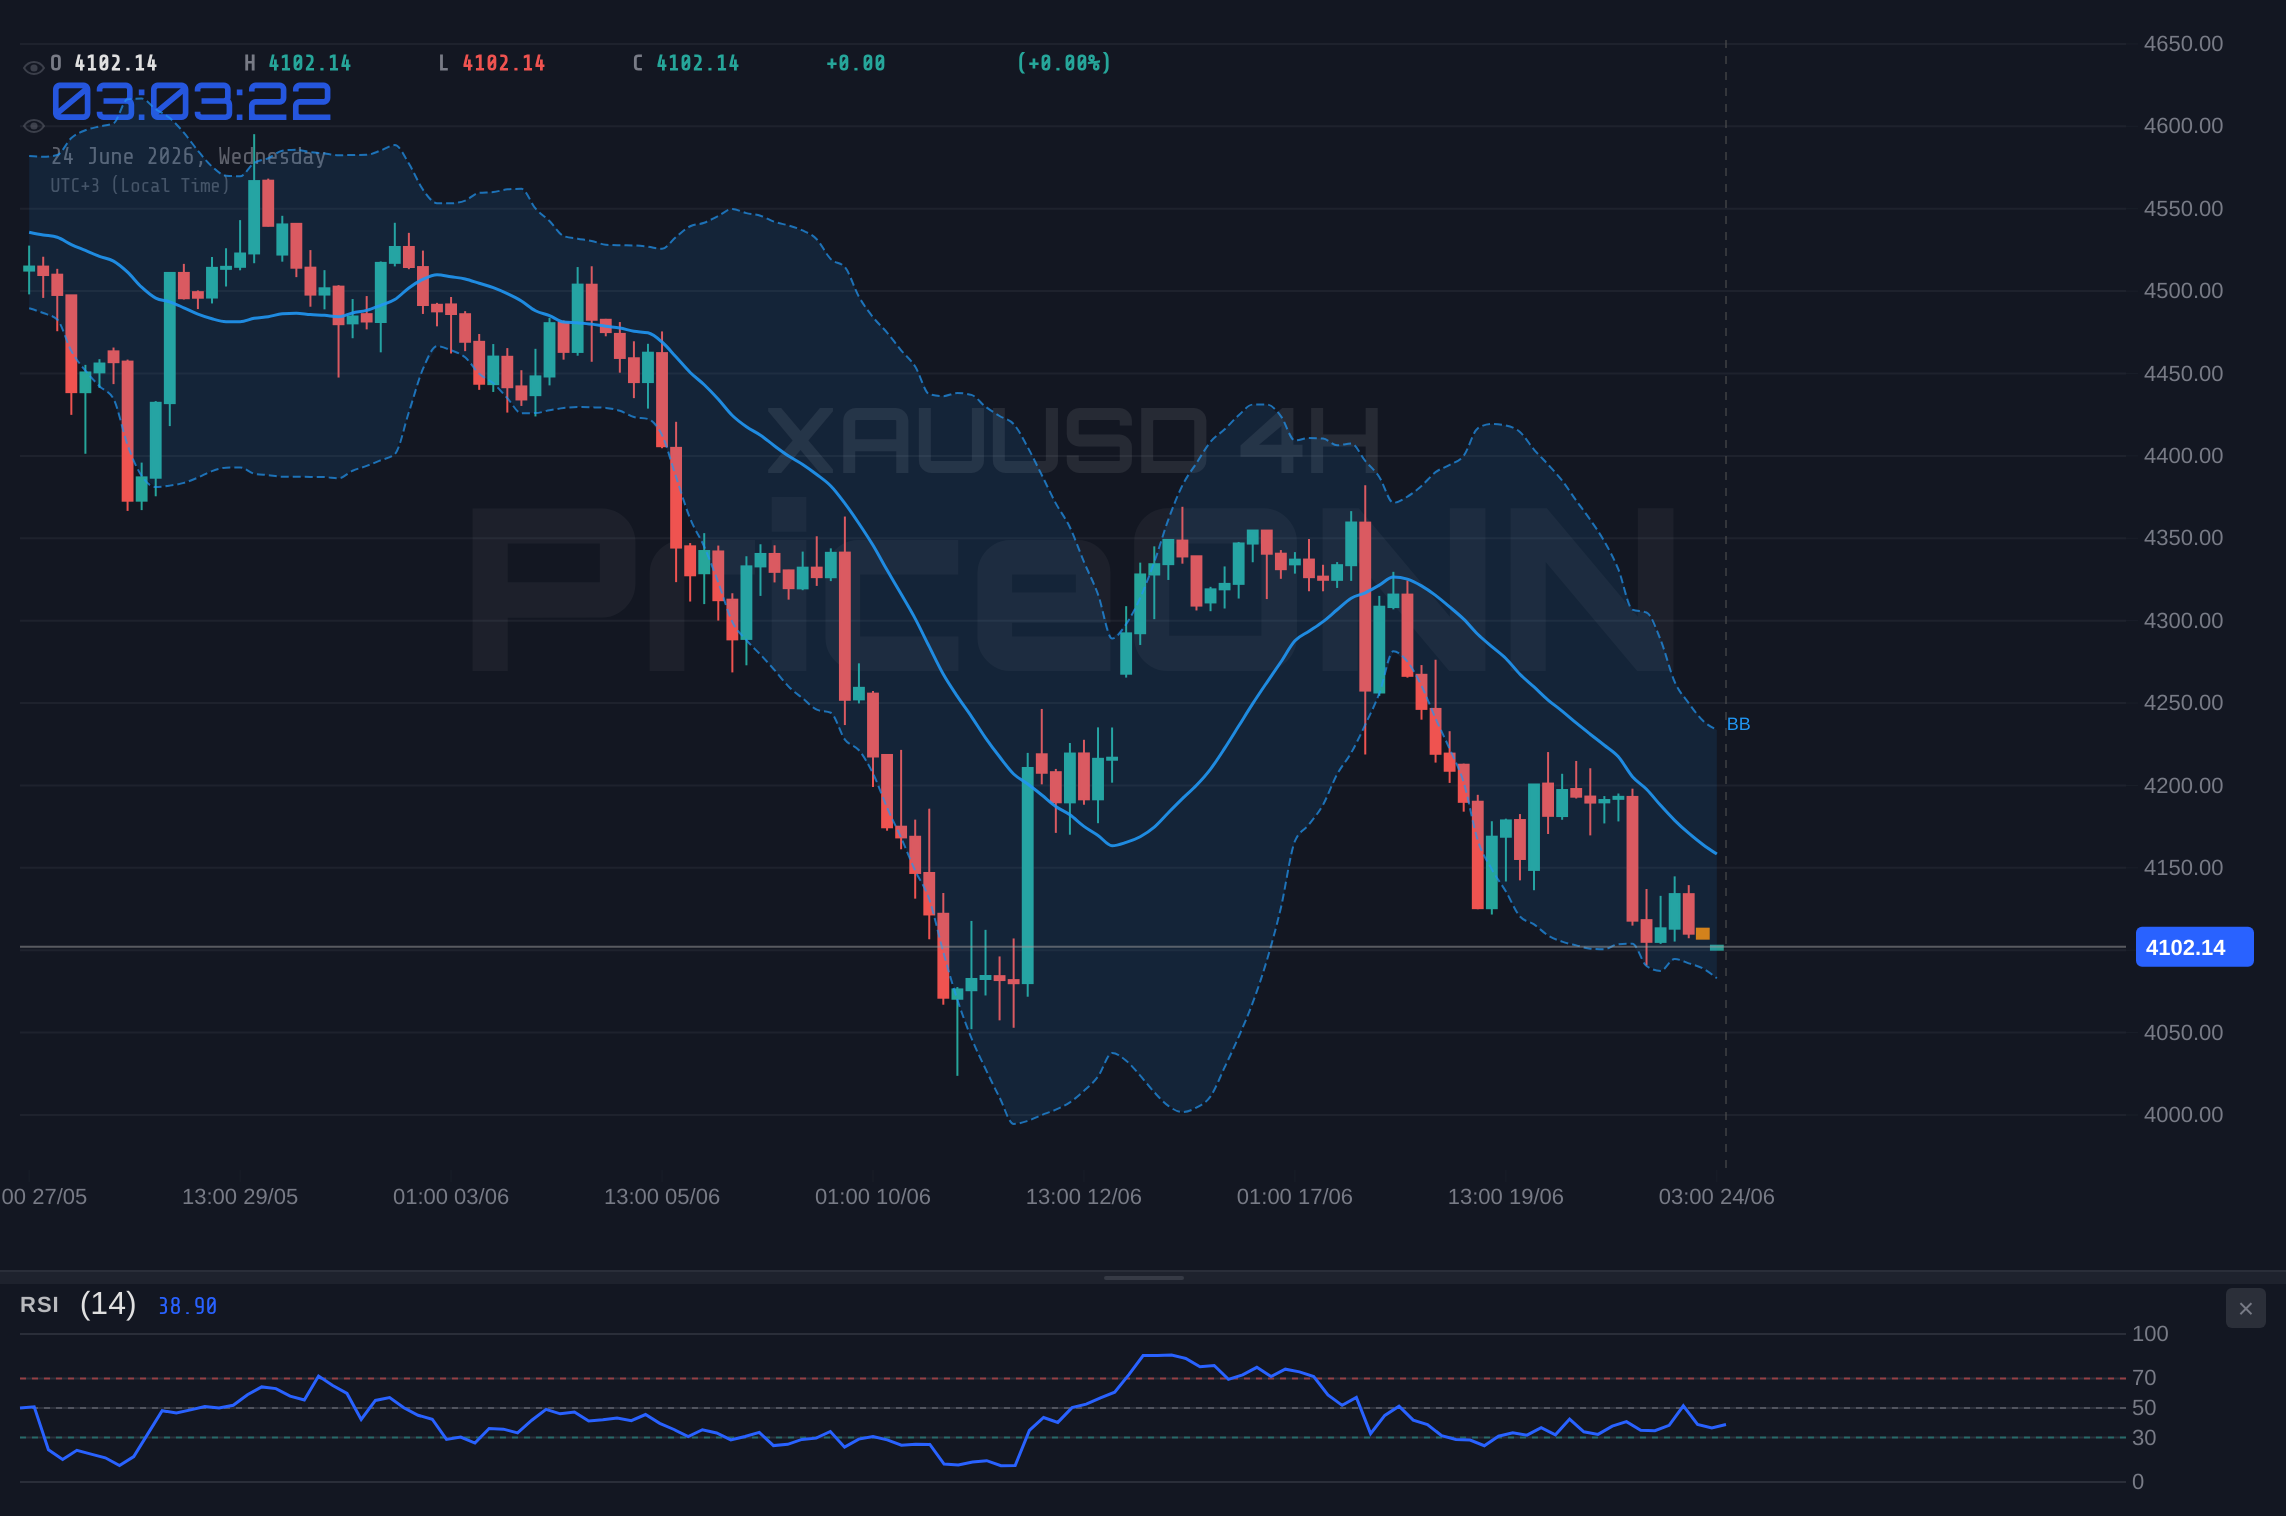
Expanding the view to the 4-hour timeframe, the picture remains predominantly bearish, though with a slight nuance of neutrality in trend strength. The trend is still firmly downwards, with an ADX of 37.46 underscoring the strength of this move. Support levels are identified at $4,111.27, $4,088.47, and $4,071.70. Resistance is capped at $4,150.84, $4,167.61, and $4,190.41. The RSI(14) at 34.79 continues to hover in the lower end of the neutral band, indicating that sellers are in command, but the market is not yet in extreme oversold territory on this timeframe. Stochastic indicators further support a bearish bias, with the %K line below the %D line, signaling potential for further downside. The Bollinger Bands are also indicating a bearish bias, with the price trading below the middle band, suggesting that the downward momentum is intact. While the overall signal across multiple timeframes leans towards 'SELL', the slight dip in trend strength from 96% on the 1H to 50% on the 4H could hint at a potential consolidation before the next major move, though the dominant trend remains undeniably down.
The daily chart analysis solidifies the bearish sentiment surrounding gold, painting a picture of a market under significant pressure. The trend is decidedly downwards, boasting a 94% strength, and the ADX at 38.26 reinforces the conviction behind this move. Key support levels on the daily chart are located at $4,144.96, $4,098.77 (which is the current price level), and $4,061.12. Resistance is firmly established at $4,228.80, $4,266.45, and $4,312.64. The RSI(14) at 34.27 continues to signal a bearish inclination, indicating ample room for prices to fall before reaching oversold territory. Similarly, the Stochastic oscillator, with %K at 34.72 and %D at 48.55, shows a clear bearish signal as the %K line is below the %D line, suggesting further price depreciation. The Bollinger Bands are also positioned below the middle band, reinforcing the prevailing downtrend. The overwhelming 'SELL' signals across all analyzed timeframes - 1H, 4H, and 1D - underline the current bearish dominance, suggesting that the path of least resistance for XAUUSD is downwards, at least in the short to medium term.
Now, let's consider the broader market context and the forces contributing to this bearish sentiment for gold. The Dollar Index (DXY) is showing robust strength, currently trading at 101.44 and experiencing a significant 0.42% daily gain. This upward momentum in the dollar, particularly with the 4H ADX at 57.97 indicating a very strong uptrend, typically exerts downward pressure on gold, as they often move inversely. The DXY's move into overbought territory (RSI at 77.1) on the 4H chart, with Stochastic also showing extreme readings, suggests that a pullback in the dollar might be due, but the trend strength remains formidable. Furthermore, the latest economic data points and central bank rhetoric are playing a crucial role. Recent news indicates that the Fed's stance remains hawkish, with Chicago Fed President Austan Goolsbee noting the key question is whether inflation stays at 3%-4%. This suggests that interest rates might remain elevated for longer, increasing the opportunity cost of holding non-yielding assets like gold. The Eurozone economy, while showing signs of stabilization with the PMI rising, still faces headwinds, which could indirectly support the dollar's strength and weigh on gold.
While geopolitical tensions in the Middle East, as highlighted by the Hormuz crisis, typically bolster gold's safe-haven appeal, the current market environment seems to be prioritizing the strength of the US dollar and rising interest rate expectations. This dynamic creates a complex interplay where traditional safe-haven demand might be suppressed by stronger macroeconomic headwinds.
The equity markets present a mixed, yet predominantly cautionary, picture that indirectly impacts gold. The S&P 500 is showing a slight daily gain of 0.74%, trading at 6572.87, and the Nasdaq 100 is down 3.01% at 29435.05. This divergence suggests a cautious risk appetite, with the tech-heavy Nasdaq experiencing a more pronounced sell-off. The S&P 500's RSI at 70.95 on the 1H chart is nearing overbought territory, hinting at potential profit-taking. Conversely, the Nasdaq's 1D trend is technically classified as bullish, but its current 4H trend is neutral with strong bearish signals, indicating underlying weakness. This mixed sentiment in equities doesn't provide a clear signal for gold; however, a sustained risk-off move, particularly in the Nasdaq, could eventually spill over and increase demand for safe-haven assets like gold, potentially offering a floor at these lower price levels. For now, the dominant bearish technicals in gold, coupled with dollar strength, seem to be outweighing any potential safe-haven bids.
Let's build the case for the bears. The overwhelming technical consensus across all timeframes points downwards. The daily chart shows a strong bearish trend (94% strength) with an ADX of 38.26. Support levels at $4,098.77 and $4,061.12 are critical. The RSI at 34.27 and Stochastic's bearish cross ($K
However, the bulls are not entirely without hope. While the immediate technical picture is bleak, certain indicators are flashing warning signs that could precede a reversal. On the 1-hour chart, the RSI at 33.5 is approaching oversold territory, and the Stochastic's %K line is showing signs of turning upwards, crossing above the %D line in some instances on shorter timeframes. Furthermore, the current price of $4,098.15 represents a significant psychological level and a historical support zone. A failure of the dollar to maintain its upward momentum, perhaps due to profit-taking after its strong rally, could provide immediate relief for gold. Additionally, any escalation in geopolitical risks, particularly concerning oil prices and the Strait of Hormuz, could trigger a flight to safety, boosting gold's appeal. Analysts are still picking Wheaton Precious Metals (WPM) as a top metals pick, suggesting underlying confidence in the sector despite current price weakness. If gold manages to hold $4,095.92 and subsequently reclaim the $4,113.72 resistance, it could signal the beginning of a short-term bounce.
The neutral scenario hinges on consolidation and indecision. This would likely occur if the DXY stalls its ascent, perhaps due to a less hawkish-than-expected tone from the Fed or if key support levels for gold, like $4,095.92, manage to hold despite selling pressure. In such a case, gold might trade within a defined range, with bulls defending lower levels and bears capping rallies around resistance points like $4,113.72. The ADX readings across timeframes, while indicating strong trends, can also signal exhaustion if price action becomes choppy. A period of consolidation would allow indicators like RSI to reset from their current positions, potentially setting the stage for a clearer directional move once a catalyst emerges. This scenario is less probable given the current strong bearish technicals and dollar strength, but it remains a possibility if external factors shift dramatically.
Trade Scenarios and Probabilities
Bearish Scenario: Downside Momentum Continues
65% ProbabilityNeutral Scenario: Consolidation Around $4,098
25% ProbabilityBullish Scenario: Bounce from Support
10% ProbabilityThe current sentiment strongly favors the bears, as evidenced by the overwhelming 'SELL' signals across multiple timeframes and the persistent strength of the DXY. Any bullish scenario would require a significant shift in macro drivers or a major geopolitical event to catalyze a safe-haven bid.
Looking at the broader economic calendar, upcoming events could inject volatility. While specific high-impact data releases for XAUUSD directly are not listed in the provided context, the general sentiment around central bank policies and inflation remains paramount. Fed officials continue to signal a data-dependent approach, but the underlying concern about sticky inflation means that any dovish pivot is unlikely in the immediate future. This environment generally favors a stronger dollar and potentially weaker gold prices. The Eurozone PMI data showing stabilization is a positive sign for the region but doesn't necessarily translate to immediate support for gold. The key will be how markets interpret future inflation and employment reports, and whether they trigger a reassessment of Fed rate cut expectations. For now, the path of least resistance for gold appears to be dictated by the strength of the dollar and the prevailing risk sentiment.
The correlation between gold and the US Dollar Index (DXY) is a cornerstone of gold market analysis. Currently, with the DXY showing strong upward momentum on the 4-hour and daily charts (ADX 57.97 and 36.2 respectively), it's creating a significant headwind for gold. The DXY's RSI readings on these timeframes are well into overbought territory (77.1 on 4H, 75.2 on 1D), suggesting a potential for a pullback. However, the trend strength remains high. If the DXY were to pull back significantly, it could offer gold a much-needed reprieve and support a potential bounce from current levels. Conversely, if the dollar continues its climb, gold is likely to face further downward pressure. This inverse relationship is critical for traders to monitor, as a shift in DXY's trajectory could be a leading indicator for gold's next major move.
The technical indicators, when viewed holistically, paint a predominantly bearish picture for XAUUSD in the short to medium term. The ADX, consistently above 30 across all timeframes (31.07 on 1H, 37.46 on 4H, 38.26 on 1D), indicates strong trending conditions, and these trends are currently downwards. RSI values are hovering in the low 30s, suggesting oversold conditions are approaching but not yet critical, leaving room for further decline. Stochastic oscillators are also signaling bearish momentum, with %K lines below %D lines, especially on the longer timeframes. MACD indicators are showing negative momentum, confirming the bearish bias. Bollinger Bands are consistently positioned below the middle band, indicating downward pressure. While the 1-hour chart shows some potential for a short-term bounce due to approaching oversold RSI, the confluence of strong bearish signals on the 4-hour and daily charts, coupled with a strengthening dollar, suggests that any upside moves may be temporary pullbacks within a larger downtrend.
From a trader's perspective, the current setup presents a challenging but potentially rewarding environment for those adept at navigating strong trends. Scalpers might look for short-term opportunities on the 1-hour chart, aiming to capitalize on bounces from immediate support levels like $4,095.92, but with tight risk management due to the prevailing downtrend. Swing traders, however, will likely focus on the daily and 4-hour charts, looking for confirmation of a trend reversal or seeking to join the established bearish trend on pullbacks towards resistance levels. The key is to respect the $4,098.15 level as a pivot point. A decisive break below it opens up lower targets, while holding it could signal a temporary reprieve. Long-term investors might see these lower prices as potential accumulation zones, but only if fundamental conditions shift significantly, such as a clear dovish pivot from the Fed or a major geopolitical crisis that unequivocally boosts safe-haven demand.
The recent news flow, while mixed, leans towards factors that could suppress gold prices. Reports of a "fresh decline below $4,265" and a "major bearish trend line" forming suggest that institutional players are actively positioning for lower prices. While geopolitical events in the Middle East could provide a volatility spike and a temporary boost to gold, the market's current focus on sticky inflation and dollar strength seems to be overshadowing these risks. The fact that gold has fallen for three consecutive weeks is a strong technical indicator of underlying weakness. Unless there's a significant shift in the macroeconomic narrative or a major geopolitical event that forces a flight to safety, the path of least resistance for XAUUSD remains downwards.
Ultimately, the battle at $4,098.15 is a reflection of conflicting market forces. The bears are empowered by a strong dollar, hawkish central bank rhetoric, and a clear bearish technical setup across multiple timeframes. The bulls, however, are watching the approaching oversold RSI levels on shorter timeframes and the potential for geopolitical events to trigger safe-haven demand. For now, the evidence overwhelmingly favors the bears. The critical support at $4,095.92 needs to hold, otherwise, the next significant downside targets loom large. Traders should remain vigilant, manage risk tightly, and wait for clear confirmation before committing to a directional trade.
Frequently Asked Questions: XAUUSD Analysis
What happens if XAUUSD breaks decisively below the $4,095.92 support level?
A break below $4,095.92 would invalidate the short-term support and likely accelerate selling pressure. The next significant downside target would be $4,087.61, followed by $4,078.12 on the daily chart, as indicated by the technical analysis.
Should I buy XAUUSD at current levels around $4,098.15 given the RSI is nearing oversold on the 1-hour chart?
Buying at current levels is a high-risk proposition given the strong bearish trend on longer timeframes (4H and 1D) and the rising DXY. While the 1H RSI is approaching oversold, confirmation of a bullish reversal, such as holding $4,095.92 and breaking above $4,113.72, is needed before considering a long position.
Is the current RSI at 33.5 a sell signal for XAUUSD right now?
An RSI of 33.5 is not typically a direct sell signal; it indicates a lack of buying momentum and proximity to oversold conditions. However, in the context of a strong downtrend confirmed by ADX 31.07, it suggests that while prices may have fallen sharply, the trend is still very much intact, and further declines are possible before oversold territory is reached.
How will the strong DXY at 101.44 affect XAUUSD this week?
The strong DXY at 101.44 generally exerts downward pressure on XAUUSD due to their inverse correlation. If the dollar continues its rally, gold is likely to face further headwinds, potentially pushing prices towards the support levels identified around $4,078.12. A pullback in the DXY would be a prerequisite for any significant gold recovery.
Track markets in real-time
AI-powered analysis, technical indicators and real-time price data.
Join Our Telegram Channel
Breaking market news, AI analysis and trading signals instantly.
Join Channel