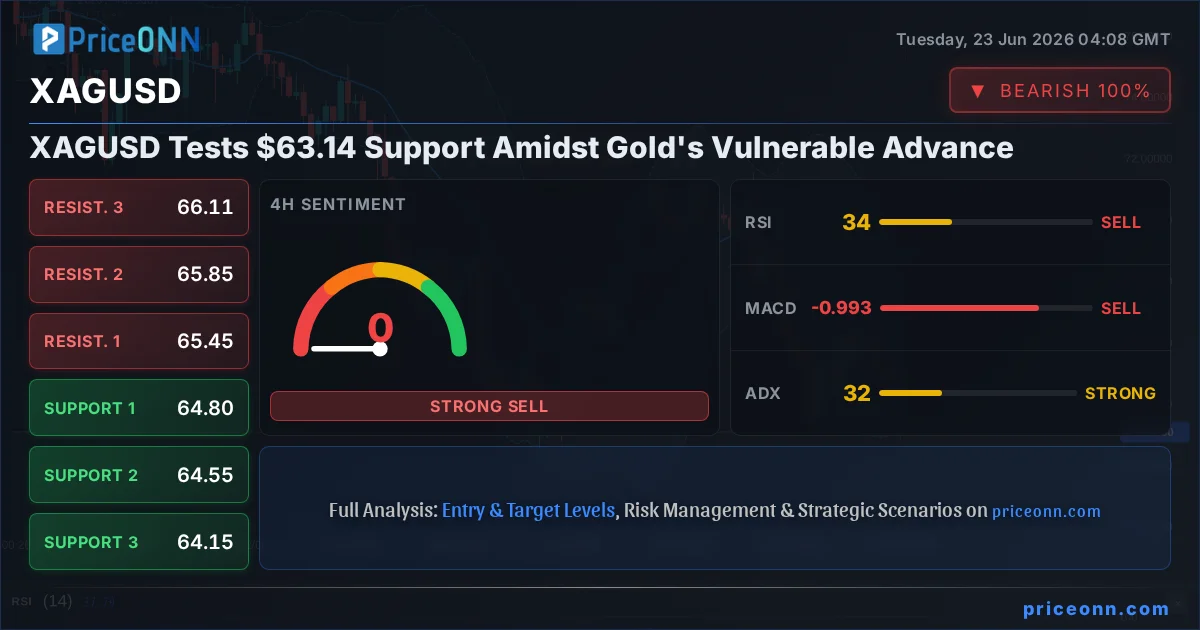
Is the $63.14 level a line in the sand for silver, or just another pause before the next slide? The precious metal is currently navigating a challenging landscape, perched precariously near key support levels as its larger counterpart, gold, experiences a vulnerable advance. With the daily chart flashing a predominantly 'SELL' signal across multiple timeframes, traders are scrutinizing every tick for clues about the next significant move. The current price of $63.14 for XAGUSD sits at a critical juncture, reflecting a broader market sentiment that is beginning to question the sustainability of recent gains in precious metals, especially as the US Dollar Index (DXY) shows signs of renewed strength.
- RSI at 25.9 on the 1H chart signals extreme oversold conditions, potentially offering a short-term bounce opportunity.
- Critical support for XAGUSD sits at $62.95, a level that has seen significant price action historically.
- The ADX reading of 31.73 on the 4H chart indicates a strong existing trend, which, combined with negative MACD momentum, favors further downside.
- DXY strength at 101.05 is correlated with pressure on XAGUSD, suggesting a continued bearish outlook for silver if the dollar remains firm.
Navigating the Silver Minefield: A Technical Deep-Dive
The technical tapestry woven for XAGUSD presents a complex picture, dominated by a pervasive 'SELL' signal across its hourly, 4-hour, and daily timeframes. On the 1-hour chart, the Relative Strength Index (RSI) hovers at 25.9, firmly entrenched in oversold territory. While this might typically signal a potential rebound, the accompanying ADX reading of 25.96 suggests that the underlying trend, despite its current weakness, still holds sway. The MACD is firmly below its signal line, reinforcing negative momentum, and the Stochastic oscillator's %K line is below %D, further underscoring the bearish bias. Even Bollinger Bands are signaling an extreme move, trading below the lower band, which historically can precede a sharp reversal or a continuation of the downtrend. This confluence of indicators on the shorter timeframe paints a picture of immediate weakness, but the overall trend strength is still developing.
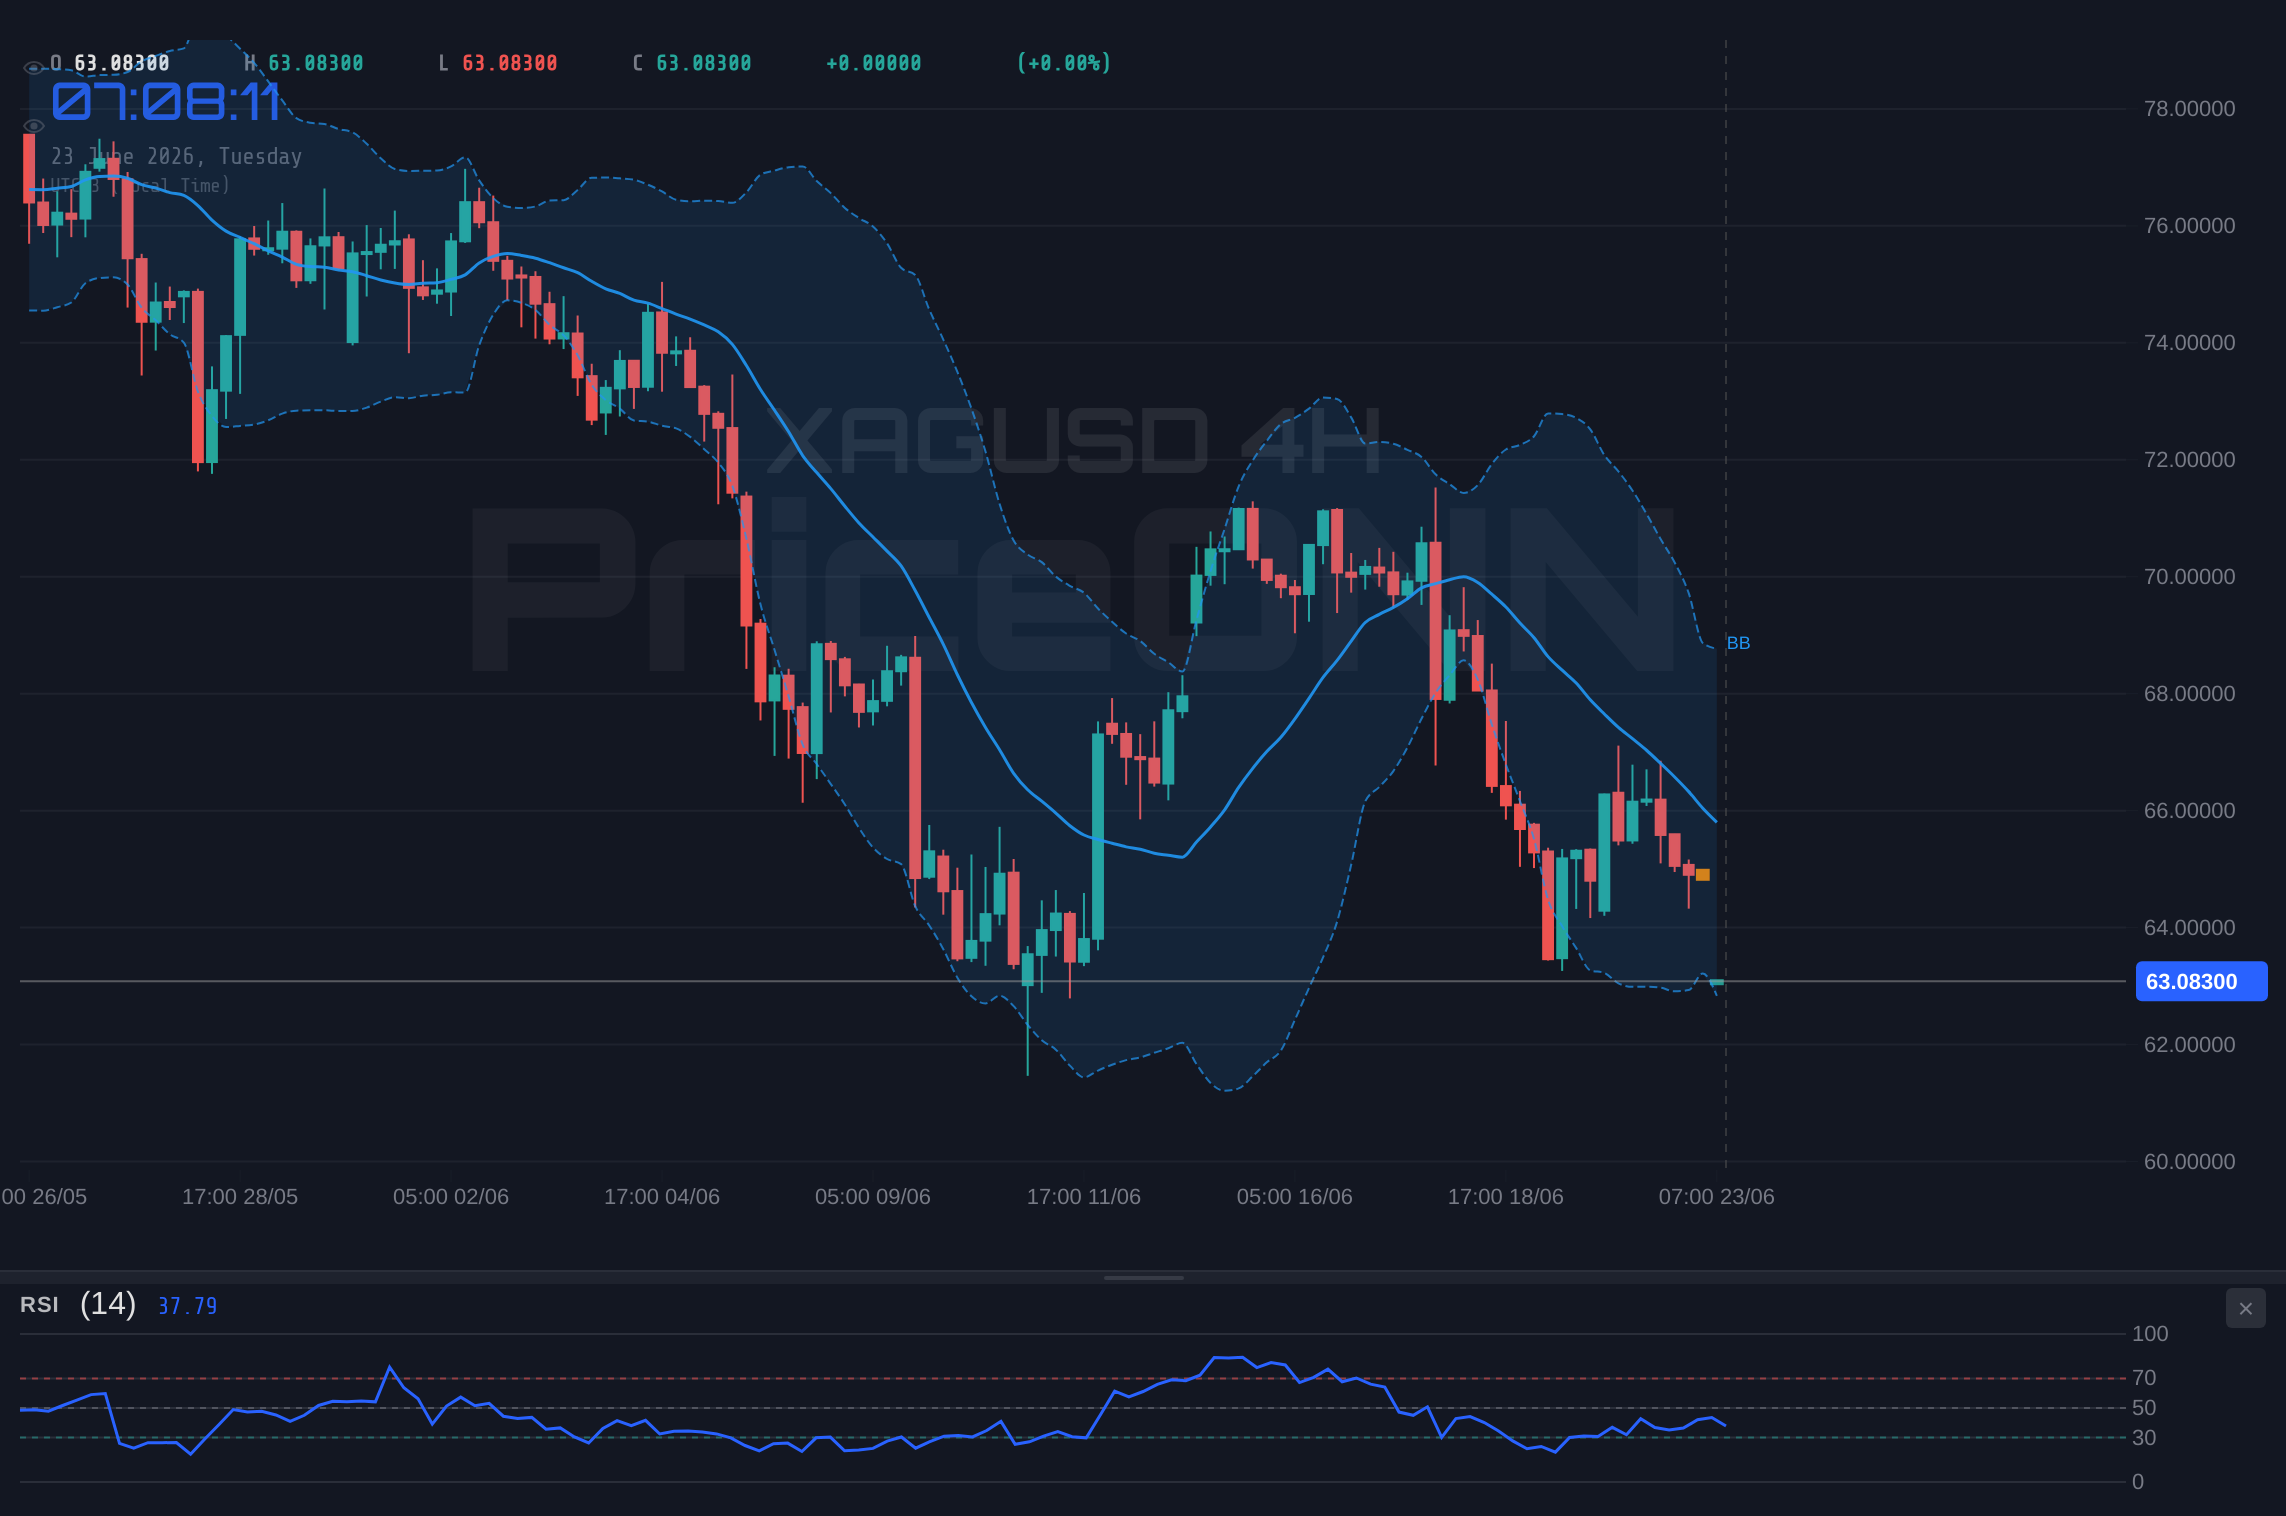
Stepping out to the 4-hour timeframe, the narrative intensifies. The trend remains neutral in terms of power, yet the indicators lean heavily towards the bearish side. The RSI sits at 33.97, still deep in the neutral zone but trending downwards, indicating a lack of buying conviction. MACD continues its negative trajectory, confirming that sellers are in control of the momentum. Price action below the middle Bollinger Band reinforces the bearish inclination. Stochastic oscillators are also showing a bearish cross, with %K below %D, suggesting further downward pressure. Crucially, the ADX here strengthens considerably to 32.84, indicating a robust trend is firmly in place. This suggests that the short-term oversold conditions on the 1-hour chart might be mere pauses in a larger downtrend, rather than precursors to a significant rally. The overall signal across this timeframe remains a strong 'SELL'.
The daily chart provides the broadest perspective, and it confirms the prevailing bearish sentiment. The trend is decidedly bearish, with a power rating of 94%. The RSI at 36.22, while not yet in extreme oversold territory, clearly indicates a downward bias, suggesting ample room for further price depreciation before any significant buying interest might emerge. MACD's negative momentum and position below the signal line are consistent across all examined timeframes, acting as a strong confirmation of selling pressure. Price trading below the middle Bollinger Band on the daily chart is a classic bearish signal, often preceding further declines. The Stochastic oscillator continues its downward trend, and the ADX at 38.04 signifies a strong, established bearish trend. The overwhelming 'SELL' signal across all major timeframes from the daily down to the hourly paints a rather grim technical picture for silver, with the $63.14 price point appearing more as a potential pit stop than a solid floor.
Gold's Precarious Ascent and Silver's Shadow
The narrative for silver cannot be told in isolation; its close relationship with gold, currently trading at $4,144.36, provides crucial context. While gold has seen its own fluctuations, its recent advance appears increasingly vulnerable. Market sentiment, as indicated by the S&P 500's strong performance on the day (up 0.74% to 6572.87) and the Nasdaq's slight pullback (down 0.89% to 30078.52), suggests a cautious risk appetite. Typically, a rising S&P 500 might correlate with a weaker DXY, but today, the Dollar Index is showing resilience, trading at 101.05. This divergence is key: a strengthening dollar often puts pressure on dollar-denominated commodities like gold and silver. Recent news highlights this vulnerability, with reports indicating gold's advance is looking less secure, falling below the $4,265 support and forming bearish trend lines. The fact that gold has fallen for three consecutive weeks, testing lows not seen since early June, underscores the fragility of its recent uptick. This environment directly impacts silver, amplifying its existing technical weakness.
The geopolitical landscape also adds a layer of complexity. While the 'Hormuz Crisis Sparks a Middle East Pipeline Boom' headline suggests potential energy market volatility, which can sometimes spill over into safe-haven assets, the overarching trend in precious metals seems to be dictated more by macroeconomic factors and central bank policy expectations. The 'Fed's Goolsbee: Key Question Is Whether Inflation Stays at 3%-4%' statement from Chicago Fed President Austan Goolsbee is particularly relevant. If the Federal Reserve remains vigilant about inflation, it could signal a longer-term higher interest rate environment, which generally acts as a headwind for non-yielding assets like gold and silver. The market's reaction to such statements, often reflected in bond yields and currency movements, will be paramount. Currently, the DXY's strength at 101.05 suggests that the market is pricing in a degree of hawkishness or at least a steady-state policy from the Fed, which isn't ideal for precious metals.
Key Levels and Potential Scenarios for XAGUSD
Analyzing the chart for XAGUSD, the immediate support level to watch is $62.95, followed by $62.63 and $62.05. These levels represent the immediate downside targets if the selling pressure intensifies. On the upside, resistance is found at $63.85, $64.43, and more significantly, $64.75. A decisive break above these resistance levels would be needed to challenge the prevailing bearish sentiment, but current technicals offer little encouragement for such a move.
The ADX at 31.73 on the 4-hour chart and 38.04 on the daily chart are particularly telling. These readings indicate strong trend strength, meaning that current price action is not merely noise but representative of a prevailing market direction. Given the consistent 'SELL' signals across timeframes and the negative momentum indicated by MACD, the path of least resistance appears to be downwards. The RSI readings, while oversold on the 1-hour chart, are still in neutral territory on the 4-hour and daily charts, suggesting that further declines are plausible without triggering an immediate oversold bounce.
The correlation with DXY is also a critical factor. With the Dollar Index currently trading at 101.05 and showing a strong upward trend on the 4-hour chart (ADX 52.17), this typically translates to headwinds for silver. The strength in the dollar, especially if it continues to climb towards the daily resistance of 101.14, could put further pressure on XAGUSD, potentially pushing it towards the daily support levels identified around $61.49. Conversely, any significant weakness in the DXY, perhaps triggered by dovish signals from the Fed or a sudden shift in risk sentiment, could offer a reprieve for silver, but the current data does not strongly support this outcome.
Considering the overall technical picture and market correlations, a bearish outlook for XAGUSD seems most probable in the short to medium term. The strong trend signals, negative momentum indicators, and the resilience of the US dollar all point towards potential further downside. However, the oversold condition on the 1-hour RSI does warrant caution, as it could lead to short-term bounces or increased volatility. The key will be whether price action can decisively break below the current support levels or if buyers can step in to defend the $62.95 area.
Bearish Scenario: Silver's Slide Continues
65% ProbabilityNeutral Scenario: Consolidation Near Support
25% ProbabilityBullish Scenario: Short-Term Bounce from Oversold
10% ProbabilityThe Road Ahead: Risk Management is Key
The current market environment for XAGUSD is fraught with technical signals pointing towards further weakness, amplified by a strengthening US dollar and potential headwinds from inflation concerns. While the 1-hour RSI offers a glimmer of a potential short-term oversold bounce, the overwhelming 'SELL' signals across 4-hour and daily charts, coupled with strong ADX readings indicating robust trend strength, suggest that any rallies may be short-lived. Traders should exercise extreme caution. The critical support level at $62.95 is the immediate focal point; a decisive breach below this could trigger cascading sell orders towards $62.63 and potentially $62.05. Conversely, a sustained move above the $63.85 resistance, ideally with increasing volume and followed by a break of $64.43, would be required to invalidate the bearish thesis and signal a potential trend reversal. Given the strong bearish alignment, risk management should be paramount. Entries should be carefully timed, ideally on pullbacks towards resistance levels if considering short positions, or waiting for a confirmed break of support with follow-through volume for confirmation.
The recent news flow, particularly comments from Fed officials regarding inflation staying at 3%-4%, reinforces the idea that interest rates might remain elevated for longer. This macro backdrop is inherently unfavorable for precious metals. The correlation with the DXY, currently at 101.05 and showing strong upward momentum, further solidifies the bearish case for XAGUSD. Investors and traders must remain vigilant, closely monitoring the $62.95 support level. A break here could signal the start of a more significant downward move, targeting lower price points. The market is cyclical, and while the current trend favors sellers, opportunities can emerge from unexpected shifts in central bank policy or geopolitical events. Patience and disciplined risk management will be crucial in navigating these choppy waters. The key takeaway is that while oversold conditions exist on shorter timeframes, the larger trend remains bearish, and any upward movement should be viewed with skepticism until stronger bullish confirmations emerge, such as a sustained break above the $64.75 resistance level.
Frequently Asked Questions: XAGUSD Analysis
What happens if XAGUSD breaks below the critical $62.95 support level?
A break below $62.95 on XAGUSD would likely trigger further selling, potentially targeting the next support levels at $62.63 and $62.05. This scenario is supported by the strong bearish trend indicated by ADX readings above 30 on multiple timeframes and negative MACD momentum.
Should I consider buying XAGUSD at current levels around $63.14 given the oversold RSI on the 1H chart?
While the 1H RSI at 25.9 suggests oversold conditions, the overall trend across 4H and daily charts remains bearish. A cautious approach is advised; consider waiting for confirmation, such as a bounce from $62.95 with strong volume, or a decisive break above the $63.85 resistance before considering any long positions.
Is the RSI at 25.9 a strong sell signal for XAGUSD right now?
An RSI of 25.9 on the 1-hour chart indicates extreme oversold conditions, which technically suggests a potential for a short-term bounce rather than a direct sell signal. However, when viewed alongside the strong downtrend signals from MACD and ADX on higher timeframes, it highlights potential for continued downside after a brief consolidation or reversal.
How will the Fed's stance on inflation affect XAGUSD this week?
If Fed officials continue to emphasize persistent inflation, as suggested by comments about it staying at 3%-4%, it could support a higher-for-longer interest rate narrative. This scenario generally puts pressure on non-yielding assets like silver, potentially pushing XAGUSD lower, especially if the DXY strengthens in response.
| Indicator | Value | Signal | Interpretation |
|---|---|---|---|
| RSI (14) | 25.9 | Oversold | Potential short-term bounce, but trend remains bearish. |
| MACD Histogram | -0.75 | Negative Momentum | Sellers are in control; downside pressure likely. |
| Stochastic | K=10.44, D=11.52 | Bearish Cross | Further downside potential indicated. |
| ADX | 25.96 | Strong Trend | Current trend (bearish) is well-established. |
| Bollinger | Lower Band | Breakout | Extreme move; watch for continuation or reversal. |
Track markets in real-time
AI-powered analysis, technical indicators and real-time price data.
Join Our Telegram Channel
Breaking market news, AI analysis and trading signals instantly.
Join Channel