Now this is where it gets interesting! Having spent months in a relentless climb, gold has finally shown signs of fatigue, testing a crucial psychological and technical level around $4,144.94. This isn't just a minor pullback; the data paints a picture of a market grappling with shifting sentiment and a robust bearish trend that's starting to assert its dominance. For traders watching the yellow metal, the question isn't *if* there's a move coming, but *which direction* and *how far*.
- RSI at 34.02 on the 1H chart signals waning bullish momentum, edging closer to oversold territory.
- The critical support level for XAUUSD is $4,140.98, a breach of which could accelerate the decline.
- MACD histogram readings across multiple timeframes indicate negative momentum, suggesting sellers are gaining an upper hand.
- The Dollar Index (DXY) at 101.05 is showing strength, putting downward pressure on gold as a classic inverse correlation plays out.
The recent price action for XAUUSD, currently hovering around $4,144.94, is telling a story of caution. After a period of significant upside, the precious metal has entered a phase of retracing its gains. On the 1-hour chart, the trend is neutral, but the strength is only 50%, indicating a lack of conviction from either bulls or bears to fully take control. However, the technical indicators are starting to lean towards the downside. The RSI(14) is sitting at 34.02, firmly in neutral territory but showing a downward inclination, suggesting that the buying pressure is indeed easing. This is a crucial observation, as it precedes potential moves into oversold territory if the downward momentum continues. The MACD is also painting a bearish picture, with negative momentum and the MACD line crossing below its signal line, a classic bearish signal that traders watch closely for potential short entries or a tightening of risk management on existing long positions. The Stochastic oscillator, with K=14.99 and D=41.36, further reinforces this bearish sentiment, clearly showing %K below %D, a sign that the bears are starting to dictate the short-term price action. The ADX at 18.46 is low, suggesting a weak trend, which could mean the current move is more of a correction within a larger trend, or it could signal the start of a new, stronger trend if key levels break. The overall signal on the 1-hour timeframe is a clear 'SELL', with 8 out of 8 indicators pointing downwards.
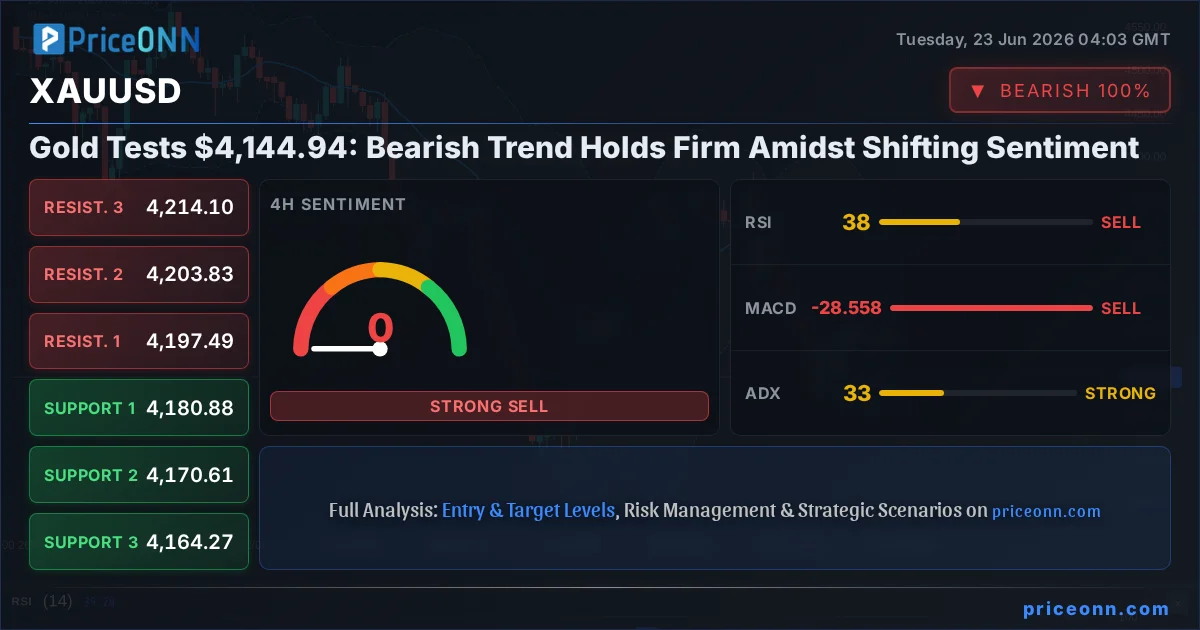
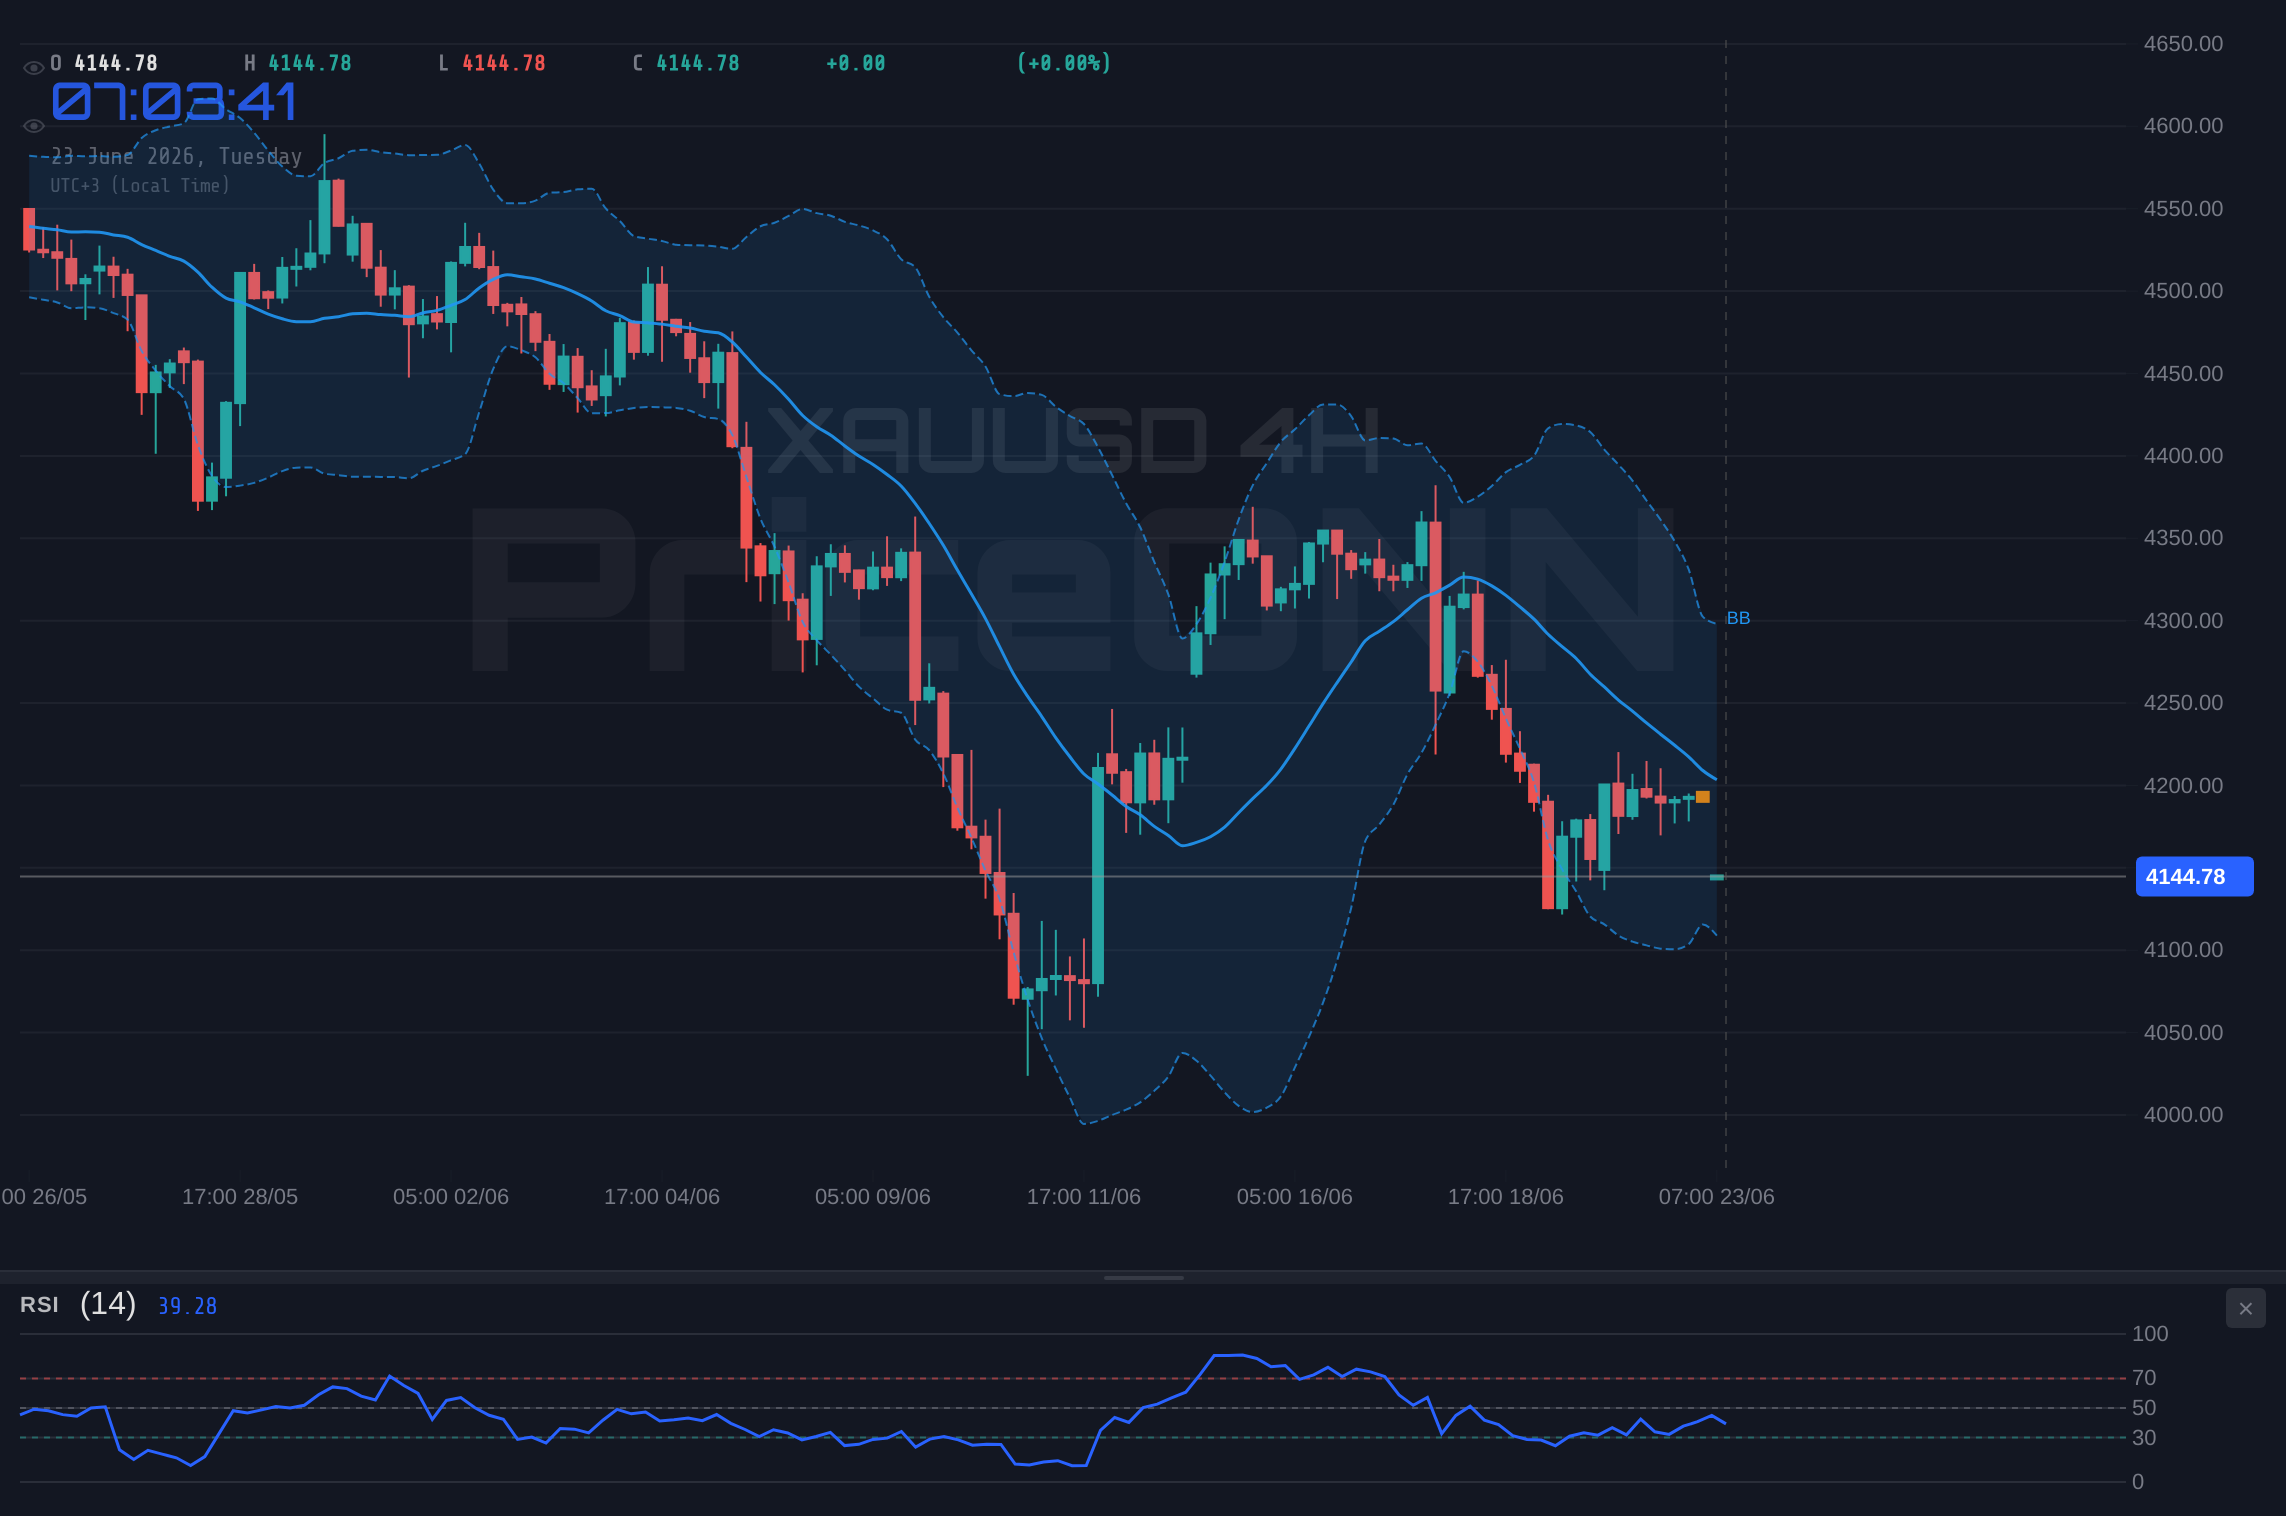
Zooming out to the 4-hour timeframe, the picture becomes even more telling. Here, the trend is still officially neutral, but the strength remains at 50%, mirroring the indecision seen on the shorter timeframe. However, the technical indicators are more aligned with a bearish outlook. The RSI(14) is at 37.59, still in neutral territory but showing a clear downward trajectory. This reinforces the idea that the buying spree might be over, and sellers are becoming more aggressive. The MACD continues its negative momentum, with the MACD line stubbornly below its signal line, a persistent bearish sign. The Bollinger Bands are also showing a bearish inclination, with the price trading below the middle band, suggesting a downward trend is forming or strengthening. The Stochastic oscillator, with K=49.86 and D=56.34, is also showing a bearish signal as %K is below %D, indicating a potential continuation of the downward move. What's particularly concerning for the bulls is the ADX, which has climbed to 32.83. This signifies a strong trend is in play, and given the other indicators, it points towards a strong bearish trend. The aggregated signal for the 4-hour chart is a 'SELL', with all 8 indicators aligning for a bearish outlook. This confluence of bearish signals across different timeframes cannot be ignored.
The daily chart provides the broader context, and here, the trend is unequivocally 'DOWNSIDE' with a strength of 94%. This long-term bearish trend is the most significant factor influencing gold's price right now. The current price of $4,144.94 is dangerously close to the daily support level of $4,144.96. A break below this level would be a significant event, potentially triggering further selling pressure. The RSI(14) on the daily chart stands at 36.24, indicating that while not yet in oversold territory (typically below 30), it is moving in that direction, confirming the bearish sentiment. The MACD continues to show negative momentum, with the MACD line below the signal line, reinforcing the bearish outlook on a longer timeframe. Bollinger Bands are also positioned below the middle band, a common characteristic of a downtrend. The Stochastic oscillator, with K=39.08 and D=49.27, continues to signal a bearish trend as %K remains below %D. The ADX at 38.04 confirms a strong downtrend is in motion. The overwhelming 'SELL' signal across all daily indicators, with 8 out of 8 indicators pointing to a sale, solidifies the bearish conviction. This daily trend is the bedrock upon which any short-term trading decisions must be made. Any significant upward movement would likely be a counter-trend move in the face of this dominant daily bearish posture.
Gold's Vulnerability: Correlation with a Stronger Dollar
The strength of the Dollar Index (DXY), currently trading at 101.05 and showing a 0.03% daily increase, is a significant headwind for gold. Historically, gold and the DXY share an inverse relationship; as the dollar strengthens, gold tends to weaken, and vice versa. This is because gold is often priced in dollars, making it more expensive for holders of other currencies when the dollar appreciates. The DXY's current uptrend, particularly its strong performance on the 4-hour chart with an ADX of 52.17, signals robust momentum. On the 1-hour chart, the DXY shows a bullish trend with 6 out of 8 indicators suggesting a buy. While on the 4-hour, it's a strong buy signal. Even on the daily chart, the DXY is in a strong uptrend, with an ADX of 35.85. This sustained dollar strength directly correlates with the bearish pressure observed on XAUUSD. The fact that the DXY is pushing higher, especially with its strong daily trend, suggests that the environment is becoming less favorable for gold. This correlation is not merely academic; it's a fundamental driver that traders must consider. The $4,144.94 price level for gold is being tested precisely when the dollar is showing resilience. If the DXY continues its upward march, it will likely drag gold prices lower, testing the support levels we've identified.
Technical Breakdown: What the Indicators Are Saying
Let's dive deeper into the technical signals. On the 1-hour chart, the RSI at 34.02 suggests that while gold isn't deeply oversold, the buying enthusiasm has significantly cooled. A move below 30 would signal extreme bearish conditions, but the current level indicates a weakening bullish momentum that could precede a sharper fall. The MACD's negative momentum on this timeframe is a clear warning sign for bulls. It indicates that the recent upward moves have been losing steam and that selling pressure is building. The Stochastic oscillator's position below its signal line further confirms this short-term bearish bias. The ADX reading of 18.46 on the 1H chart is quite low, which normally suggests a lack of trend. However, when viewed in conjunction with the daily and 4-hour charts, which show stronger trends, it might indicate that the current price action is a pause before the established trend resumes. The 4-hour ADX at 32.83, however, is a strong signal that a trend is indeed in play, and given the other indicators, it's a bearish trend. This trend strength suggests that any attempts to reverse the price might face significant headwinds.
The daily indicators provide a more definitive picture. The RSI at 36.24 is moving towards the oversold zone, but importantly, it's still trending downwards. This means that even as the price approaches levels where historically buyers have stepped in, the underlying momentum is still bearish. The MACD on the daily chart continues to show negative momentum, a persistent sign of weakness that has been in play for some time. The fact that it remains below the signal line indicates that the bears are in control of the longer-term trend. Bollinger Bands on the daily chart are also showing a bearish bias, with the price trading below the middle band, a common indicator of a downtrend. The Stochastic oscillator, with K=39.08 and D=49.27, continues to signal a bearish trend, as %K remains below %D. The ADX at 38.04 is a particularly strong confirmation of a robust downtrend. A reading above 25 generally indicates a strong trend, and 38.04 is well into that territory. This suggests that the current price action is not just a minor fluctuation but a significant directional move that is likely to continue unless a major catalyst intervenes. The confluence of these daily indicators paints a clear picture: the path of least resistance for gold is currently downwards.
Navigating the Support and Resistance Levels
For any trader, understanding the key price levels is paramount. On the 1-hour chart, the immediate support is seen at $4,140.98, followed by $4,135.27 and $4,124.12. Resistance levels are noted at $4,157.84, $4,168.99, and $4,174.7. The current price of $4,144.94 sits precariously close to the first support level. A decisive break below $4,140.98 could trigger a rapid move towards the subsequent support levels. On the 4-hour chart, the support levels are slightly higher, at $4,180.88, $4,170.61, and $4,164.27, while resistance is observed at $4,197.49, $4,203.83, and $4,214.1. This suggests that the short-term resistance is just above the current price, while the immediate support is quite close. The daily chart, however, presents the most significant levels: support at $4,144.96 (almost exactly where the price is trading), $4,098.77, and $4,061.12. The resistance levels on the daily chart are considerably higher, at $4,228.8, $4,266.45, and $4,312.64. The proximity of the current price to the $4,144.96 daily support level is critical. A failure to hold this level could lead to a cascade effect, pushing gold towards the $4,098.77 mark. Conversely, a strong bounce from this level, coupled with increasing bullish momentum, might signal a potential reversal, targeting the daily resistance levels. The battle at $4,144.94 is the immediate focus for traders.
Geopolitical Undercurrents and Inflationary Fears
While the technicals are painting a bearish picture, it's crucial to consider the broader market context. Recent news highlights geopolitical tensions, particularly concerning the Strait of Hormuz, which has sparked a boom in Middle East pipelines as India rethinks its energy strategy. While this directly impacts oil prices, it also contributes to a general undercurrent of risk aversion in the markets. This risk aversion typically benefits safe-haven assets like gold. However, the current price action suggests that other factors are currently outweighing this safe-haven demand. The analyst recommendations favoring Wheaton Precious Metals (WPM) as a top metals pick, as noted in recent reports, might suggest some underlying positive sentiment in the precious metals sector, but it hasn't translated into upward price momentum for gold itself. Furthermore, comments from Fed officials, such as Chicago Fed President Austan Goolsbee emphasizing the key question of whether inflation stays at 3%-4%, indicate that the Federal Reserve remains vigilant about inflation. Persistent inflation concerns typically support gold as an inflation hedge. However, the market seems to be prioritizing the Fed's potential hawkish stance over inflation hedging at this moment. The fact that gold has fallen for three consecutive weeks, starting near $4,150 USD per troy ounce, its lowest level since June 11th, underscores the prevailing bearish sentiment, despite these fundamental underpinnings that could theoretically support prices.
Scenario Analysis: What Could Happen Next?
Given the current technical setup and market sentiment, we can map out potential scenarios. The strong bearish trend on the daily chart, coupled with the proximity to key support levels, makes the downside scenario the most probable. However, the market is dynamic, and unexpected shifts can occur.
Bearish Scenario: Downside Acceleration
70% ProbabilityNeutral Scenario: Consolidation Around Support
20% ProbabilityBullish Scenario: Reversal Attempt
10% ProbabilityThe most probable path, given the overwhelming bearish signals on the daily chart and the ADX strength, is a continuation of the downtrend. A break below the immediate 1-hour support at $4,140.98 could accelerate the selling, targeting the more significant daily support at $4,098.77. The 70% probability assigned to this scenario reflects the strong bearish trend and the confluence of negative indicators. The neutral scenario, with a 20% probability, suggests a period of consolidation if the $4,140.98 support holds but the price fails to gain upward momentum, potentially trading sideways between the immediate 1-hour support and resistance levels. A bullish reversal, while possible, appears less likely at this juncture, hence the 10% probability. This would require a decisive break above resistance levels, accompanied by a significant shift in momentum, which is not currently indicated by the indicators. Traders should be prepared for the possibility of a downside move, but remain alert for any signs of a bullish turnaround.
The Trader's Perspective: What to Watch Now
For short-term traders, the key watchpoint is the $4,140.98 level. A break below this on increasing volume would likely signal an opportune moment to enter short positions, targeting the $4,135.27 and subsequently the $4,098.77 levels. Stop-losses should be placed above the immediate resistance, perhaps around $4,157.84, to manage risk effectively. Patience is crucial here; waiting for the break and confirmation is more important than chasing the move. For swing traders, the daily chart's bearish trend is the dominant factor. They should be looking for opportunities to short pullbacks, with the $4,157.84 to $4,174.7 range on the 1-hour chart acting as a potential area to enter short positions if the price fails to break higher. The $4,098.77 level on the daily chart becomes a significant target for a more extended bearish move. Long-term investors might see this pullback as a potential opportunity to accumulate gold at lower prices, especially if the price holds the $4,098.77 support. However, given the current bearish trend strength (ADX 38.04 on daily), caution is warranted. Waiting for a clear bullish reversal pattern on the daily chart, such as a higher high and higher low formation, would be prudent before considering long-term buys. The current environment demands a risk-defined approach, focusing on downside potential while being prepared for a potential reversal if key resistance levels are decisively broken.
The current market sentiment, as reflected in the S&P 500's 0.74% gain and Nasdaq's 0.81% drop, shows a mixed appetite for risk. While the S&P 500 is climbing, suggesting some risk-on sentiment, the Nasdaq's decline could indicate tech sector weakness or a broader rotation. This mixed signal adds a layer of complexity. Typically, a strong S&P 500 would weigh on gold, but the Nasdaq's dip might be interpreted as a sign of caution, which could indirectly support gold as a safe haven. However, the dominant factor remains the dollar's strength, which is currently overshadowing any safe-haven appeal. The energy markets are also showing some weakness, with Brent crude down 0.43% and WTI down 0.46%. Lower oil prices can sometimes correlate with lower inflation expectations, which could reduce the appeal of gold as an inflation hedge. This complex interplay of factors - a strong dollar, weakening energy prices, and a mixed equity market - all contribute to the bearish pressure on gold. The price at $4,144.94 is at a critical juncture, and the confluence of these macro factors suggests that the path of least resistance remains to the downside in the short to medium term.
The recent news flow, mentioning gold falling for the third consecutive week and starting the week near $4,150, its lowest level since June 11th, is a stark reminder of the prevailing bearish sentiment. While some analysts might still see upside potential, the technical data strongly suggests otherwise for the immediate future. The focus remains on the $4,140.98 support level. A breach here would likely confirm the bearish outlook and open the door for further declines. The question for traders is not whether gold *can* fall further, but *how quickly* and *to what levels*. The strong ADX on the daily chart (38.04) indicates that this is a well-established trend, not just a fleeting correction. Therefore, any attempt to buy gold at these levels without clear confirmation of a trend reversal would be highly speculative and risky. The market is clearly favoring sellers at this juncture, and until a significant catalyst emerges to shift this sentiment, the bearish narrative for gold is likely to persist. The price of $4,144.94 is a battleground, and the bears appear to have the upper hand.
Ultimately, the current technical picture for XAUUSD at $4,144.94 is one of bearish dominance. The confluence of indicators across multiple timeframes - particularly the strong daily downtrend, negative MACD momentum, and the rising DXY - all point towards further downside potential. While the $4,140.98 support level is critical, the ADX reading of 38.04 on the daily chart suggests that a sustained move below this level is likely if it breaks. Traders should remain cautious, prioritizing risk management and looking for confirmation before entering any positions. The market is offering clear signals, and heeding them is key to navigating this potentially volatile period. The price action around $4,144.94 will be the immediate focus, and a break below this level could signal the start of a more significant decline.
Frequently Asked Questions: XAUUSD Analysis
What happens if XAUUSD breaks below the $4,140.98 support level?
A decisive break below $4,140.98 on the 1-hour chart would invalidate the neutral short-term outlook and likely accelerate selling pressure. This could trigger a move towards the next significant daily support level at $4,098.77, as indicated by the strong bearish trend on longer timeframes.
Is the RSI at 34.02 a sell signal for XAUUSD at current levels?
While RSI at 34.02 isn't technically oversold (typically below 30), it signals waning bullish momentum and a downward inclination on the 1-hour chart. Combined with other bearish indicators like MACD and Stochastic, it supports the case for caution and potential shorting opportunities if other conditions are met.
How is the strong DXY at 101.05 impacting XAUUSD's price action around $4,144.94?
The strengthening Dollar Index (DXY) at 101.05 is exerting downward pressure on XAUUSD due to their typical inverse correlation. This persistent dollar strength makes gold more expensive for holders of other currencies, contributing to the bearish sentiment and testing the $4,144.94 price point.
Should traders consider buying gold at $4,144.94 given the strong daily bearish trend?
Buying gold at $4,144.94 is highly speculative given the strong daily bearish trend (ADX 38.04). While it's near a support level, confirmation of a bullish reversal pattern on the daily chart is needed for long-term investors. Short-term traders might look for a confirmed break of resistance levels, but a high-risk approach is required.
Key Levels and Trade Scenarios
The current price action around $4,144.94 is pivotal. The proximity to the $4,140.98 support on the 1H chart and $4,144.96 on the daily chart means that the next move is likely to be significant. Traders must have a clear plan for both potential downside continuation and a possible, albeit less probable, reversal.
Bearish Scenario: Downside Acceleration
70% ProbabilityNeutral Scenario: Consolidation Around Support
20% ProbabilityBullish Scenario: Reversal Attempt
10% ProbabilityTrack markets in real-time
AI-powered analysis, technical indicators and real-time price data.
Join Our Telegram Channel
Breaking market news, AI analysis and trading signals instantly.
Join Channel