The tug-of-war for silver (XAGUSD) is intensifying as the precious metal hovers near the critical $66.57 resistance level, while its yellow counterpart, gold, experiences a notable dip. This divergence warrants a closer look, especially with the US Dollar Index (DXY) showing signs of strength and longer-term technical indicators flashing cautionary signals for silver bulls. The market sentiment is at a crossroads, with competing forces dictating the short-term direction for XAGUSD. Understanding the interplay between gold, the dollar, and the broader economic landscape is paramount for navigating this complex environment.
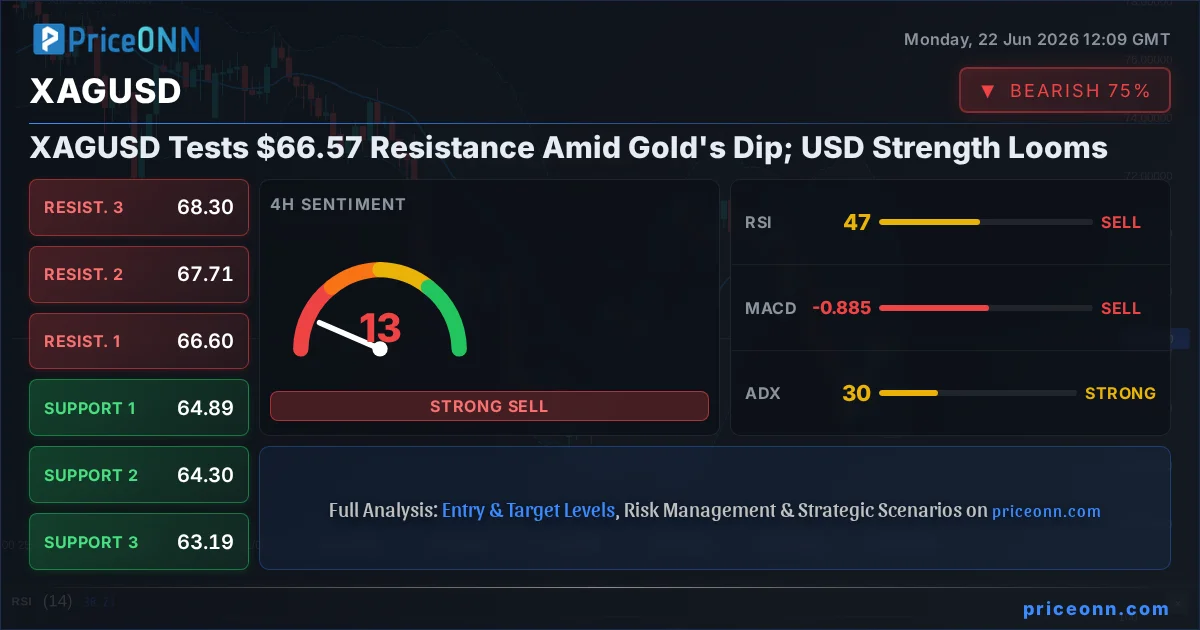
- Silver (XAGUSD) is currently trading near the $66.57 resistance level, facing headwinds from a strengthening dollar and bearish signals on longer timeframes.
- Gold (XAUUSD) has dipped to $4,210.29, indicating a potential flight to safety or profit-taking that could spill over into silver.
- The DXY is showing upward momentum, currently at 100.94, which typically exerts downward pressure on commodities priced in USD.
- While 1-hour technicals show bullish leanings for XAGUSD (RSI 59.23, ADX 29.62), the 4-hour (RSI 46.33, ADX 30.23) and daily (RSI 39.82, ADX 37.39) charts present a more bearish outlook, suggesting a potential reversal.
- Upcoming economic data, particularly inflation and employment figures, will be crucial in shaping central bank policy expectations and, consequently, commodity prices.
The current trading week has presented a mixed bag for precious metals. Gold, often seen as the primary safe-haven asset, has retreated to $4,210.29, marking its third consecutive weekly decline. This move, while potentially a precursor to a deeper correction, also presents an opportunity for contrarian traders. The fact that gold is faltering near the $4,150 mark, as reported by forex news outlets, suggests that prevailing risk appetite might be shifting, or perhaps traders are anticipating a shift in central bank rhetoric. This weakness in gold can often cast a shadow over silver, even if silver's own fundamentals suggest a different path. The close correlation between the two metals means that a significant move in one often influences the other, creating a complex dynamic for traders trying to decipher the next move.
Adding another layer of complexity is the behavior of the US Dollar Index (DXY). Currently trading at 100.94, the DXY has seen a notable uptick, a trend that historically puts pressure on dollar-denominated commodities like silver and gold. A stronger dollar makes these assets more expensive for holders of other currencies, potentially dampening demand. The DXY's ascent is often driven by expectations of tighter monetary policy from the Federal Reserve, or by a global 'risk-off' sentiment that drives capital towards perceived safe-haven assets, with the dollar being a primary beneficiary. This upward pressure on the dollar index cannot be ignored when assessing the outlook for XAGUSD, as it directly impacts the purchasing power of alternative currencies when denominated in USD.
From a short-term technical perspective, XAGUSD presents a somewhat bullish picture on the 1-hour chart. The RSI is hovering at 59.23, indicating a neutral-to-positive momentum, and the ADX at 29.62 suggests a developing trend. The MACD is positive, and Stochastic oscillators show a bullish signal with %K above %D. This shorter timeframe alignment could tempt some traders into believing a move higher is imminent, especially with resistance levels like $66.50 and $66.66 in sight. However, this optimism is quickly tempered when zooming out to longer timeframes, revealing a more conflicted and potentially bearish outlook that demands careful consideration before committing capital.
The Bull Case: Short-Term Momentum and Industrial Demand
Despite the headwinds, a case can be made for silver's resilience, primarily driven by its industrial applications and potential for short-term momentum plays. The 1-hour chart's general 'BUY' signal, fueled by an RSI of 59.23 and a moderately strong ADX of 29.62, suggests that intraday traders might find opportunities on the long side. The Stochastic oscillator, with K at 81.1 and D at 71.52, is firmly in bullish territory, indicating upward momentum. This suggests that within the current trading session, buyers might be able to push XAGUSD towards the immediate resistance levels of $66.50 and $66.66. Furthermore, the ongoing narrative around a potential pivot in central bank policies, even if not fully realized, can create a speculative environment where assets like silver, with industrial demand drivers, could see speculative inflows. The fact that the overall signal on the 1H is a strong 'AL' (Buy) reinforces this short-term bullish sentiment for those focusing on intraday moves.
Beyond the immediate technicals, the fundamental demand for silver in industrial applications remains a structural positive. As economies globally strive for technological advancement, particularly in areas like electronics, solar energy, and electric vehicles, the demand for silver is expected to remain robust. While this is a longer-term driver, it can provide a floor under prices and contribute to the 'buy-the-dip' mentality when prices momentarily falter. For instance, the recent news regarding India rethinking its energy strategy due to geopolitical tensions in the Strait of Hormuz, while focused on oil, highlights the broader theme of supply chain resilience and the importance of critical raw materials, which silver certainly is. If industrial demand picks up pace, it could provide a strong counter-balance to any dollar strength or macro-economic headwinds, offering a compelling reason for a bullish outlook, particularly if prices can consolidate above key support levels.
The Bear Case: Dollar Strength, Macro Headwinds, and Longer-Term Technicals
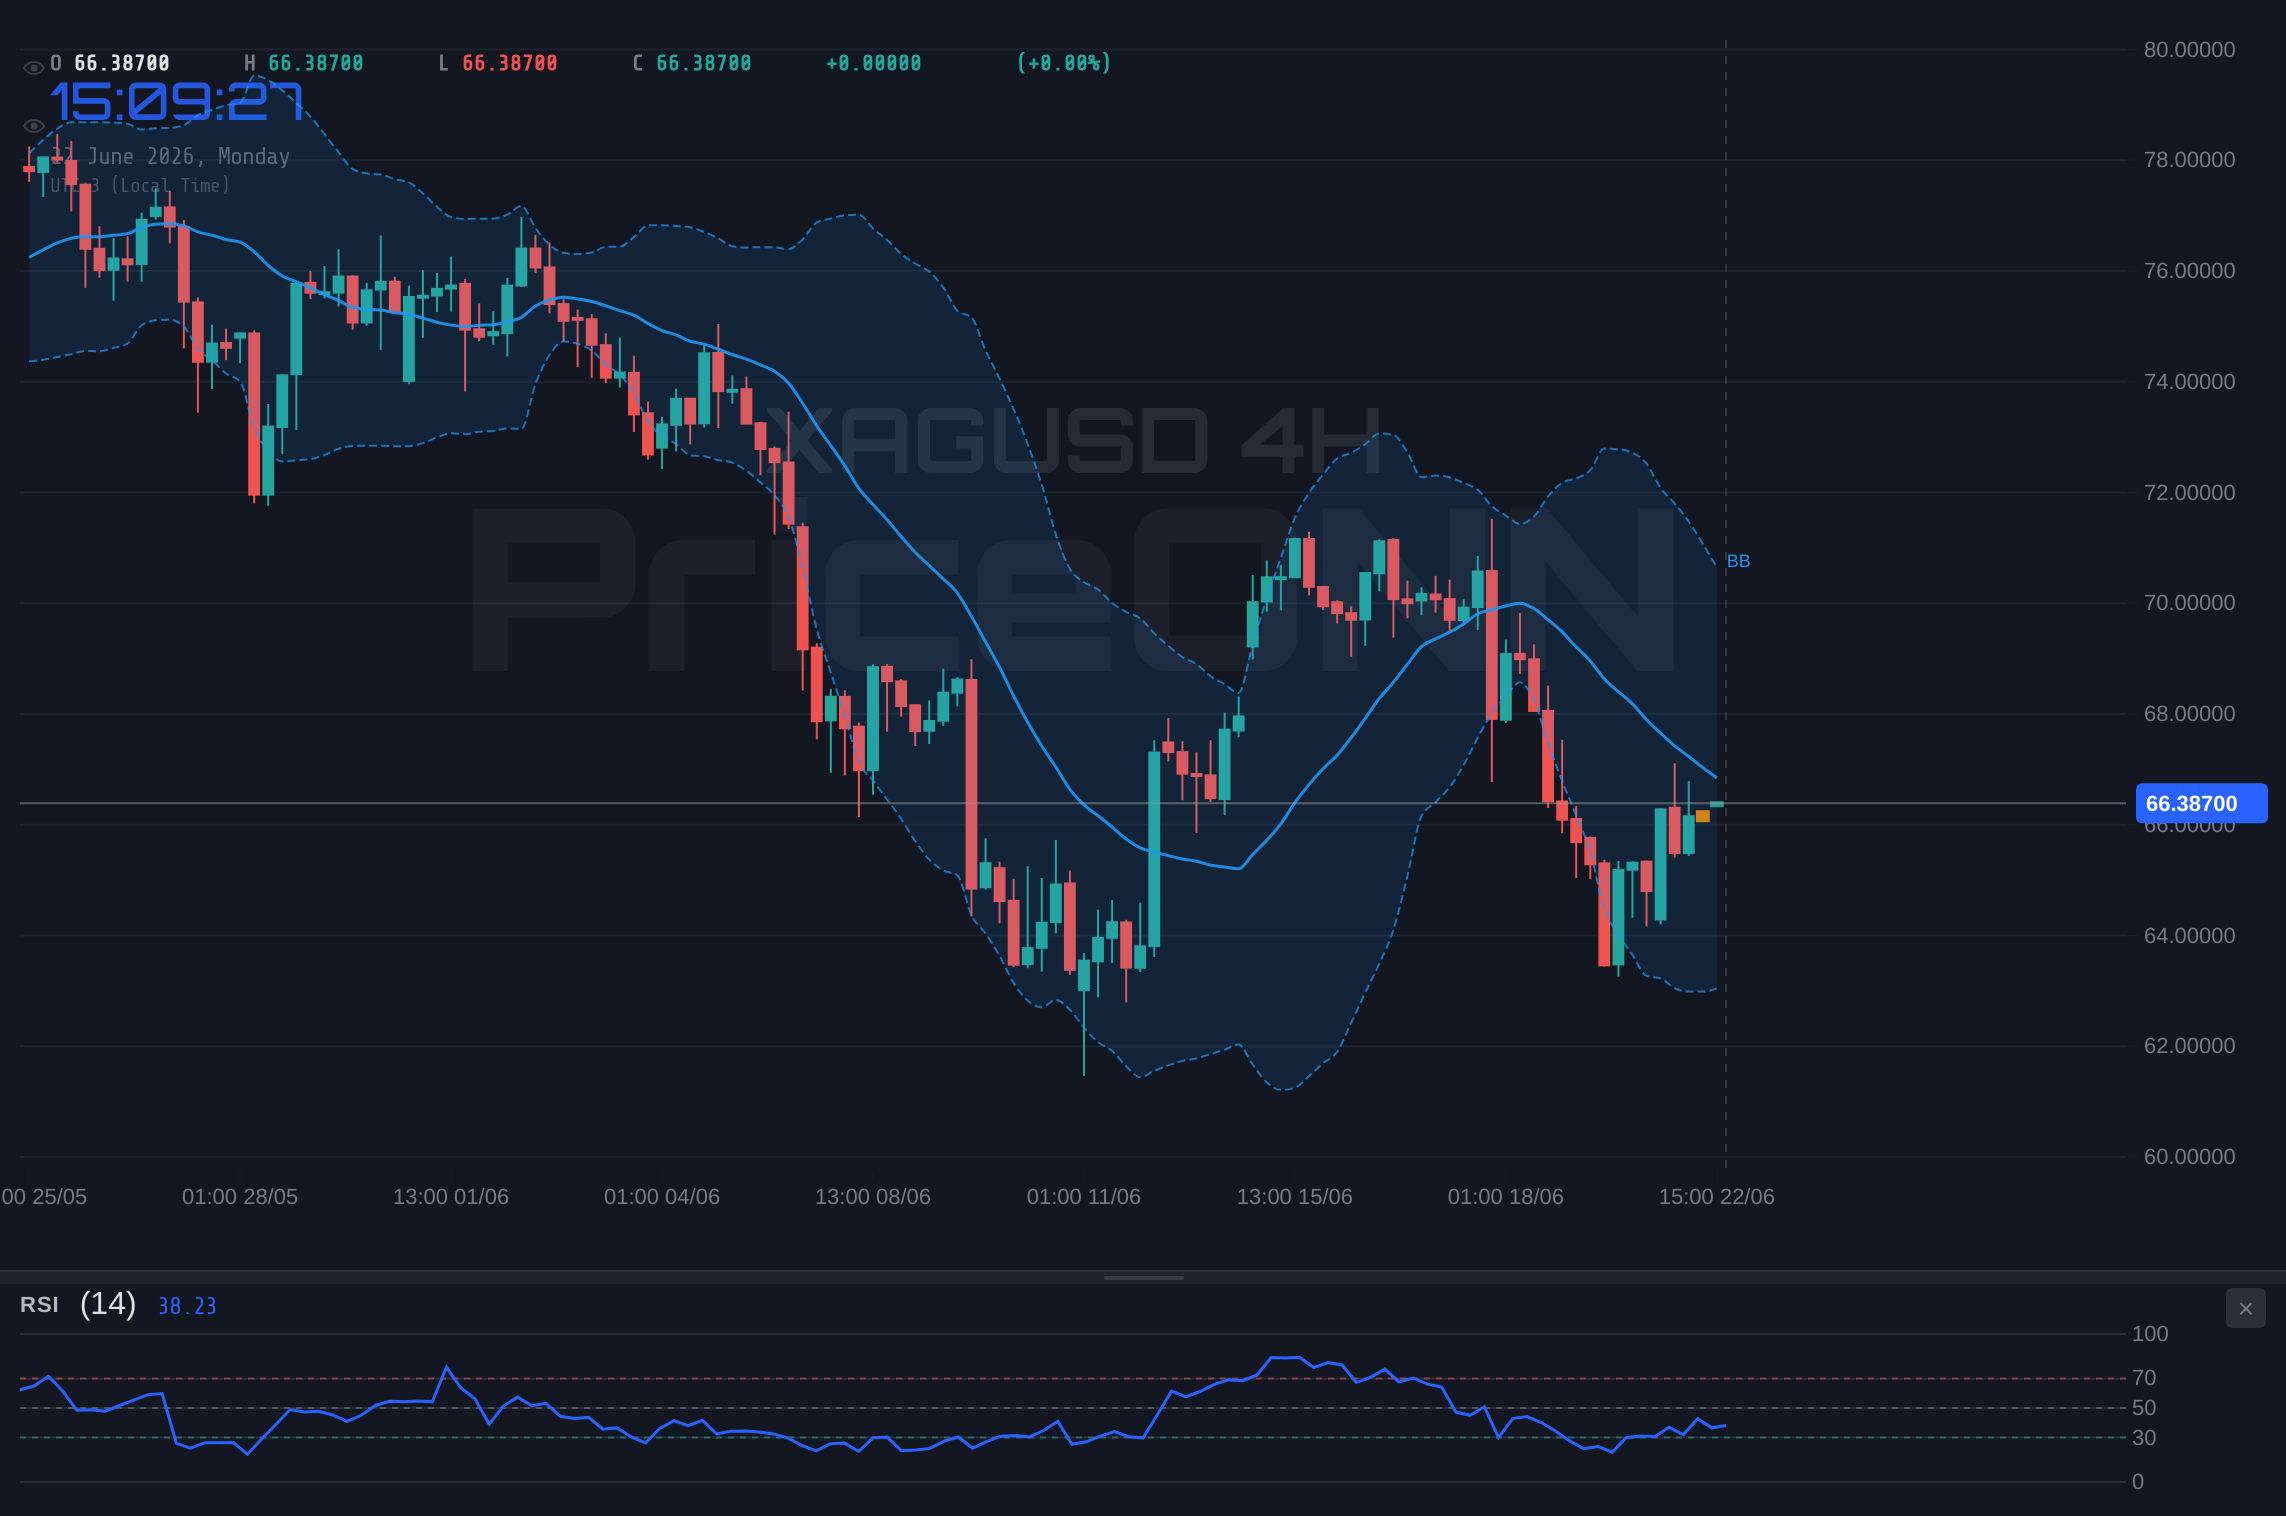
The narrative shifts dramatically when examining the 4-hour and daily charts. On the 4-hour timeframe, XAGUSD shows a 'SELL' signal, with RSI at 46.33 and ADX at 30.23 indicating a strong downward trend. The MACD is negative, and Bollinger Bands suggest a bearish inclination. Similarly, the daily chart presents an even more pronounced bearish picture: RSI at 39.82, ADX at 37.39, and a strong 'SELL' overall signal. This signifies a sustained downtrend, where any short-term rallies are likely to be met with significant selling pressure. The fact that the daily trend is marked as 'Düşüş' (Downtrend) with 94% strength cannot be understated. This suggests that the recent upward movement might be a mere correction within a larger bearish phase, and the underlying weakness is still dominant.
The correlation with the DXY, currently at 100.94 and trending upwards, is a significant bearish factor. As the dollar strengthens, it becomes more expensive for international buyers, thereby reducing demand for silver. This is particularly true if the dollar's strength is driven by expectations of higher interest rates, which also increases the opportunity cost of holding non-yielding assets like silver. Furthermore, the weakness observed in gold, currently near $4,210.29, often precedes or accompanies a similar move in silver due to their high correlation. If gold continues to sell off, it's highly probable that silver will follow suit, potentially breaking below its immediate support levels. The news about a potential US-Iran framework deal, though impacting oil, points to shifting geopolitical dynamics that could reduce safe-haven demand for precious metals in general, further supporting a bearish thesis for XAGUSD.
The ADX indicator provides crucial insight into trend strength across different timeframes. On the 1-hour chart, ADX is 29.62, suggesting a strong trend, which aligns with the bullish short-term signal. However, the 4-hour ADX is 30.23 and the daily ADX is a robust 37.39. This indicates that while the immediate momentum might be upwards, the longer-term trend is firmly established to the downside. A strong ADX reading on longer timeframes signifies that the prevailing trend has significant conviction behind it, meaning any counter-trend moves are likely to be short-lived and eventually overcome by the dominant trend. This conflict between short-term bullish signals and long-term bearish trend strength is a classic scenario where caution is advised, as the larger trend often prevails.
Navigating the $66.57 Crossroads: A Technical Showdown
The $66.57 price point for XAGUSD is more than just a number; it represents a critical juncture where short-term bullish momentum clashes with long-term bearish technicals. The 1-hour chart, with its RSI near 59 and a general 'BUY' signal, suggests immediate buying interest. However, the 4-hour RSI at 46.33 and the daily RSI at 39.82 paint a different picture, indicating that the broader market sentiment is leaning towards a decline. This divergence is a key element in price action analysis. Traders often look for confirmation from longer timeframes before committing to trades that go against the prevailing higher-timeframe trend. The ADX readings further highlight this dichotomy: strong on the daily (37.39) and 4-hour (30.23) charts, but less so on the hourly (29.62).
The Stochastic oscillator on the 1-hour chart shows %K at 81.1 and %D at 71.52, signaling an overbought condition that could lead to a pullback. On the daily chart, however, Stochastic shows %K at 46.81 and %D at 50.34, indicating a bearish signal as %K crosses below %D. This conflicting information from the Stochastic indicator across different timeframes underscores the indecision in the market. For XAGUSD to sustain any upward move, it would likely need to break decisively above the immediate resistance at $66.50 and then challenge the higher resistance at $66.66. Conversely, a failure to hold above the current price, or a break below the 1-hour support at $66.24, could trigger a move towards the 4-hour support at $64.89, aligning with the bearish sentiment on longer timeframes.
The current market context, with gold trading near $4,210.29 and facing headwinds, and the DXY at 100.94 and showing upward momentum, adds a layer of fundamental pressure to the technical picture. Any significant news regarding central bank policy shifts, inflation data releases, or geopolitical developments could act as the catalyst to break this stalemate. For instance, hotter-than-expected inflation figures could prompt the Fed to signal a more hawkish stance, strengthening the dollar and pressuring silver further down. Conversely, signs of economic slowdown or a sudden escalation of geopolitical tensions could drive safe-haven demand, potentially benefiting silver despite the dollar's strength.
The Verdict: Caution Advised as Bears Grip Longer Timeframes
While the 1-hour technicals offer a glimmer of hope for silver bulls, the overwhelming evidence from the 4-hour and daily charts points towards a bearish bias. The confluence of a strengthening dollar (DXY at 100.94), declining gold prices ($4,210.29), and robust bearish trend strength indicated by the ADX on longer timeframes (above 30) suggests that the upside potential for XAGUSD is currently limited. The RSI levels on the 4-hour (46.33) and daily (39.82) charts clearly indicate a downward trend, and the Stochastic's bearish cross on the daily timeframe reinforces this view. Therefore, while short-term traders might find opportunities for quick gains, the larger trend appears to be against the bulls.
The critical resistance level at $66.57 is likely to be a significant hurdle. A failure to decisively break and hold above this level, especially with the prevailing macro-economic pressures, could lead to a sharp reversal. The immediate support to watch on the 1-hour chart is $66.24. A break below this could signal the beginning of a move towards the 4-hour support at $64.89. The market sentiment analysis suggests that while industrial demand for silver is a long-term positive, the immediate macro-economic and currency headwinds are too significant to ignore. Traders should exercise a high degree of caution, looking for clear confirmation of a trend reversal before considering long positions, and prioritizing risk management if they choose to engage with the current price action.
Bearish Scenario: Trend Continuation
70% ProbabilityNeutral Scenario: Consolidation Around $66.57
20% ProbabilityBullish Scenario: Short-Term Rally Continuation
10% ProbabilityFrequently Asked Questions: XAGUSD Analysis
What happens if XAGUSD breaks below the $66.24 support level?
A break below $66.24 on the 1-hour chart would likely trigger a move towards the 4-hour support at $64.89. This scenario aligns with the bearish trend indicated by longer timeframes and a strengthening DXY.
Is the RSI at 59.23 on the 1-hour chart a buy signal for XAGUSD at current $66.57 levels?
While the 1-hour RSI at 59.23 suggests upward momentum, it's not a standalone buy signal, especially given the bearish outlook on daily charts. Confirmation from breaking resistance at $66.66 and sustained buying pressure would be needed.
How will the DXY's rise to 100.94 impact XAGUSD's trend analysis?
A DXY at 100.94 typically exerts downward pressure on XAGUSD by making it more expensive for non-dollar holders. This strengthens the bearish case, especially when combined with gold's dip to $4,210.29.
How might upcoming economic data affect XAGUSD's price around the $66.57 level?
Stronger-than-expected inflation or employment data could boost the dollar and pressure XAGUSD lower, potentially breaking support at $66.24. Conversely, weaker data might ease dollar strength and offer some respite to silver.
Technical Outlook Summary
| Indicator | Value | Signal | Interpretation |
|---|---|---|---|
| RSI (14) | 59.23 | Neutral | Uptrend bias on 1H, Downtrend bias on 4H/1D |
| MACD | Positive Momentum | Bullish (1H) | Mixed signals across timeframes |
| Stochastic | K: 81.1, D: 71.52 (1H) | Bullish (1H) | Bearish cross on Daily (K:46.81, D:50.34) |
| ADX | 29.62 (1H) | Strong Trend | Daily ADX at 37.39 indicates strong downtrend |
| Bollinger | Mid Band | Watch | Above mid on 1H, below on 4H/1D |
Key Levels
Track markets in real-time
AI-powered analysis, technical indicators and real-time price data.
Join Our Telegram Channel
Breaking market news, AI analysis and trading signals instantly.
Join Channel