The US Dollar Index (DXY) is currently positioned at $100.82, a level that has become a focal point for traders and analysts alike following a week marked by shifting market dynamics. Last Friday's close saw the index hovering around this crucial psychological and technical threshold, with a palpable sense of anticipation in the air. After a period of robust bullish momentum, the dollar's ascent appears to be pausing, prompting a closer examination of the underlying economic drivers and technical signals that will shape its trajectory in the coming week. This analysis delves into the multi-timeframe technical picture, explores the fundamental underpinnings, and assesses the potential scenarios that could unfold for the DXY.
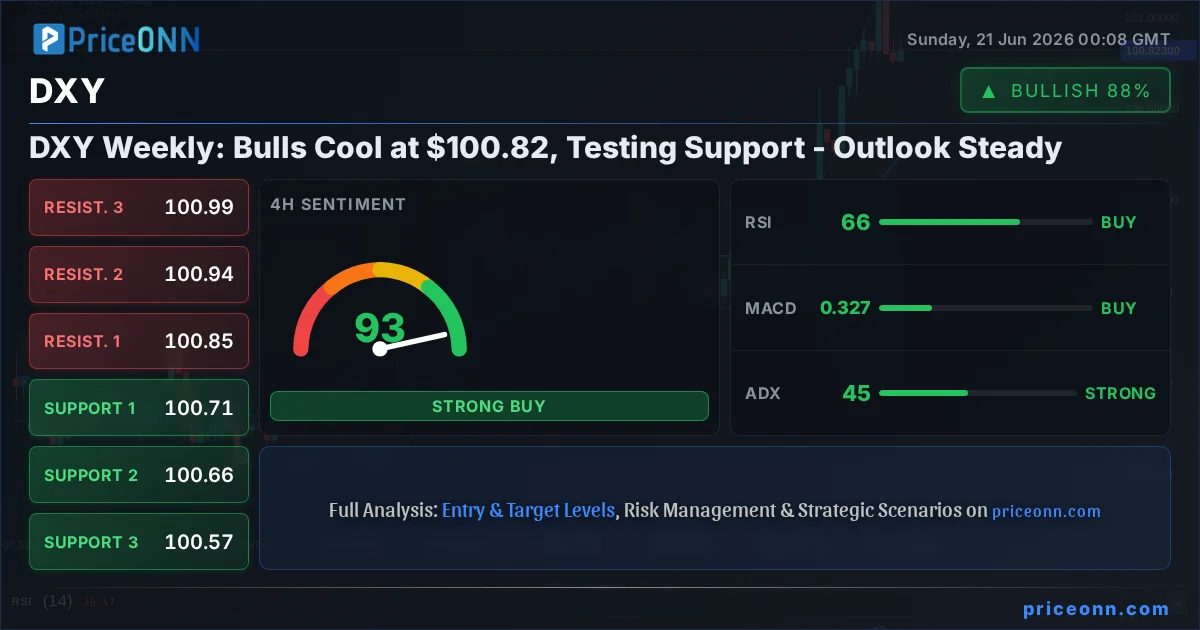
- The DXY is currently trading at $100.82, a critical level where bulls are testing support after a recent rally.
- On the 1D chart, RSI stands at 70.32, indicating overbought conditions that could lead to a short-term pullback.
- Key support for the DXY is identified at $100.71, followed by $100.66, while resistance looms at $100.85 and $100.94.
- Market sentiment is closely watching upcoming economic data, particularly inflation and interest rate expectations, which will heavily influence DXY's direction.
This pivotal moment for the DXY comes amidst a complex global economic backdrop. While the Federal Reserve has maintained a hawkish stance, signaling a potential for prolonged higher interest rates, recent market sentiment has begun to reprice these expectations. This delicate balance between Fed policy and evolving economic data is creating a tug-of-war that is clearly reflected in the dollar's current price action. Understanding the interplay between these forces is paramount for navigating the currency markets effectively. The DXY's role as a barometer for global risk appetite and a key influencer of commodities and major currency pairs makes its movements particularly significant for a wide range of market participants.
Navigating the Dollar's Crossroads: A Technical Deep-Dive
The 4-Hour Chart: A Battle for Control at Key Levels
Examining the DXY on the 4-hour chart reveals a market in a state of flux. The trend is currently classified as bullish with a strength of 100%, yet the price is approaching significant resistance levels. The current price of $100.82 sits just below the R1 resistance at $100.85 and R2 at $100.94. This confluence of resistance suggests that any further upward movement will require considerable conviction from buyers. The ADX at 45 indicates a strong trend, but with RSI at 65.62 in the upper neutral territory, there's a clear warning sign for excessive bullishness. The Stochastic indicator, with K at 60.45 and D at 83.29, shows a bearish divergence, suggesting that momentum may be waning and a pullback could be imminent. This technical setup on the 4-hour timeframe paints a picture of a market at a critical juncture, where the bulls must break through these resistance levels to maintain their advantage, or risk a reversal.
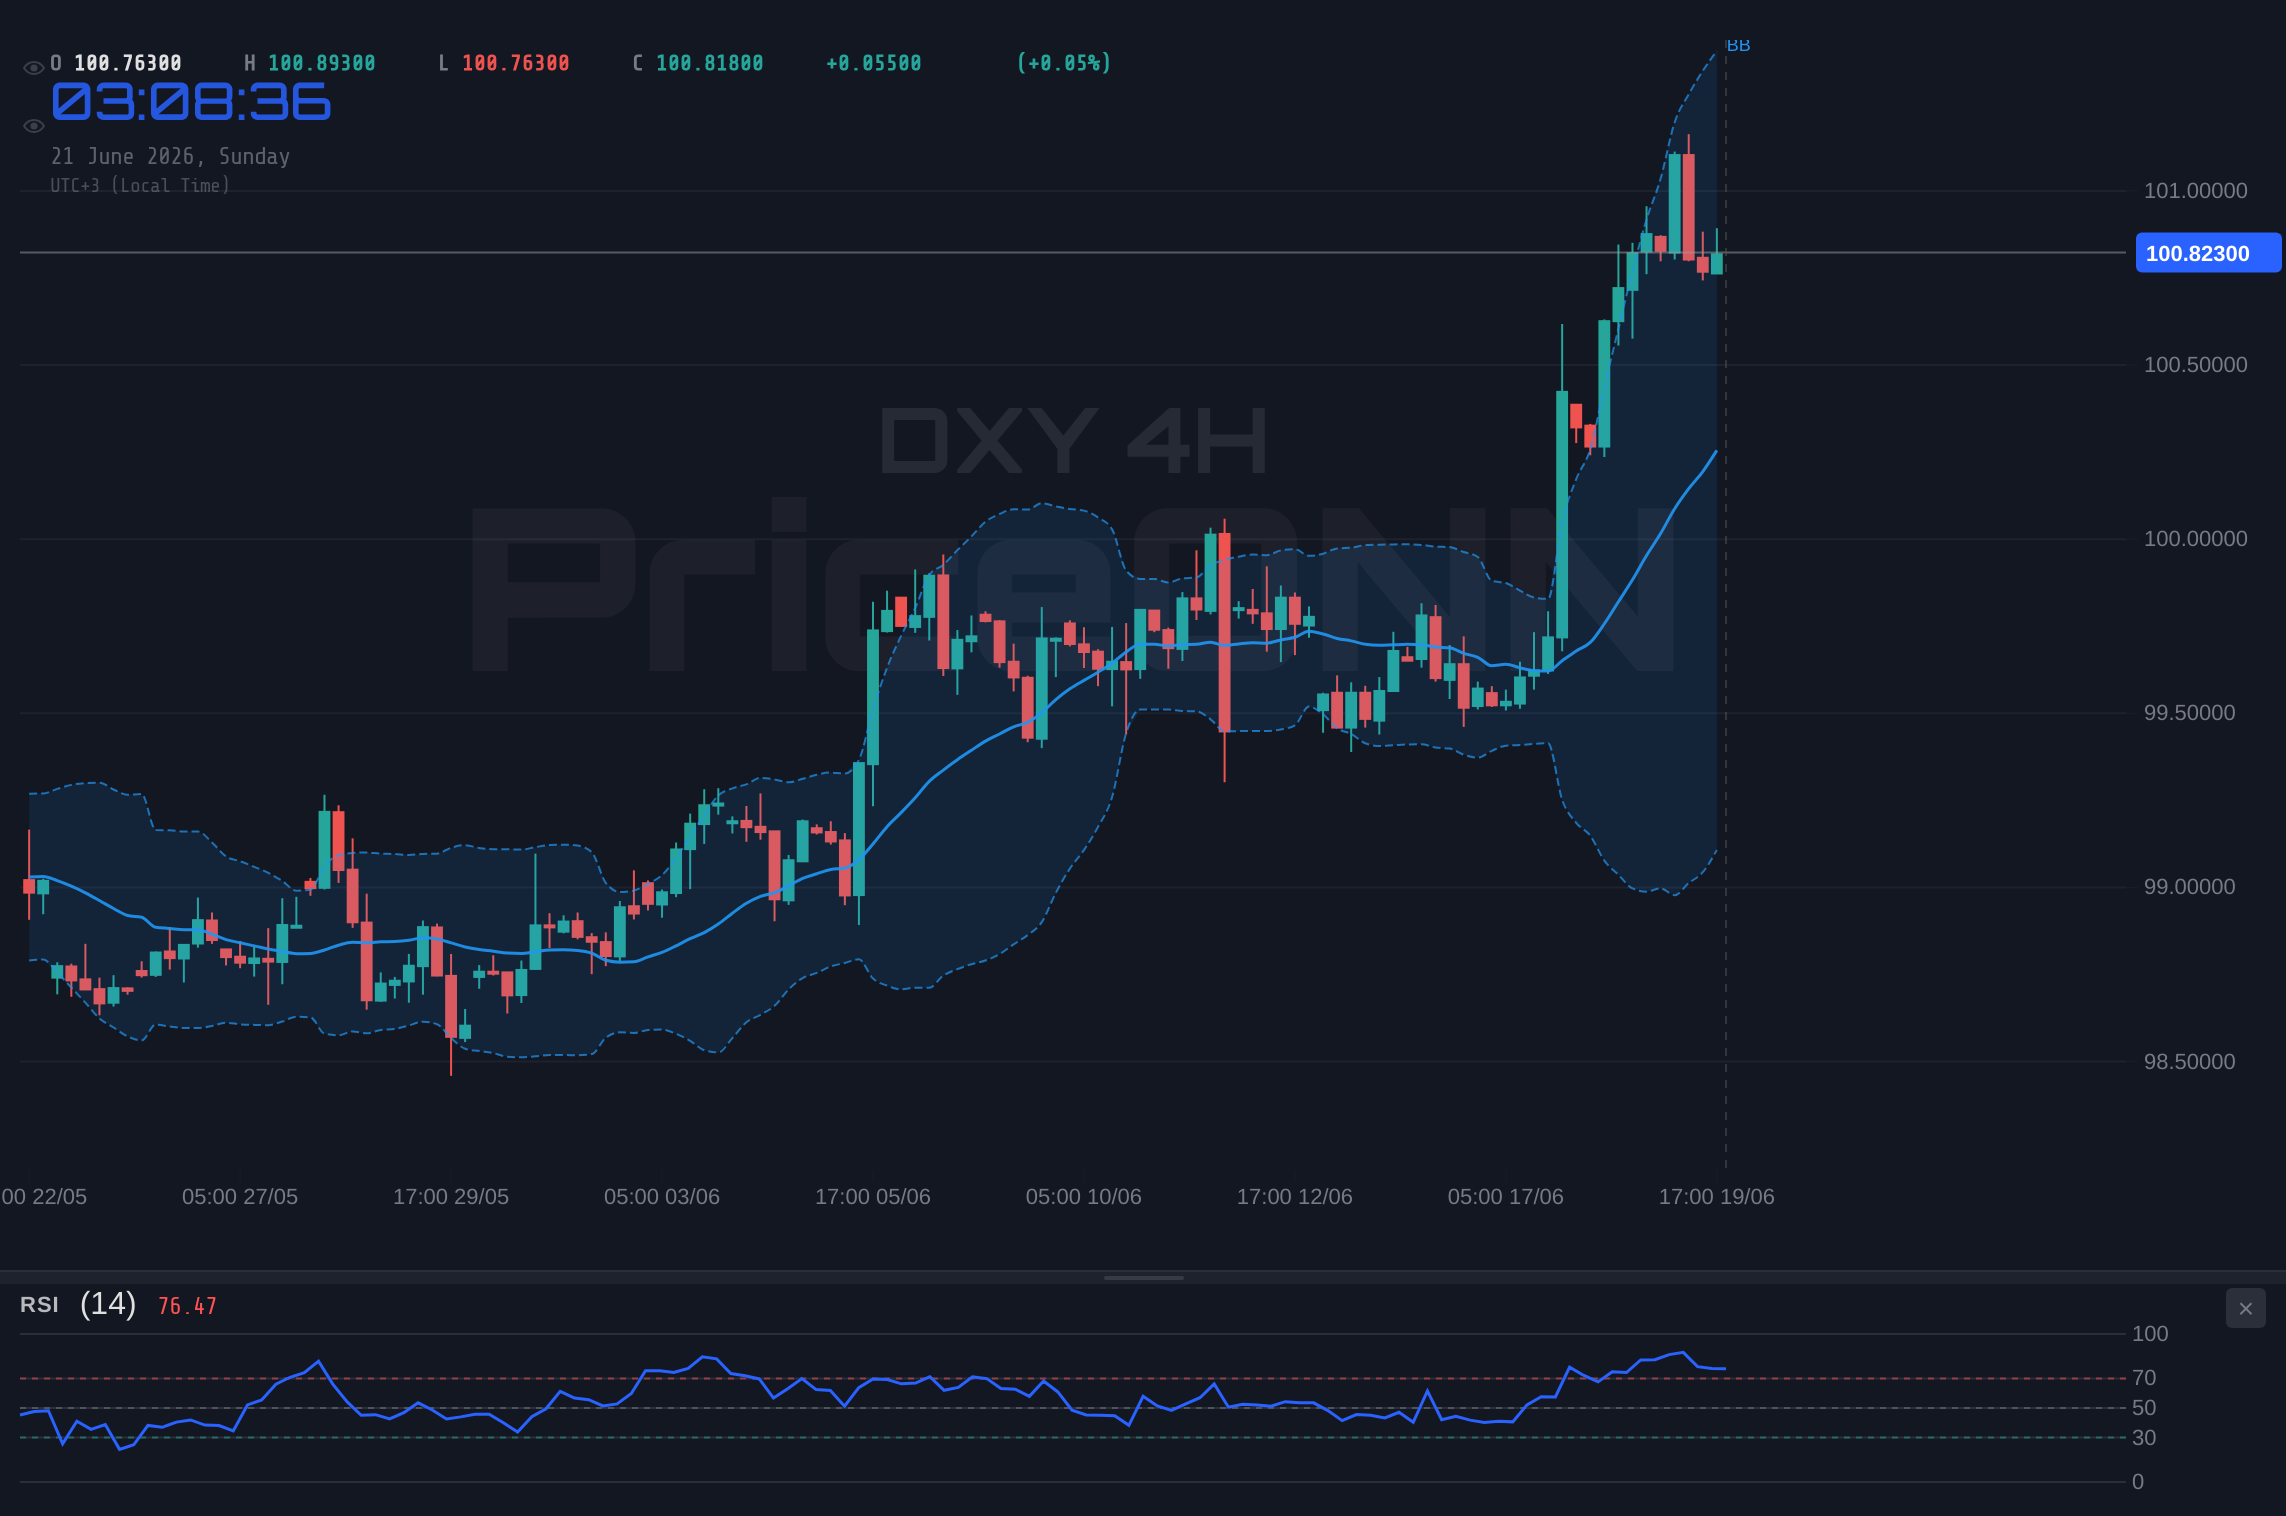
The MACD indicator on the 4-hour chart is showing positive momentum, with the MACD line above the signal line. This typically suggests upward pressure. However, when viewed in conjunction with the RSI and Stochastic, it highlights a potential conflict in signals. The Bollinger Bands are positioned above the middle band, indicating an upward bias in price action. Yet, the ADX reading of 45 points to a strong trend, which could mean that if a breakout above resistance occurs, it might be swift and decisive. The overall signal on this timeframe is 'BUY' (7 buys, 1 sell, 0 neutral), but the conflicting signals from RSI and Stochastic warrant caution. This suggests that while the trend might still be upward, the immediate path higher is fraught with potential technical hurdles. The interplay between these indicators provides a nuanced view, emphasizing the need for traders to watch for confirmations before committing to a directional trade.
The Daily Chart: Overbought Conditions and Potential Reversal Signals
Shifting to the daily timeframe, the DXY presents a more pronounced picture of potential overextension. The trend is decisively bullish, with a strength of 91%, and the price is trading above the middle Bollinger Band, indicating a bullish bias. However, the RSI(14) at 70.32 is firmly in the overbought territory. Historically, such readings often precede a period of consolidation or a price correction as buyers take profits and sellers look to enter. The MACD is still showing positive momentum, with the MACD line above the signal line, reinforcing the prevailing uptrend. Yet, the Stochastic indicator is flashing a strong bullish signal, with K at 88.44 and D at 75.19, indicating that the market is deeply overbought and a reversal could be on the horizon. This divergence between the sustained bullish momentum indicated by MACD and the overbought signals from RSI and Stochastic is a classic warning sign.
The ADX at 32.38 confirms that the uptrend remains strong, but the combination of extreme RSI and Stochastic readings suggests that the trend's current strength might not be sustainable without a period of consolidation or a pullback. The support levels on the daily chart are located at $100.42, $99.97, and $99.70, while resistance is found at $101.14, $101.41, and $101.86. A failure to break decisively above the $100.85-$100.94 resistance zone could lead to a test of the $100.71 support. The overall 'BUY' signal on the daily chart (7 buys, 1 sell, 0 neutral) reflects the prevailing trend, but the overbought indicators cannot be ignored. This presents a classic dilemma: do you trade with the strong trend, or do you bet on a correction based on overbought conditions? The answer often lies in waiting for confirmation and managing risk accordingly.
Intraday Dynamics: Watching the $100.71 Support Level
On the 1-hour chart, the DXY shows a neutral trend with 50% strength, highlighting the intraday volatility and the immediate battleground for price action. The current price of $100.82 is nestled between immediate support at $100.79 and resistance at $100.89. The RSI(14) at 53.58 is in neutral territory, showing a slight upward bias, while the MACD is generating negative momentum, with the MACD line below the signal line. This indicates a potential for intraday weakness. The Stochastic oscillator, with K at 34.09 and D at 19.85, is showing a bullish signal, suggesting that intraday buyers might be stepping in. However, the ADX at 38.71, indicating a strong trend, seems at odds with the neutral RSI and MACD signals. This mixed picture on the intraday timeframe underscores the importance of closely watching the immediate support and resistance levels.
The 'BUY' signal on the 1-hour chart (5 buys, 3 sells, 0 neutral) suggests a slight edge for buyers in the short term, but the underlying trend strength indicated by ADX and the conflicting MACD signal cannot be overlooked. The key takeaway from the intraday analysis is that while the broader trend might still be upward, any immediate move higher will likely face significant headwinds around $100.85-$100.94. Conversely, a break below the $100.79 intraday support could open the door for a deeper correction, potentially targeting the more significant daily support levels. Traders will be looking for clear price action confirmation – either a decisive break above resistance or a sustained move below support – to guide their short-term positioning. The current price action suggests a period of consolidation or a potential short-term reversal might be in play before the next significant move.
Fundamental Underpinnings: The Fed, Inflation, and Shifting Expectations
The Fed's Tightrope Walk: Policy Expectations vs. Economic Reality
The Federal Reserve's monetary policy remains the central pillar supporting the US dollar's strength. Officials have consistently signaled a commitment to combating inflation, even if it means maintaining higher interest rates for longer. This hawkish rhetoric has been a primary driver of dollar strength throughout much of the recent period. However, the market's interpretation of this stance is constantly evolving, influenced by incoming economic data. Recent analyses, including those highlighted in the provided news snippets, suggest a growing market focus on the prospect of renewed Federal Reserve tightening or, conversely, a reassessment of the timing and magnitude of potential rate cuts. This dynamic repricing of Fed expectations is crucial for understanding the DXY's current consolidation phase.
The CME FedWatch Tool, if available, would typically show the market's probability pricing for future Fed rate decisions. Without specific data, we infer from market commentary that traders are weighing the Fed's stated intentions against signs of cooling inflation or potential economic slowdowns. For instance, if inflation data were to show a persistent stickiness, it would reinforce the Fed's hawkish stance and likely support the dollar. Conversely, any significant weakening in employment or growth figures could lead markets to anticipate earlier or deeper rate cuts, putting downward pressure on the dollar. This ongoing tug-of-war between policy pronouncements and economic realities creates the volatility and uncertainty that define the current market environment for the DXY.
Inflation and Economic Data: The Yardstick for Dollar Strength
The trajectory of inflation remains the paramount concern for central banks and, consequently, for the DXY. Any data release that deviates significantly from expectations can trigger substantial market movements. For example, a higher-than-expected Consumer Price Index (CPI) or Personal Consumption Expenditures (PCE) report would reinforce the Fed's need to maintain restrictive monetary policy, lending support to the dollar. Conversely, a softer inflation print could fuel speculation about the Fed's next move, potentially leading to a dollar pullback. Similar attention is paid to employment data. Strong Non-Farm Payrolls (NFP) or a declining unemployment rate typically bolster the dollar by signaling a robust economy that can withstand higher interest rates. However, a weaker-than-expected jobs report could have the opposite effect, raising concerns about economic growth and prompting a reassessment of Fed policy.
Economic growth indicators, such as Purchasing Managers' Index (PMI) surveys and Gross Domestic Product (GDP) reports, also play a critical role. Robust growth figures often correlate with a stronger dollar, as they suggest a healthy economy that is attractive to foreign investment. The yield curve, particularly the spread between short-term and long-term Treasury yields, offers another lens through which to view economic expectations. An inverted yield curve, where short-term yields are higher than long-term yields, has historically been a predictor of economic slowdowns, which could weigh on the dollar. The interplay of these various economic data points creates a complex mosaic that traders use to gauge the fundamental health of the US economy and, by extension, the likely direction of the DXY.
Geopolitical Ripples and Safe-Haven Flows
While monetary policy and economic data are primary drivers, geopolitical events continue to cast a shadow over global markets and influence the DXY. Tensions in the Middle East, for instance, can impact oil prices, which in turn affect inflation expectations and risk sentiment. As noted in the provided news, India's strategic oil reserve expansion highlights the ongoing global focus on energy security. Such events can increase demand for safe-haven assets, and the US dollar often benefits from this flight to safety, especially when the perceived risks are external to the US economy. Similarly, ongoing geopolitical developments in Europe or Asia can influence global risk appetite, leading to capital flows that favor or disfavor the dollar.
The correlation between the DXY and other assets is also a critical consideration. When the dollar strengthens significantly, it often puts downward pressure on commodities like gold (XAUUSD) and silver (XAGUSD), as they become more expensive for holders of other currencies. This inverse relationship is clearly visible in the current market data, where the DXY's recent strength has coincided with declines in precious metals. Conversely, a weakening dollar can provide a tailwind for commodities. Equity markets, such as the S&P 500 and Nasdaq, also exhibit a complex relationship with the DXY. Typically, a stronger dollar can weigh on US corporate earnings for multinational companies, potentially leading to declines in stock indices. However, this correlation is not always stable and can be influenced by other factors, such as Fed policy and overall market sentiment. Understanding these correlations is key to a holistic market view.
Market Structure and Trader Positioning
Examining Institutional Flow and Sentiment
The positioning of institutional players provides valuable insights into market sentiment and potential future price movements. While specific COT (Commitment of Traders) data isn't provided, general market commentary suggests that the dollar's strength has been a dominant theme. This often implies that large financial institutions have been accumulating long dollar positions, either directly or through currency futures and options. Understanding this positioning is crucial, as significant shifts in institutional sentiment can exacerbate trends or signal potential reversals. For instance, if institutions begin to unwind long dollar positions due to changing macro views or risk-off events, it could accelerate any downward movement in the DXY.
The provided news also hints at market sentiment favoring the US dollar, with EUR/USD reportedly losing ground. This suggests that, despite the technical overbought signals on longer timeframes, the prevailing market narrative is still dollar-positive. This divergence between short-term technical warnings and longer-term fundamental drivers creates a complex trading environment. Traders must constantly assess whether the fundamental narrative supporting dollar strength is robust enough to overcome potential technical pullbacks, or if the technical signals are foreshadowing a fundamental shift.
Key Levels to Watch: The $100.71 Support and $100.85 Resistance
The DXY's price action is currently defined by a battle between key support and resistance levels. On the daily chart, the critical support lies at $100.42, with further levels at $99.97 and $99.70. These are substantial floors that would need to be decisively broken to signal a significant trend reversal. However, the more immediate battleground is around the current price. The 4-hour chart identifies support at $100.71, followed by $100.66, and the 1-hour chart points to intraday support at $100.79. These levels are crucial for short-term price direction. A failure to hold $100.71 could trigger a cascade of selling, potentially pushing the DXY towards the $100.42 mark.
On the resistance side, the immediate hurdle is the $100.85 level, followed by $100.94 on the 4-hour chart, and $100.89 on the 1-hour chart. Breaking above these levels, particularly with strong volume and conviction, would be necessary to invalidate the overbought signals and resume the bullish trend. The $101.14 level on the daily chart serves as a more significant resistance target. The interplay between these support and resistance zones will dictate the DXY's path in the short to medium term. Traders will be closely monitoring price action around these levels for confirmation of a breakout or breakdown.
Scenario Analysis: Charting the DXY's Potential Paths
Bearish Scenario: Consolidation and Correction
55% ProbabilityNeutral Scenario: Range-Bound Trading
30% ProbabilityBullish Scenario: Resuming the Uptrend
15% ProbabilityThe current technical setup, particularly the overbought signals on daily and weekly charts coupled with resistance near $100.85, leans towards a bearish or neutral scenario in the short term. The bulls need to demonstrate significant strength to overcome these hurdles and resume the uptrend. A break below $100.71 would likely confirm the bearish scenario, opening the door for a deeper correction. Conversely, if the dollar index manages to break and hold above $100.94, it would signal a continuation of the bullish trend, but this appears less probable in the immediate outlook given the current indicators.
Looking Ahead: Key Events and What to Watch
Economic Calendar Watchlist: Inflation and Fed Speak
The upcoming week will be crucial for the DXY, with several key economic events on the horizon that could influence its direction. Central bank policy expectations will continue to be shaped by incoming inflation and employment data. Investors will be scrutinizing any new commentary from Federal Reserve officials for clues about the future path of interest rates. Any hints of a more dovish stance, perhaps due to moderating inflation or signs of economic cooling, could pressure the dollar. Conversely, any indication that the Fed remains committed to a higher-for-longer interest rate policy will likely provide support for the DXY. The market's reaction to these events will be key in determining whether the current consolidation phase gives way to a renewed bullish push or a more significant correction.
Upcoming economic data releases, such as inflation reports (CPI, PCE) and employment figures (NFP, unemployment rate), will be pivotal. A stronger-than-expected inflation report could reinforce the Fed's hawkish stance, potentially driving the DXY higher. However, if inflation continues to trend downwards, it might lead markets to anticipate earlier rate cuts, which could weigh on the dollar. Similarly, labor market data will be closely watched. Robust job growth could support the dollar, while a significant slowdown might raise concerns about economic health and dampen bullish sentiment. The interplay between these data points and the Fed's reaction function will be the primary determinant of the DXY's short-to-medium term trend.
Technical Levels to Monitor: The $100.71-$100.85 Battle Zone
From a technical standpoint, the immediate focus will remain on the price action around the $100.71 support and $100.85 resistance levels. A decisive break and hold above $100.85, particularly on the 4-hour chart, would invalidate the short-term bearish signals and suggest a potential move towards the daily resistance at $101.14. This would require strong buying conviction and likely a catalyst from economic data or Fed commentary. On the flip side, a failure to hold the $100.71 support could initiate a more pronounced pullback, with traders looking towards the $100.42 daily support level as the next significant downside target. The ADX reading of 45 on the 4-hour chart suggests that if a breakout occurs, the trend could become quite strong, making the direction of that breakout critically important.
The daily chart's overbought RSI (70.32) and Stochastic (K=88.44) readings suggest that even if the bulls manage to push higher, the potential for a pullback or consolidation remains elevated. This implies that any upside moves might be met with profit-taking, capping further gains without a significant shift in fundamental drivers. Therefore, while maintaining a bullish bias aligned with the longer-term trend is prudent, traders should remain vigilant for signs of reversal or consolidation, especially if key support levels are breached. The market appears to be at a critical juncture, where confirmation of either a sustained breakout or a meaningful reversal is needed to establish a clearer direction for the DXY in the weeks ahead.
| Indicator | Value | Signal | Interpretation |
|---|---|---|---|
| RSI (14) | 70.32 | Neutral | Overbought on Daily, but trend remains strong. Watch for potential pullback. |
| MACD Histogram | +0.09 | Bullish | Positive momentum persists, but divergence is noted on shorter timeframes. |
| Stochastic | K:88.44, D:75.19 | Bearish | Deeply overbought on Daily, signaling potential for reversal or sharp correction. |
| ADX | 32.38 | Bullish | Confirms a strong trend, but conflicting signals from other indicators suggest caution. |
| Bollinger | Upper Band | Watch | Price above middle band on Daily, indicating bullish bias, but overbought conditions persist. |
Frequently Asked Questions: DXY Analysis
What happens if DXY breaks below $100.71 support?
A break below the $100.71 support level on the 4-hour chart would likely invalidate the immediate bullish momentum and signal a potential move towards the next daily support at $100.42. This could trigger further selling as traders reassess their positions.
Should I buy DXY at current levels of $100.82 given the RSI at 70.32?
Buying at $100.82 with the daily RSI at 70.32 is risky due to overbought conditions. While the trend is strong, a pullback is more probable than a sustained rally from here without a clear fundamental catalyst. Wait for confirmation of a breakout above resistance or a clear pullback to support.
Is the Stochastic signal K:88.44, D:75.19 a sell signal for DXY right now?
The Stochastic indicator showing K at 88.44 and D at 75.19 on the daily chart strongly indicates deeply overbought conditions. While not an immediate sell signal on its own, it significantly increases the probability of a price reversal or consolidation, suggesting caution for new long positions.
How will upcoming inflation data affect DXY this week?
Higher-than-expected inflation data would likely reinforce the Fed's hawkish stance, supporting the DXY and potentially pushing it towards resistance levels like $101.14. Conversely, softer inflation could lead to expectations of Fed rate cuts, weakening the dollar and testing support around $100.42.
The DXY is currently at a critical juncture, trading at $100.82, where bullish momentum is being tested against significant resistance and overbought technical indicators. While the longer-term trend remains bullish, the immediate outlook suggests a period of consolidation or a potential pullback is more likely than a continued surge higher without a clear fundamental catalyst. Patience and careful risk management will be key for traders navigating this uncertain period. Watching the $100.71 support and $100.85 resistance levels will be crucial for determining the next short-term direction.
Track markets in real-time
AI-powered analysis, technical indicators and real-time price data.
Join Our Telegram Channel
Breaking market news, AI analysis and trading signals instantly.
Join Channel