The currency pair EURUSD finds itself at a critical juncture, trading around the $1.15 mark, a level where the bulls and bears are locked in a fierce tug-of-war. Last week's price action painted a picture of consolidation, with the pair failing to decisively break through key support at 1.1470, while also struggling to gain significant upward momentum. This indecision reflects a broader market sentiment that is currently balanced, awaiting clearer directional cues from upcoming economic releases and central bank pronouncements. The DXY, or Dollar Index, which typically exerts inverse pressure on EURUSD, has been exhibiting mixed signals, adding to the prevailing uncertainty. While some indicators point to potential dollar strength, others suggest a consolidation phase. This delicate balance means that both the Euro and the US Dollar are held in a relatively tight range, with traders keenly observing any shifts in risk appetite or macroeconomic data that could tip the scales.
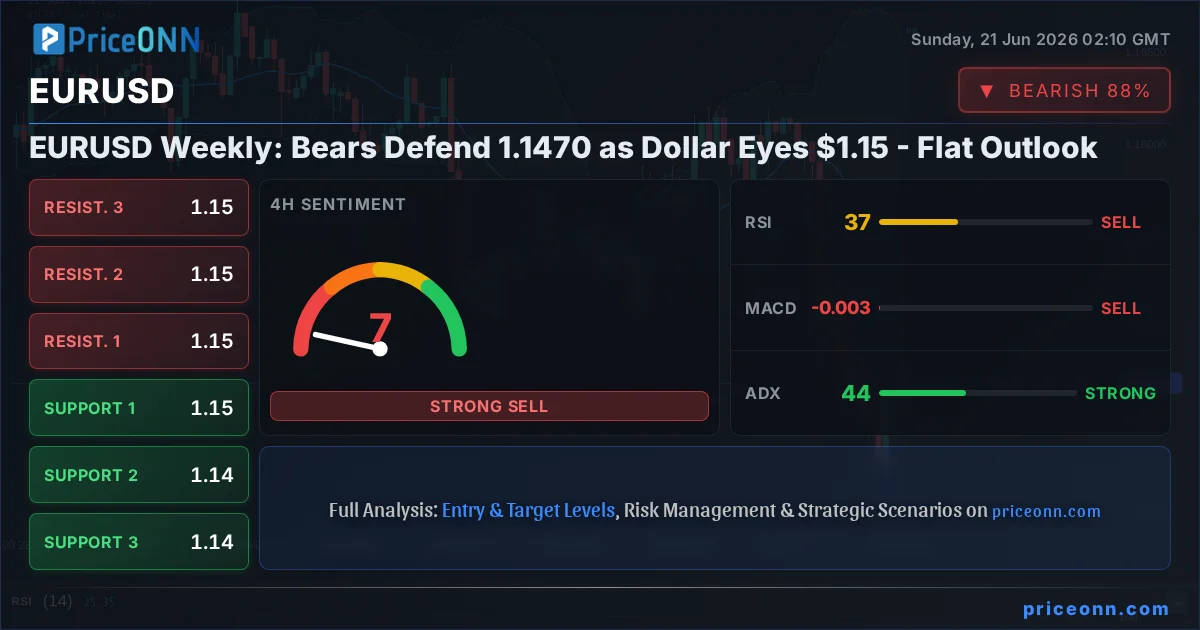
- EURUSD is trading near $1.15, caught between key support at 1.1470 and resistance around 1.1479.
- The DXY is currently at 100.82, showing a mixed trend that influences EURUSD's correlation.
- On the 1H chart, RSI at 54.6 indicates neutral momentum with a slight upward bias, while the 4H chart shows RSI at 37.35, suggesting a bearish lean.
- Key levels to watch this week are support at 1.14566 and resistance at 1.14789 on the 4H timeframe.
- Market sentiment remains cautious, with upcoming economic data releases poised to dictate the next major move for EURUSD.
The technical landscape for EURUSD, as observed across multiple timeframes, paints a picture of equilibrium, albeit with subtle directional leanings that warrant close attention. On the 1-hour chart, the Relative Strength Index (RSI) hovers around 54.6, suggesting a neutral momentum with a slight tilt towards the upside. This implies that while there isn't overwhelming buying pressure, neither is there significant selling conviction. However, a glance at the 4-hour chart reveals a different story. Here, the RSI dips to 37.35, firmly within the neutral zone but leaning towards bearish territory. This divergence across timeframes is precisely what creates the 'flat' outlook, indicating a lack of consensus among market participants about the immediate direction. The MACD indicator, which measures the momentum of a trend, shows positive momentum on the 1-hour chart, aligning with the RSI's slight bullish lean. Conversely, the 4-hour MACD exhibits negative momentum, reinforcing the bearish undertones seen in the RSI on that timeframe. This mixed signal environment is characteristic of a market caught in consolidation, where price action often becomes choppy and range-bound until a catalyst forces a breakout.
Further complicating the picture is the Stochastic Oscillator's behavior. On the 1-hour timeframe, it signals an overbought condition with K at 86.05 and D at 81.7, potentially indicating a short-term pullback or consolidation is due. Yet, on the 4-hour chart, the Stochastic presents a rising signal with K at 45.47 and D at 18.29, suggesting that despite the broader bearish lean, there's room for upward movement before hitting overbought territory. The Average Directional Index (ADX), a measure of trend strength, adds another layer to this complex analysis. On the 1-hour chart, it stands at 25.89, suggesting a moderately strong trend, while on the 4-hour chart, it jumps to 43.89, indicating a strong downward trend. This heightened ADX reading on the 4-hour chart is particularly significant; it suggests that if a directional move does occur, it could be substantial. The overall 'Sell' signal on the 4-hour timeframe, contrasted with a 'Buy' signal on the 1-hour, underscores the current lack of a clear, unified trend and highlights the importance of waiting for confirmation before committing to a trade.
The broader market context, particularly the behavior of the US Dollar Index (DXY) and major equity indices, provides crucial insights into the forces shaping EURUSD. The DXY itself is currently trading at 100.82, showing a slight daily decrease but maintaining a strong uptrend on the 4-hour and daily charts, with RSI at 65.62 and 68.14 respectively. This suggests underlying dollar strength, which typically acts as a headwind for EURUSD. However, the 1-hour DXY trend is neutral, with a sell signal, indicating short-term choppiness. The SP500, a key risk appetite indicator, is showing a strong upward trend on the 1-hour and 4-hour charts, closing at 6572.87, up 0.74%. This risk-on sentiment could, in theory, weigh on the safe-haven dollar and support EURUSD. Yet, the daily SP500 chart paints a bearish picture with RSI at 45.35 and a strong downward ADX of 47.51, suggesting that the broader equity market might be heading for a correction. This conflicting risk sentiment - risk-on in shorter timeframes and potential risk-off on the daily - adds to the indecision plaguing EURUSD. The Nasdaq100, also exhibiting a mixed picture with strong short-term uptrends but a bearish daily signal, further complicates the risk assessment.
Geopolitical developments and central bank policy expectations continue to be significant undercurrents affecting currency markets. Recent news highlights a focus on energy bottlenecks for AI, suggesting potential shifts in commodity demand and inflation expectations. Simultaneously, reports indicate that the US dollar's rally is facing a critical technical test, with markets repricing Federal Reserve policy expectations. This suggests that any hints of a more hawkish Fed stance could further bolster the dollar, while dovish signals could provide relief for EURUSD. The fact that Canada's headline inflation is expected to edge higher while core remains near target, and the USDCHF pair strengthening due to a hawkish Fed and a dovish SNB, underscores the divergence in central bank policies and their impact on currency pairs. The strengthening US dollar, as noted in various forex analyses, is aided by this Fed repricing, with market participants increasingly looking past geopolitical setbacks like the Iran situation. This environment creates a complex interplay where general dollar strength could cap EURUSD gains, even if broader risk sentiment appears positive on shorter timeframes.
The Bull Case: A Tentative Rebound Towards $1.15
The argument for a bullish continuation in EURUSD, while currently facing headwinds, is anchored in several key technical and fundamental observations. Firstly, the 1-hour chart provides some solace for the bulls. The RSI at 54.6, while neutral, leans towards upside momentum, suggesting that buying interest is not entirely absent. The MACD on this timeframe also shows positive momentum, with the MACD line above the signal line, indicating that recent price action has been accompanied by increasing bullish energy. Furthermore, the Stochastic Oscillator on the 1-hour chart is in overbought territory (K=86.05, D=81.7), which, while often signaling a potential reversal, can also indicate strong underlying buying pressure that may persist for a short while longer, or at least lead to a period of consolidation before a move higher. This can be a precursor to a breakout if key resistance levels are breached. The ADX at 25.89 on the 1-hour chart suggests a trend is present, albeit not overwhelmingly strong, which could support a move towards higher resistance levels if the bulls can muster enough force.
From a fundamental perspective, the bull case hinges on the possibility of a less hawkish stance from the Federal Reserve than currently priced in, or a renewed focus on broader economic risks that might prompt a flight to safety away from the dollar. While recent analyses suggest the dollar is being supported by Fed repricing, any indication that inflation is cooling faster than expected, or that the Fed is becoming more sensitive to the impact of high rates on economic growth, could shift the narrative. Additionally, if the risk-on sentiment observed in the SP500 and Nasdaq on shorter timeframes continues, it could indirectly benefit EURUSD by weakening the safe-haven dollar. The fact that the EURUSD gained 0.12% on the day to 1.14706, despite broader dollar strength, indicates some resilience in the Euro. The daily trading range of 1.14171 to 1.14798 shows that price has been contained, but the upper end of this range represents a potential area for upward exploration if buying pressure intensifies. The key is whether buyers can push past the immediate resistance levels and establish a foothold above $1.15.
For scalpers and short-term traders, the 1-hour chart's signals are paramount. The positive MACD and the RSI above 50 offer a slight edge for quick entries targeting the immediate resistance levels. However, the overbought Stochastic necessitates caution, implying that quick profit-taking or a tight stop-loss strategy is advisable. Swing traders might look for a confirmation of a break above the 1.1479 resistance, potentially targeting the next resistance level at 1.14861 or even higher if momentum builds. The ADX on the 4-hour chart at 43.89, however, signals a strong downtrend, which means any bullish move could be a counter-trend rally, making risk management crucial. Long-term investors, while observing the current indecision, would likely be looking for a more decisive break above the psychological $1.15 level and sustained upward momentum on daily charts before considering a significant long position. The current price action near $1.15 is more indicative of consolidation than a robust trend change.
The Bear Case: Dollar Strength and Technical Resistance at $1.15
The bearish argument for EURUSD is compelling, primarily driven by the persistent strength of the US dollar and concerning technical signals on medium-term charts. The DXY's overall uptrend, despite short-term fluctuations, provides a solid foundation for dollar-centric weakness in pairs like EURUSD. The daily RSI for the DXY is at 70.32, indicating it's approaching overbought territory, but the strong ADX of 32.38 confirms a robust uptrend is in place. This suggests that dollar strength could persist, capping any significant upside for EURUSD. On the EURUSD's 4-hour chart, the RSI at 37.35 and the MACD showing negative momentum, coupled with the ADX at a strong 43.89, all point towards prevailing bearish pressure. This indicates that the medium-term trend is down, and any rallies are likely to be met with selling interest as traders position for further declines.
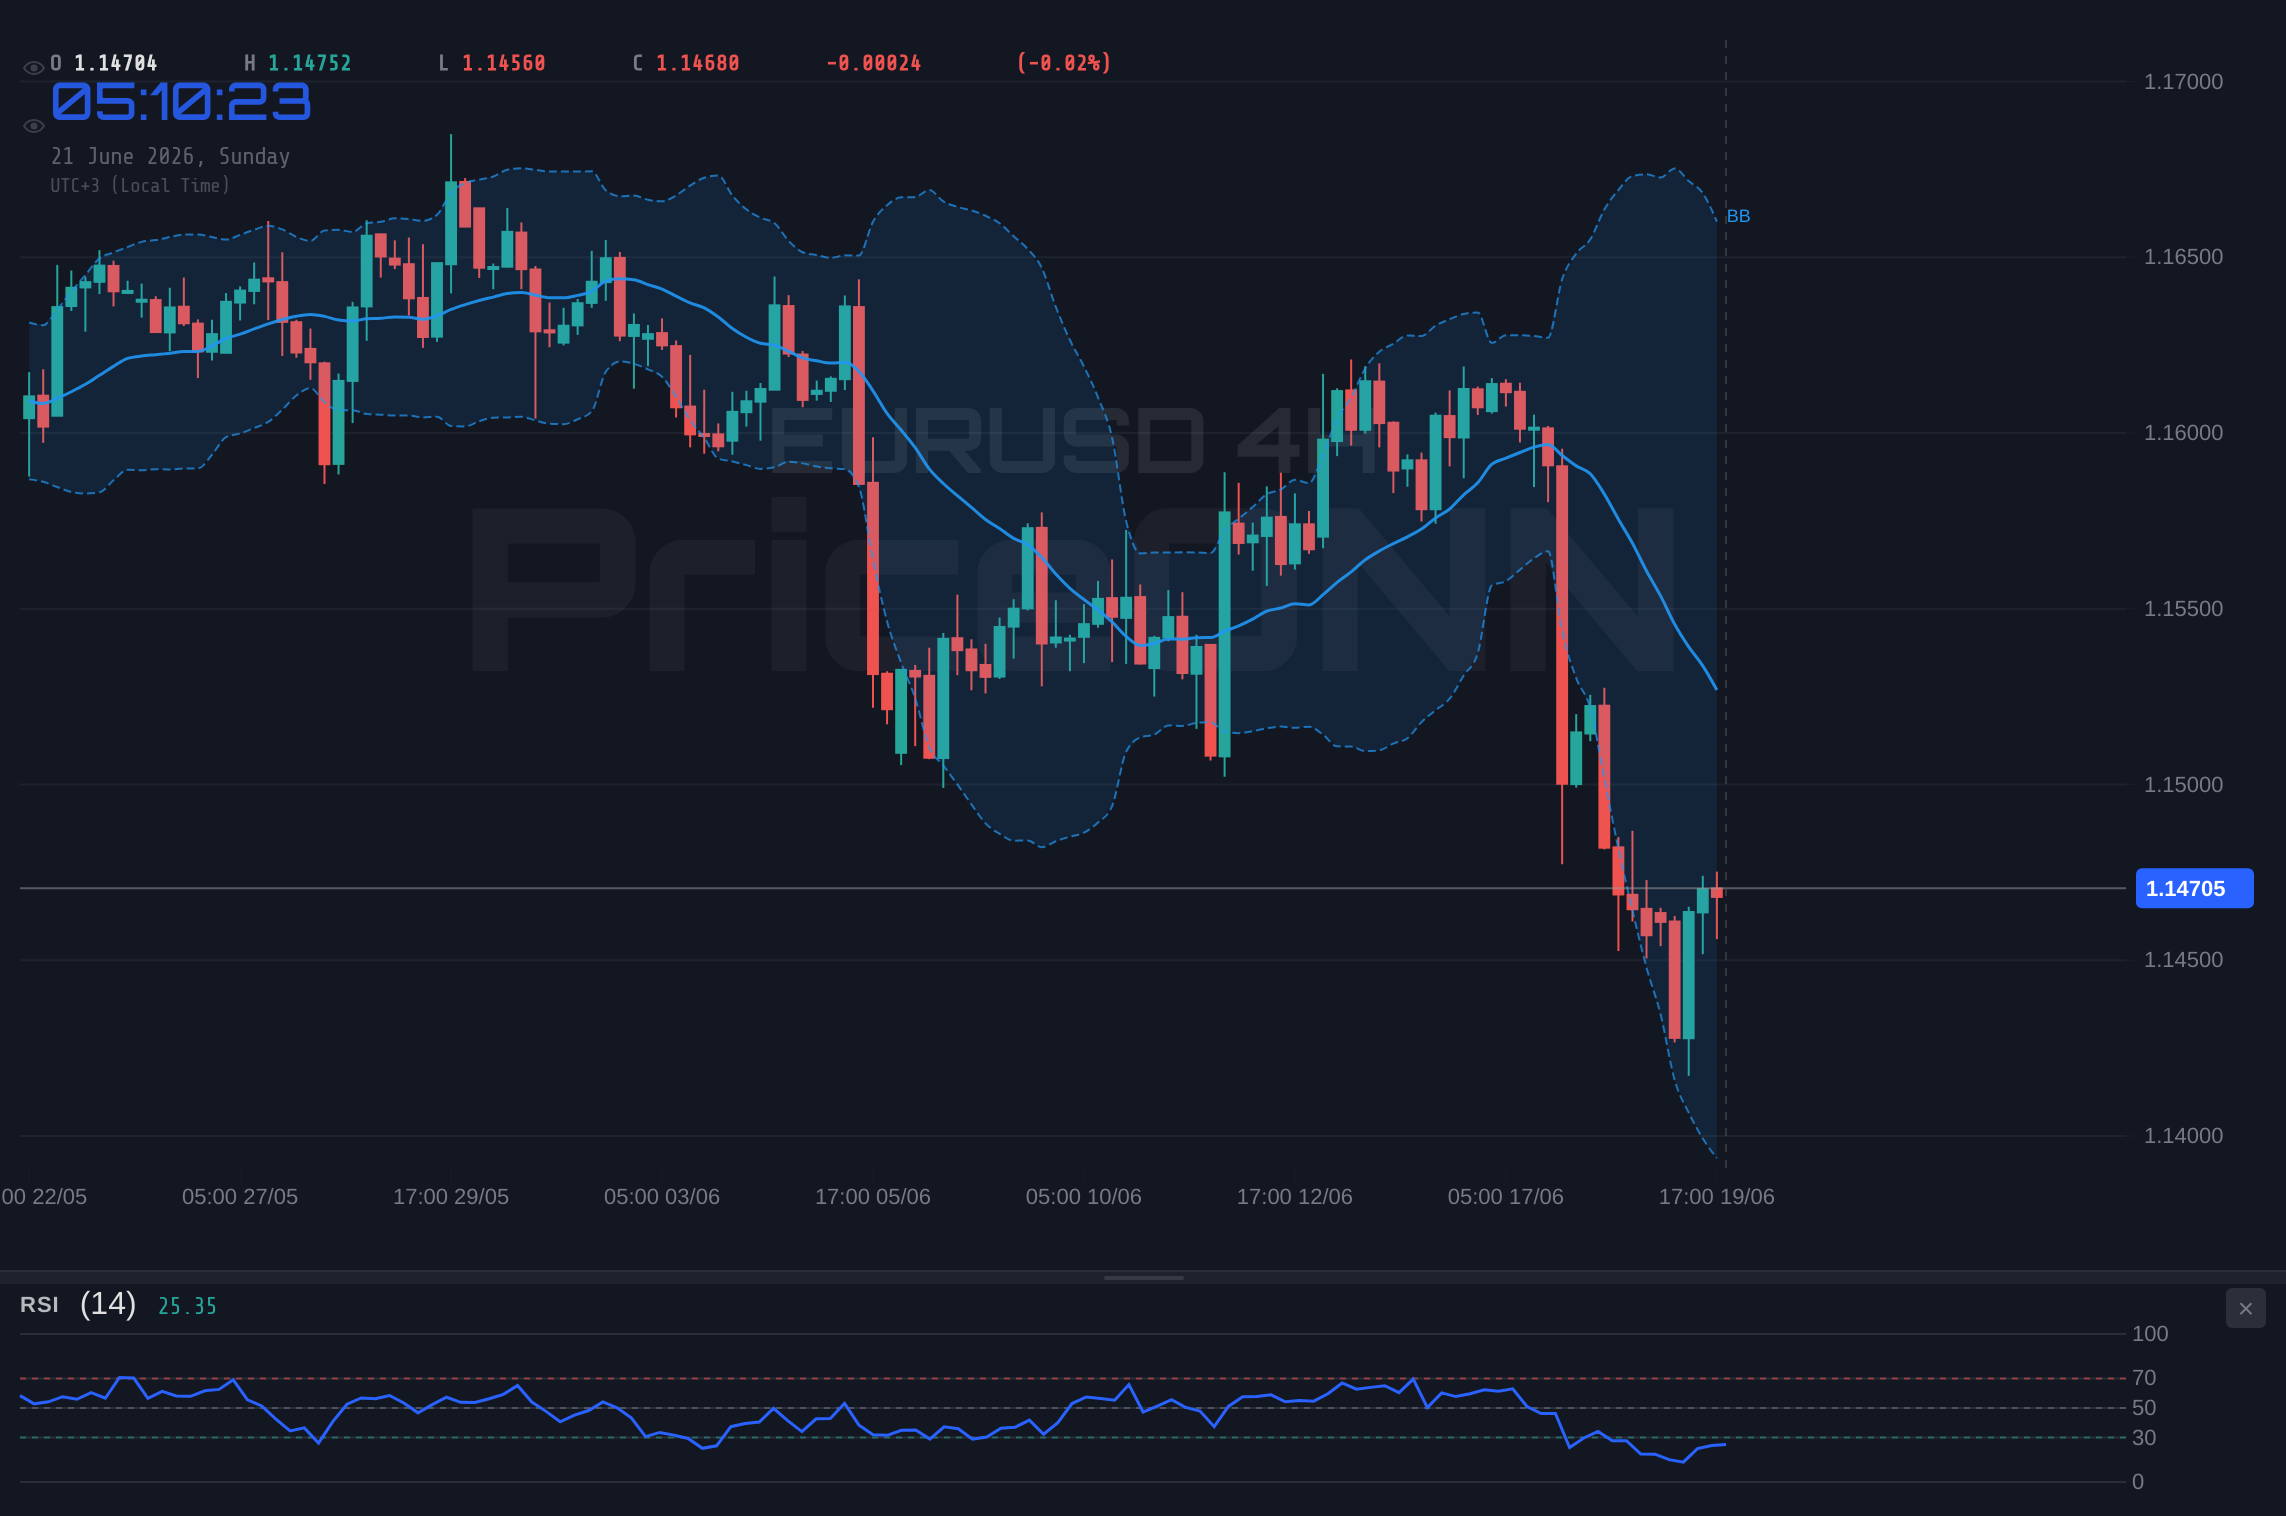
The daily chart analysis for EURUSD reinforces the bearish outlook. With an RSI of 35.32, well within the neutral zone and trending downwards, and a MACD below its signal line, the longer-term picture is also tilted bearish. The Bollinger Bands on the daily chart are shown to be below the middle band, indicating a bearish trend, and the price is trading below the lower band, suggesting it's oversold or experiencing a significant breakdown. The Stochastic Oscillator on the daily chart (K=14.61, D=40.52) confirms the downward momentum, with %K below %D, signaling a potential continuation of the decline. The ADX at 25.41 on the daily chart indicates a moderately strong downtrend, suggesting that sellers have the upper hand over the longer horizon. This technical setup implies that the current trading range near $1.15 is more of a pause before a potential leg lower, rather than a stable base for a recovery.
Fundamental factors also lend weight to the bear case. The narrative of a hawkish Federal Reserve, even if markets are repricing it, continues to support the dollar. Any data that reinforces the idea of sticky inflation or a resilient US economy could lead to further dollar appreciation. Conversely, any sign of weakness in the Eurozone economy or a dovish shift from the European Central Bank (ECB) would exacerbate the downward pressure on EURUSD. Recent news highlighting the dollar's dominance and market participants looking past geopolitical setbacks suggests that the dollar's strength is a prevailing theme. While the SP500's short-term uptrend might suggest risk-on, the daily bearish signal and high ADX indicate that this sentiment could reverse quickly, leading to a flight to the dollar as a safe haven. For traders, the key resistance levels on the 4-hour chart, such as 1.14789 and 1.15012, represent significant hurdles that bulls must overcome to invalidate the bearish thesis.
From a trading perspective, the bearish scenario suggests looking for opportunities to sell into rallies. Scalpers might fade moves towards the 1.1479 resistance, aiming for a quick profit on a reversal. Swing traders could wait for a decisive break below the 1.14566 support level on the 4-hour chart, targeting the next support at 1.1443 or even lower. Long-term investors might see current levels as an opportunity to initiate or add to short positions, anticipating a retest of lower levels observed in March 2026, around 1.14292 or below. The confluence of bearish signals across multiple timeframes, coupled with the underlying strength of the dollar, makes the bear case a prominent consideration for market participants.
Navigating the Neutral Zone: What to Watch for EURUSD Traders
Given the conflicting signals across different timeframes and indicators, the most probable scenario for EURUSD in the near term appears to be continued consolidation or a period of sideways trading. This neutral outlook is often characterized by lower volatility and a lack of clear direction, making it challenging for traders seeking strong trending opportunities. However, such periods can present their own set of trading strategies, often involving range-bound plays or waiting for a breakout confirmation. The key for traders during this phase is to avoid premature entry and to focus on identifying the boundaries of the current trading range, which appear to be defined by the support at 1.1470 and resistance around 1.1479 on the 1-hour chart, and more significantly, the 4-hour support at 1.14566 and resistance at 1.14789.
The divergence in RSI readings between the 1-hour (54.6) and 4-hour (37.35) charts, along with the Stochastic Oscillator's contrasting signals (overbought on 1H, rising on 4H), perfectly encapsulates the market's indecision. This suggests that neither the bulls nor the bears have a firm grip on the price action. The ADX readings also contribute to this neutral narrative, with a weak trend indicated on the 1-hour (25.89) and a strong downtrend on the 4-hour (43.89), creating a conflict that often leads to ranging markets. For scalpers, this might mean trading the edges of the established range, buying near support and selling near resistance, always with tight stops to manage risk. For swing traders, the strategy would likely involve waiting for a clear break of either the key support or resistance levels, confirming a directional bias before entering a trade. Long-term investors should remain patient, observing the price action for signs of a more sustained trend development, potentially looking for a decisive move above $1.15 or a clear break below the lower support levels.
The interplay between the DXY and EURUSD is also crucial to monitor during this neutral phase. While the DXY shows a strong daily uptrend, its 1-hour trend is neutral, creating an environment where their correlation might weaken or become erratic. Traders should watch for divergences: if the DXY rallies significantly while EURUSD remains flat or falls, it could signal underlying weakness in EURUSD. Conversely, if EURUSD starts to climb despite dollar strength, it might indicate a significant shift in sentiment or strong Euro-specific news. The upcoming economic calendar, featuring key inflation data and central bank speeches, will be critical in breaking this stalemate. Any surprises in these releases could trigger the much-needed volatility to push EURUSD out of its current range and provide clearer trading signals.
The correlation analysis with other markets further highlights the complexity. While the SP500 shows strength on shorter timeframes, its daily bearish signal suggests potential headwinds for risk assets, which could indirectly support the dollar and pressure EURUSD. Oil prices (Brent at 80.12, WTI at 77.16) are showing upward momentum on shorter timeframes but are in strong daily downtrends, reflecting uncertainty in the energy markets that could spill over into broader inflation concerns and central bank policy considerations. This broad market indecision emphasizes the need for EURUSD traders to remain disciplined, focus on price action at key levels, and wait for clear confirmation before committing capital. The current price around $1.15 represents a battleground, and the outcome will likely be determined by the confluence of technical signals and the next wave of macroeconomic data.
Bearish Scenario: Testing Lower Support
65% ProbabilityNeutral Scenario: Range-Bound Consolidation
25% ProbabilityBullish Scenario: Reclaiming $1.15
10% ProbabilityFrequently Asked Questions: EURUSD Analysis
What happens if EURUSD breaks below the 1.14566 support level?
A break below the 1.14566 support on the 4-hour chart would likely trigger the bearish scenario, invalidating the neutral outlook. This could lead to a test of the next support levels at 1.14430 and potentially 1.14343 as the downtrend gains momentum.
Should I trade EURUSD at current levels of $1.15 given the mixed signals?
Trading at current levels of $1.15 is risky due to the mixed signals and neutral outlook. A 65% probability bearish scenario suggests caution, while a 10% bullish scenario indicates limited upside potential. Waiting for a clear break above 1.14789 or below 1.14566 is recommended for clearer trade setups.
Is the RSI at 37.35 on the 4H chart a sell signal for EURUSD?
An RSI of 37.35 on the 4-hour chart leans towards bearish momentum but is not an outright sell signal on its own. It indicates that selling pressure is present, supporting the bearish case, but confirmation from other indicators like MACD and price action breaking key support levels is needed.
How will upcoming economic data affect EURUSD this week?
Upcoming economic data, particularly inflation figures and central bank commentary, could be the catalyst to break EURUSD out of its current range. Positive surprises for the US economy could strengthen the dollar and push EURUSD lower, while concerning Eurozone data could have a similar effect.
📊 Technical Outlook Summary
| Indicator | Value | Signal | Interpretation |
|---|---|---|---|
| RSI (14) | 35.32 | Bearish | Daily RSI at 35.32 indicates downward momentum. |
| MACD Histogram | -0.002 | Bearish | Daily MACD below signal line suggests weakening bullish momentum. |
| Stochastic | 14.61 / 40.52 | Bearish | Daily Stochastic %K |
| ADX | 25.41 | Bullish | Daily ADX at 25.41 indicates a moderately strong trend. |
| Bollinger Bands | Lower Band Break | Bearish | Price below lower band on daily suggests oversold conditions or breakdown. |
Key Levels
Track markets in real-time
AI-powered analysis, technical indicators and real-time price data.
Join Our Telegram Channel
Breaking market news, AI analysis and trading signals instantly.
Join Channel