The currency pair USDJPY is currently finding itself at a critical juncture, trading precisely at $161.70. This level is more than just a number; it represents a fierce tug-of-war between bullish and bearish forces, each vying for control. The recent surge in the Dollar Index (DXY) to 100.98, coupled with shifting market sentiment around the Federal Reserve's next moves, has created a complex landscape for this high-yielding currency pair. Understanding the interplay between these fundamental drivers and the underlying technical picture is crucial for navigating the potential volatility ahead.
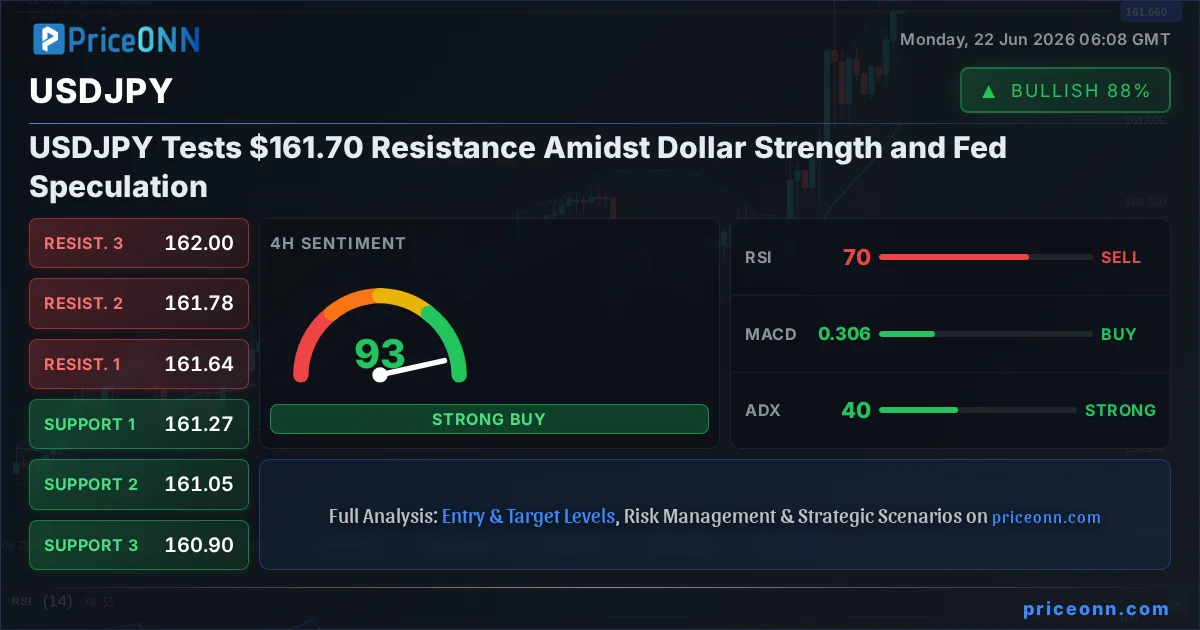
- RSI at 72.19 on the 1H chart signals overbought pressure for USDJPY, suggesting a potential for consolidation or pullback.
- The critical resistance level is currently holding firm at $161.809, a key barrier for further upward momentum.
- A break below $161.597 support could initiate a short-term correction, driven by profit-taking or a shift in market sentiment.
- The strong DXY at 100.98 is providing a supportive backdrop for USDJPY, but Fed rate expectations remain the pivotal factor.
The Bull Case: Dollar Dominance and Carry Trade Appeal
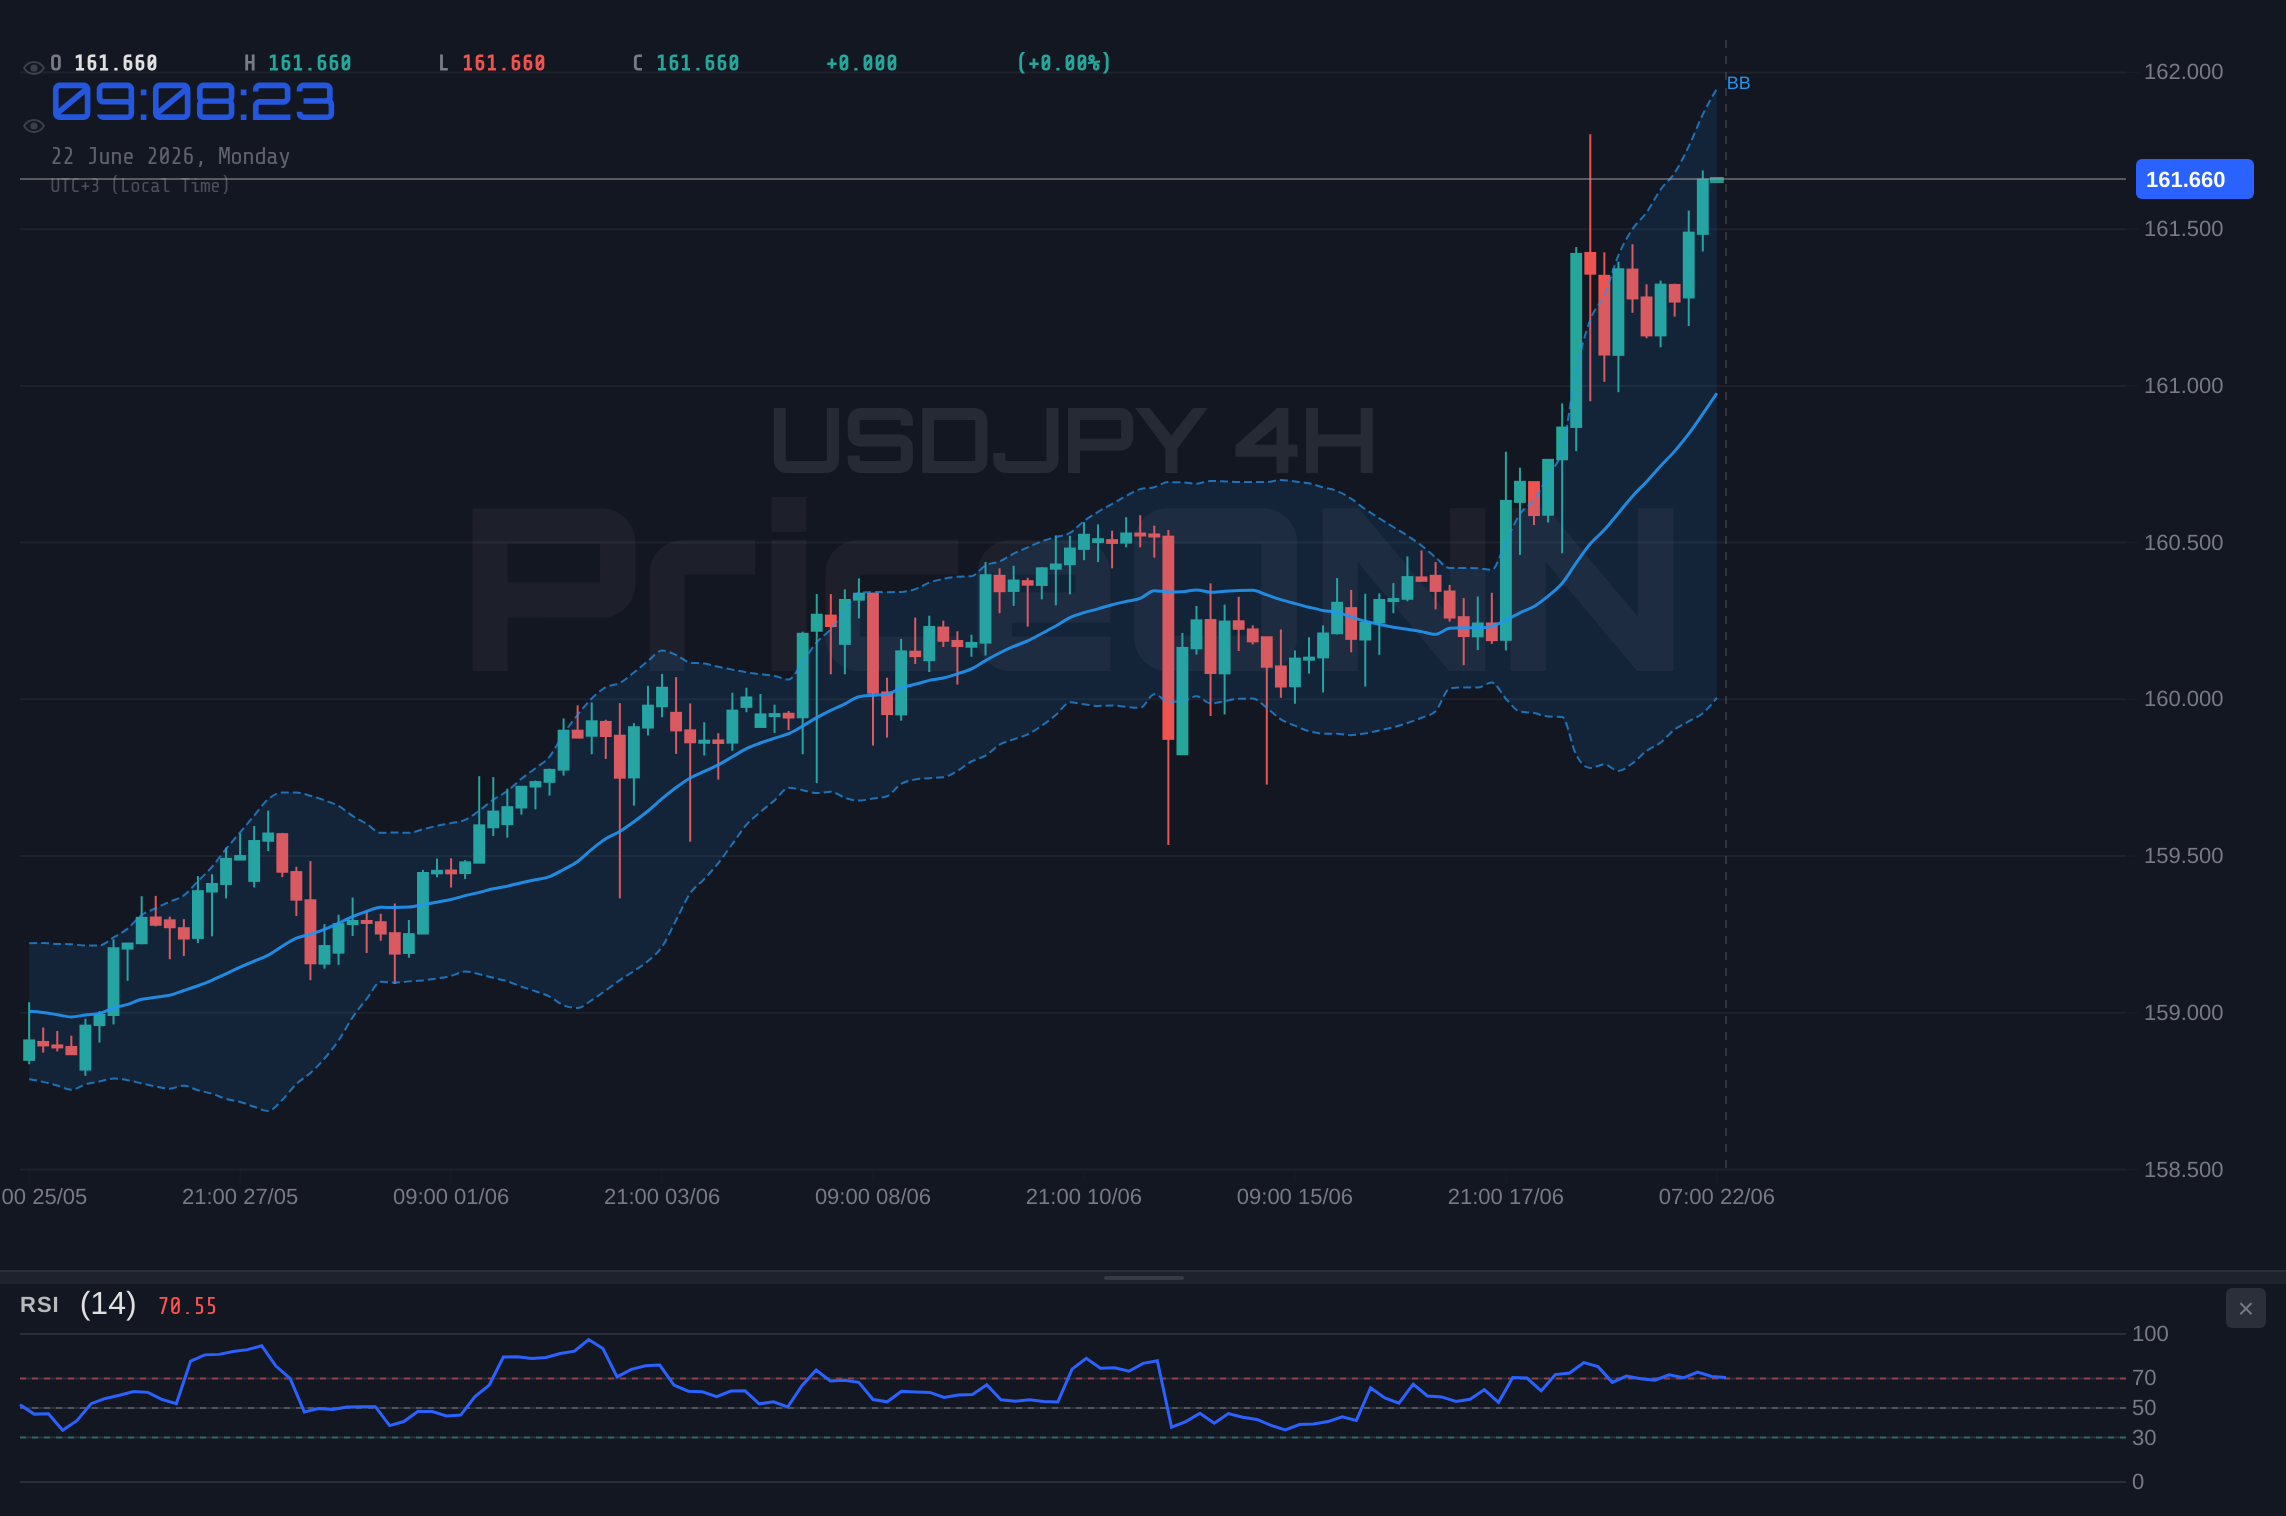
The bullish argument for USDJPY is primarily anchored in the persistent strength of the US dollar, as evidenced by the Dollar Index (DXY) trading at 100.98. This strength is not occurring in a vacuum; it's fueled by a combination of factors, including the Federal Reserve's hawkish undertones and a global search for yield. In an environment where other major central banks, particularly the Bank of Japan, maintain ultra-loose monetary policies, the interest rate differential between the US and Japan becomes a powerful magnet for capital. This carry trade dynamic, where investors borrow in a low-interest-rate currency (JPY) to invest in a higher-interest-rate currency (USD), remains a significant tailwind for USDJPY. The 1H chart shows a strong bullish trend with an ADX of 20.12, indicating a solidifying upward move, and a general buy signal across multiple indicators. The RSI at 72.19, while signaling overbought conditions, also reflects robust buying interest that has pushed the pair towards its current resistance levels. The 4H chart further reinforces this bullish sentiment with a general buy signal and an ADX of 40.11, suggesting a strong trend is in play. Even the daily chart, while showing a slightly weaker ADX at 16.49, still leans towards a bullish outlook with a general buy signal.
The economic backdrop is also playing a role. While specific economic calendar data releases are not provided for the immediate context of USDJPY's fundamental drivers, the general correlation with the DXY's upward trajectory is undeniable. A stronger dollar typically means that US economic conditions are perceived as more favorable relative to other major economies, or that global risk aversion is pushing investors towards the perceived safety and yield of US assets. The recent news mentioning a potential 'Dollar Rally Faces Defining Technical Test as Fed Repricing Reshapes Markets' directly speaks to this narrative, highlighting how market expectations about the Fed's policy path are currently dictating the dollar's strength. If the market continues to price in a more hawkish stance from the Fed, or if other major economies show signs of significant slowdown, the appeal of USDJPY as a carry trade vehicle will only intensify. The upward momentum observed on the hourly chart, with the MACD positive and above its signal line, further supports the idea that buyers are currently in control, aiming to push the pair higher.
The Bear Case: Overbought Conditions and Fed Policy Uncertainty
Conversely, the bearish perspective on USDJPY hinges on two primary concerns: the pair's current overbought technical conditions and the inherent uncertainty surrounding future Federal Reserve policy. On the 1H chart, the RSI is flashing a warning at 72.19, deep into overbought territory. This suggests that the recent rally may have been too rapid, increasing the likelihood of a correction or at least a period of consolidation as sellers step in to take profits or initiate short positions. The Stochastic indicator on the same timeframe also shows a bearish signal with %K below %D, further emphasizing the potential for a short-term pullback. While the ADX at 20.12 on the 1H chart indicates a trend, the RSI divergence is a classic sign that the momentum might be waning. The daily chart's ADX at 16.49 also points to a weakening trend, which could suggest that the current upward move is losing steam.
Furthermore, the Federal Reserve's policy path remains a subject of intense debate and market speculation. While recent sentiment might lean hawkish, any indication of a pause or pivot from the Fed could significantly alter the dynamics of the dollar's strength and, consequently, USDJPY. The news snippet 'Dollar Rally Faces Defining Technical Test as Fed Repricing Reshapes Markets' is a clear signal that market participants are closely watching for any shifts in Fed expectations. If inflation data begins to show a sustained cooling trend, or if employment figures suggest a significant economic slowdown, the market's pricing of future rate hikes could reverse, putting downward pressure on USDJPY. The fact that the 1H chart shows a general 'Sell' signal from 3 out of 8 indicators, despite the overall bullish trend, highlights this underlying tension. The immediate resistance at $161.809 is a key level that bulls need to overcome decisively; failure to do so could trigger a cascade of selling as traders reassess their long positions.
The news about 'USD/JPY Breaks Above 161 After FOMC While WTI Crude Oil Falls' suggests that the FOMC announcement has already been a catalyst for upward movement, but the mention of WTI falling alongside it hints at broader market correlations that might not always favor USDJPY. A significant drop in oil prices, for instance, could signal weakening global demand, which might eventually impact US economic growth prospects and, by extension, Fed policy expectations. While the DXY is currently strong at 100.98, sustained weakness in global risk appetite or a surprising shift in Fed rhetoric could quickly change the narrative, leading to a reversal in USDJPY. The bearish stochastic signal on the 1H chart, coupled with the high RSI, presents a tangible risk of a near-term correction, even if the longer-term trend remains bullish.
Technical Battleground: Levels and Indicators in Focus
The technical landscape for USDJPY is a fascinating study in conflicting signals and critical levels. On the 1H timeframe, the prevailing trend is bullish, supported by a general buy signal from 6 out of 8 indicators. The ADX at 20.12 suggests a moderate trend, but the RSI at 72.19 and the Stochastic (%K=96.45, %D=89.48) on the 4H chart are screaming 'overbought'. This divergence is key; it indicates that while the upward momentum is strong, the market may be getting stretched. The immediate resistance at $161.809 is a crucial barrier. A decisive break and hold above this level would likely confirm the continuation of the bullish trend, potentially targeting higher levels. However, failure to break this resistance could lead to a sharp pullback, with immediate support found at $161.703, followed by $161.635, and then the more significant $161.597. The MACD's positive momentum on the 1H chart supports the bulls, but the daily chart's MACD is negative, signaling a potential conflict between short-term and long-term trends.
The 4H timeframe paints a slightly more cautious picture. While the overall signal leans bullish (7 buys, 1 sell), the ADX at 40.11 indicates a strong trend, but this is often the point where trends can either accelerate or reverse. The RSI at 70.82 is in overbought territory, and the Stochastic (%K=72.15, %D=63.42) also shows conditions ripe for a reversal or consolidation. The key support level on this timeframe is $161.267, a break below which could signal a more significant correction. Resistance is seen at $161.635, $161.781, and $162.003. The daily chart, however, presents a mixed bag. The ADX at 16.49 suggests a weak trend, and the RSI at 71.3 is overbought. Yet, the general signal is still bullish (6 buys, 1 sell), indicating that the long-term outlook might remain positive despite short-term overbought conditions. This conflict between timeframes is typical in strong trending markets; it highlights the importance of precise entry and exit points.
The Macroeconomic Crosscurrents: DXY, Fed, and Carry Trade Dynamics
The fundamental narrative for USDJPY is inextricably linked to the DXY's performance and the Federal Reserve's policy stance. The DXY is currently trading at 100.98, a level that historically exerts downward pressure on USDJPY due to its inverse correlation. However, the current market dynamics suggest that the DXY's strength is primarily driven by factors that also support USDJPY, such as the interest rate differential and carry trade appeal. The news about the 'Dollar Rally Faces Defining Technical Test as Fed Repricing Reshapes Markets' underscores that the Fed's perceived policy path is paramount. If the market anticipates continued hawkishness from the Fed, or if other central banks signal a more dovish stance, the dollar's strength will likely persist, bolstering USDJPY.
Conversely, any sign of the Fed backing down from its hawkish stance, perhaps due to softening inflation or employment data, could trigger a sharp correction in USDJPY. The news mentioning 'USD/JPY Breaks Above 161 After FOMC' indicates that the Fed's announcements have already been a catalyst for upward price action. However, the market's interpretation of these announcements is what truly matters. If traders perceive the FOMC's commentary as less hawkish than expected, or if they anticipate an earlier-than-expected rate cut, the bullish momentum for USDJPY could quickly evaporate. The carry trade, a significant driver of USDJPY's strength, is highly sensitive to interest rate differentials. As long as the Bank of Japan maintains its accommodative policy while the Fed keeps rates elevated or signals further hikes, the carry trade will remain attractive. However, any significant shift in BOJ policy, though unlikely in the short term, would drastically alter this dynamic.
Navigating the Crossroads: Verdict and Outlook
The current technical setup for USDJPY presents a classic bull vs. bear debate at a crucial resistance level. On one hand, the bullish trend is supported by a strong dollar, the appeal of the carry trade, and the potential for continued Fed hawkishness. The 1H and 4H charts show strong bullish signals, with ADX readings indicating trending conditions. On the other hand, the overbought RSI and Stochastic readings on the 1H and 4H charts, coupled with the potential for a shift in Fed policy or a broader risk-off sentiment, present significant headwinds. The daily chart's weaker trend indicators suggest that the current rally might be losing steam at the higher levels.
Given the conflicting signals and the critical resistance at $161.809, the most prudent approach is one of caution. While the bullish momentum is evident, the overbought conditions and the proximity to significant resistance suggest that a breakout might not be immediate. The market appears to be waiting for further catalysts, likely from upcoming economic data or central bank commentary, to determine the next significant move. The price action around $161.70 is a battleground, and a decisive close above $161.809 would be needed to confirm further upside, targeting $162.003 and beyond. Conversely, a failure to break this resistance, coupled with a break of the immediate support at $161.597, could initiate a correction towards $161.491 or even $161.267.
The geopolitical context, particularly regarding energy markets and the Strait of Hormuz, also adds a layer of complexity. While recent news suggests a potential easing of tensions, the broader implications for global inflation and central bank policy remain. Any resurgence in energy price volatility could reignite inflation concerns, potentially leading to a more hawkish Fed stance, which would, in turn, support USDJPY. However, if global demand weakens significantly, as suggested by some commodity price movements, it could temper inflation fears and shift Fed expectations dovishly. For traders, the key is to remain data-dependent and observe price action around the mentioned levels. Patience appears to be the most rewarding strategy currently, waiting for a clear directional signal rather than attempting to front-run a potentially indecisive market.
Bearish Scenario: Correction Underway
40% ProbabilityConsolidation Scenario: Range-Bound Battle
35% ProbabilityBullish Scenario: Breakout Continues
25% ProbabilityFrequently Asked Questions: USDJPY Analysis
What happens if USDJPY breaks above $161.809 resistance?
A sustained break above $161.809 on the 1H chart would likely confirm the continuation of the bullish trend. This could trigger further buying, potentially targeting the $162.003 level, fueled by carry trade momentum and positive Fed sentiment. However, traders should watch for overbought signals on shorter timeframes.
Should I buy USDJPY at current levels of $161.70 given the RSI at 72.19?
Buying at $161.70 presents a risk due to the RSI at 72.19 signaling overbought conditions on the 1H chart. While the trend is bullish, a pullback is possible. A more conservative approach would be to wait for a clear breakout above $161.809 or a dip towards support levels like $161.597, offering a better risk-reward ratio.
Is the RSI at 72.19 a sell signal for USDJPY right now?
An RSI of 72.19 on the 1H chart is considered overbought and suggests that the recent rally may be extended. While it's not an immediate sell signal in a strong uptrend, it indicates that the upward momentum could be waning and a correction or consolidation is likely. Traders often look for confirmation from other indicators or price action before initiating a short position.
How will the Fed's policy expectations affect USDJPY this week?
Fed policy expectations are a primary driver for USDJPY. If market sentiment leans towards continued hawkishness or higher-for-longer rates, USDJPY could see further upside due to the interest rate differential. Conversely, any hint of a dovish shift or potential rate cuts could trigger a sharp sell-off, as the carry trade appeal diminishes.
Track markets in real-time
AI-powered analysis, technical indicators and real-time price data.
Join Our Telegram Channel
Breaking market news, AI analysis and trading signals instantly.
Join Channel