The forex market is abuzz with activity surrounding USDJPY, currently trading at precisely $161.42. This pivotal level is drawing significant attention as traders eye potential moves towards the $161.95 resistance zone. The interplay between a strengthening dollar, as indicated by the DXY's ascent to 100.91, and the Bank of Japan's ultra-loose monetary policy continues to fuel this pair's upward momentum. However, as technical indicators flash mixed signals across different timeframes, the question remains: is this rally sustainable, or are we due for a correction? This analysis delves into the multi-faceted technical landscape of USDJPY, exploring the conditions that could drive it higher, the risks that might pull it back, and the neutral territory where it could consolidate.
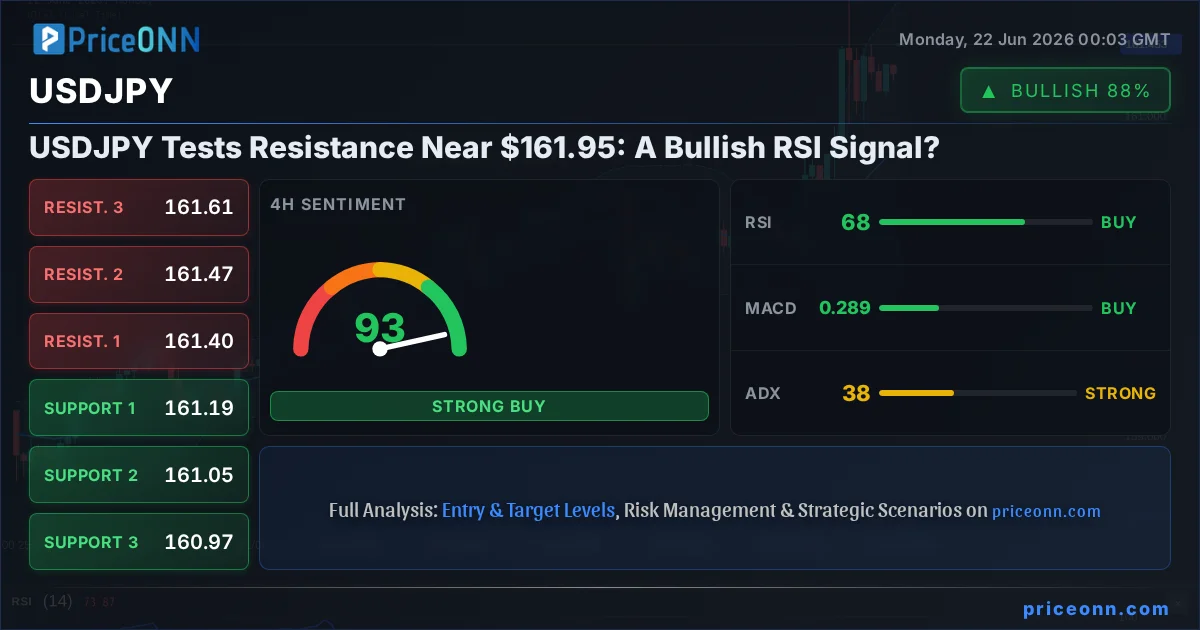
- USDJPY trades at $161.42, with 4H RSI at 67.14 suggesting upward momentum but nearing overbought territory.
- Key resistance is eyed near $161.95, while crucial support lies at $161.05 on the 1H chart.
- The DXY is strong at 100.91, correlating with USD strength, while the ADX at 38.18 indicates a robust trend.
- A sustained break above $161.95 could target $163.29, whereas a failure might lead to a pullback towards $161.05.
The 4-hour chart presents a compelling picture for USDJPY. The Relative Strength Index (RSI) stands at 67.14, indicating strong bullish momentum but hovering near the threshold of overbought conditions. This suggests that while buyers are in control, the pace might be unsustainable without a pause or consolidation. The Average Directional Index (ADX) at 38.18 confirms a strong existing trend, reinforcing the bullish bias, but also hinting that significant further acceleration might require fresh catalysts. The Stochastic Oscillator, however, offers a slightly cautionary note, with the %K line at 62.55 and the %D line at 65.35, suggesting a potential bearish crossover if the market turns. This divergence across indicators warrants a careful, scenario-based approach rather than a simple directional bet.
Digging deeper into the intraday dynamics, the 1-hour chart shows USDJPY trading around $161.42, with immediate resistance identified at $161.496 and a more significant hurdle at $161.644. The RSI here is at 61.37, still comfortably in neutral territory and supporting further upside. The MACD is showing positive momentum, trading above its signal line, which aligns with the bullish sentiment. However, the Stochastic Oscillator is quite extended, with %K at 85.59 and %D at 76.04, firmly in overbought territory and flashing a clear warning of a potential pullback or reversal. This intraday picture suggests that while the immediate pressure is upwards, the risk of a short-term correction is elevated, especially if the pair fails to decisively break through the initial resistance levels. The ADX at 10.69 on this timeframe indicates a weak trend, suggesting that any move might be choppy or range-bound in the very short term.
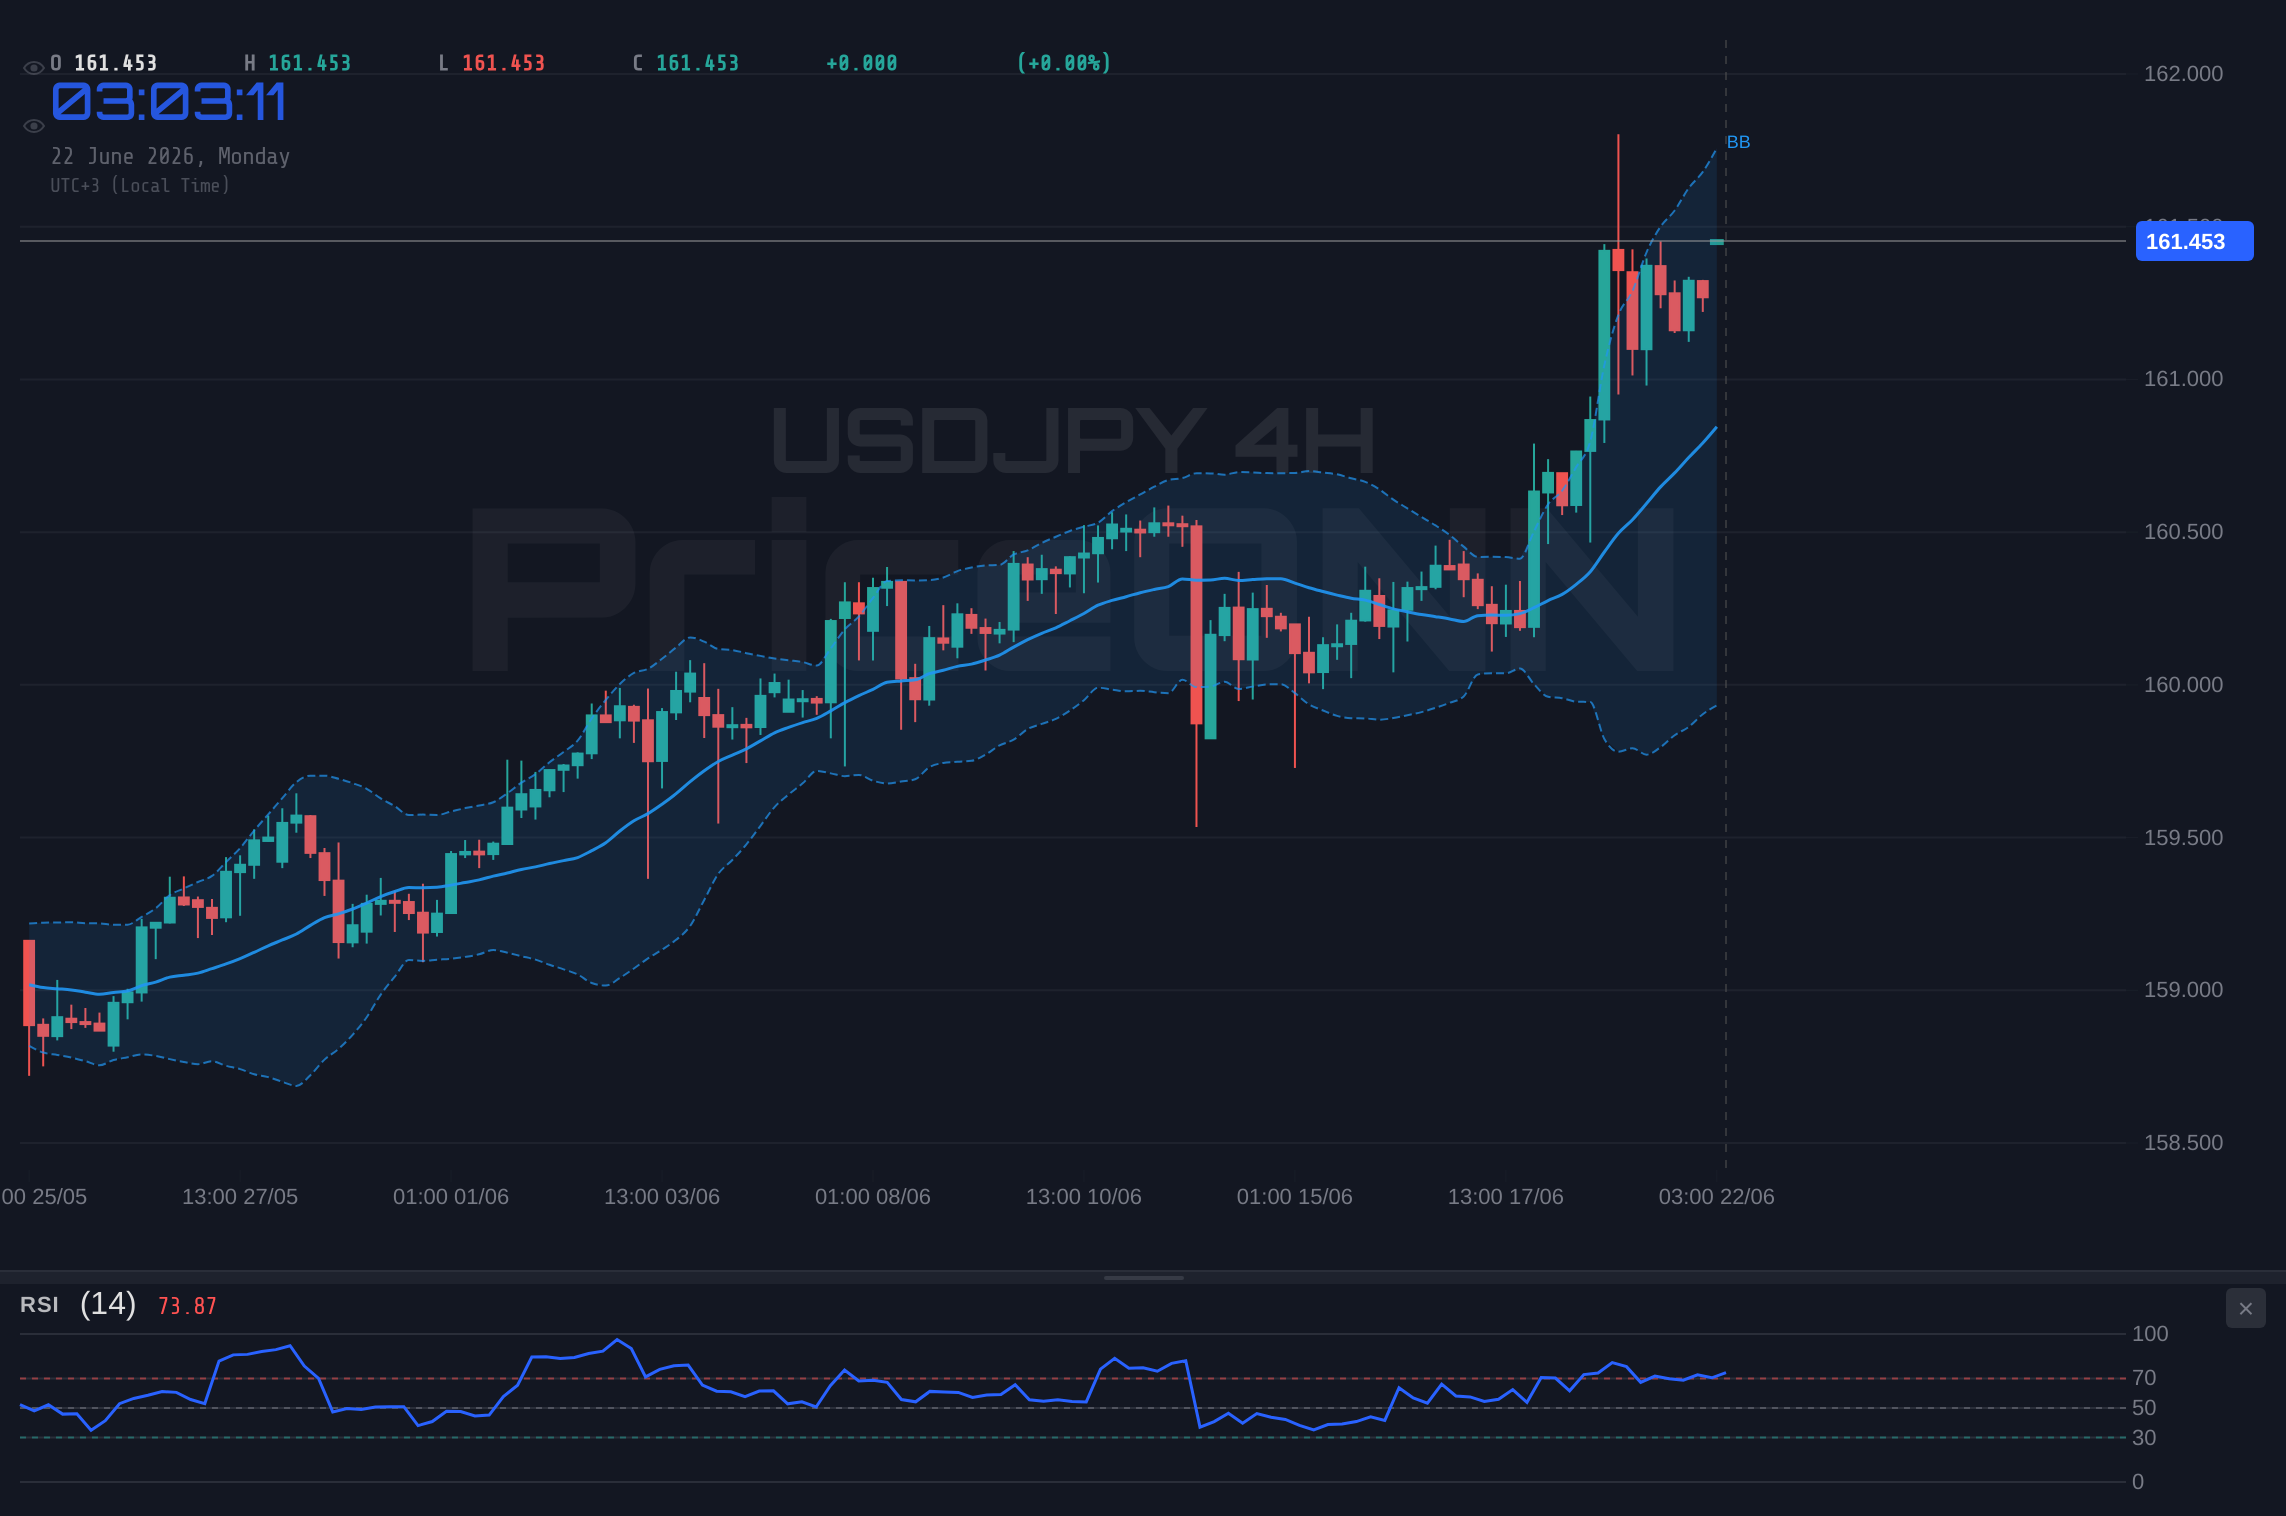
On the daily timeframe, USDJPY presents a strong uptrend narrative, with the price action consistently above key moving averages and supported by a robust ADX reading of 32.38. The RSI at 70.1 is firmly in overbought territory, a classic signal that the asset may be due for a pullback or consolidation. This aligns with the Stochastic Oscillator's reading, where %K at 83.7 and %D at 76.12 indicate an overbought condition with a potential bearish crossover imminent. Despite these overbought signals, the MACD remains positive, trading above its signal line, suggesting that the underlying bullish momentum is still intact. The Bollinger Bands are also showing the price trading above the upper band, indicating an extended move. This daily picture suggests that while the trend is undeniably bullish, the current levels present a risk for aggressive new long entries, favouring caution or waiting for a pullback.
The strength of the US Dollar, as measured by the DXY, is a critical factor influencing USDJPY. With the DXY currently at 100.91 and showing a strong uptrend on the daily chart (ADX 32.38), this provides a fundamental tailwind for USDJPY. A stronger dollar typically translates to higher USDJPY, as it reflects a more favorable economic outlook or higher interest rate expectations in the US compared to Japan. The DXY's RSI at 71.75 also signals overbought conditions, mirroring the USDJPY chart, implying that both the dollar's strength and the pair's rally might be nearing a point of consolidation or correction. However, as long as the DXY holds its upward trajectory and stays above key support levels, it will continue to lend support to USDJPY.
Correlating USDJPY's movements with broader market sentiment is also crucial. The S&P 500 (SP500) is trading at 6572.87, showing a positive daily change, but the Nasdaq 100 (Nasdaq100) has seen a notable dip to 30046.89. This mixed picture in equities suggests that while risk appetite isn't collapsing, there might be some sector-specific weakness or profit-taking, particularly in tech. A significant risk-off event, potentially driven by geopolitical tensions or unexpected economic data, could see investors flocking to safe-haven assets. While USDJPY has been on an uptrend, its correlation with risk sentiment can be complex. Historically, a strong yen can act as a safe haven, but the current interest rate differential heavily favors the dollar, making USDJPY more sensitive to US economic data and Fed policy expectations than broad risk sentiment.
Looking at the energy markets, Brent crude is at $81.18 and WTI at $78.39, both showing upward momentum. Rising oil prices can feed into inflation expectations, potentially influencing central bank policies. If inflation concerns resurface, it could lead to expectations of tighter monetary policy from the Federal Reserve, further supporting the dollar and USDJPY. Conversely, if oil price gains are seen as purely demand-driven, it might not significantly alter the Fed's calculus in the short term. The current geopolitical landscape, with events in the Strait of Hormuz and global energy security discussions, means oil prices remain a key indicator to watch for broader economic stability and inflationary pressures.
The Japanese Yen's own fundamental drivers are also at play. The Bank of Japan (BoJ) has maintained an ultra-loose monetary policy, keeping interest rates at extremely low levels. This policy divergence, with the Fed potentially signaling a longer-than-expected period of higher rates, creates a significant interest rate differential that favors the dollar against the yen. This differential is a primary engine behind the USDJPY's upward trend. Any hint from the BoJ about a potential shift in policy, however subtle, could trigger a sharp reaction in USDJPY, but current indications suggest policy divergence will persist, supporting the bullish case for USDJPY in the medium term.
The Bull's Roadmap: Pushing Towards $163.29
For USDJPY to continue its ascent, several conditions need to be met. The immediate hurdle is breaking decisively above the $161.644 resistance on the 1-hour chart and then tackling the $161.954 level identified on the daily chart. A successful breach of $161.954, ideally on increased volume and with a positive RSI reading above 70, would signal a continuation of the bullish trend. The next key resistance target would be the $162.549 level, followed by the psychological barrier at $163.296. Invalidation of this bullish scenario would occur if the price fails to break above $161.954 and instead falls back below the $161.05 support level on the 1H chart, or more significantly, closes below the $160.972 support on the 4H chart. The ADX on the daily chart at 32.38 suggests the trend is strong enough to potentially sustain such a move if key resistance breaks.
Where Bears Take Control: A Test of $160.97
The bearish scenario for USDJPY hinges on the pair's inability to overcome the immediate resistance levels and the potential for profit-taking or a shift in market sentiment. If USDJPY fails to break above $161.954 and instead retreats, the first level of support to watch would be $161.496 on the 1H chart, followed by $161.398 on the 4H chart. A more significant breakdown would occur below the $161.05 support, potentially triggering a move towards the $160.972 level. If price closes below $160.972, the bearish case gains considerable traction, with targets then extending down to the $160.612 support on the daily chart. This thesis would be invalidated if the price manages to sustain a close above $161.954, especially if coupled with RSI moving out of overbought territory without a significant MACD crossover against the bulls. The current strong trend (ADX 32.38 daily) suggests that a bearish reversal would likely require a significant catalyst.
The Waiting Game: Consolidation Around $161.42
A neutral scenario, or consolidation, is also plausible, especially given the mixed signals from oscillators like Stochastic and RSI across different timeframes. If USDJPY remains range-bound, it would likely consolidate between the immediate support at $161.05 and resistance at $161.954. This phase could be characterized by choppy price action, lower trading volumes, and indicators oscillating without clear directional conviction. Such a period might precede a more significant move, allowing oscillators to reset from their current extreme readings. For instance, if RSI pulls back from overbought levels without triggering a bearish MACD crossover, and Stochastic finds support before crossing back up, the market could be building energy for the next directional push. Key levels to watch for this consolidation phase would be the $161.398 (4H support) and $161.496 (1H resistance) levels. This scenario becomes less likely if a strong catalyst emerges, such as unexpected central bank policy shifts or major geopolitical events.
Bullish Scenario: Riding the Wave Above $161.95
60% ProbabilityBearish Scenario: Profit-Taking Pullback to $160.97
30% ProbabilityNeutral Scenario: Range-Bound Consolidation
10% ProbabilityThe current technical setup for USDJPY suggests a bullish bias, but with significant caution warranted due to overbought indicators on longer timeframes. The strong trend indicated by the ADX (38.18 on daily) and the supportive DXY at 100.91 provide a foundation for further upside. However, the RSI (70.1 on daily, 67.14 on 4H) and Stochastic readings across multiple charts are flashing warnings. Therefore, the most probable scenario is a continued bullish trend, but one that may involve consolidation or a short-term pullback before the next significant leg higher. A decisive break above $161.954 would confirm the continuation, while a fall below $161.05 could signal a deeper correction.
What I'm Watching This Week
This week, the primary focus for USDJPY traders will be on how the pair handles the key resistance zone around $161.95. A clear break and sustained hold above this level, particularly on the daily chart, would be a strong bullish signal, potentially opening the door for targets towards $162.55 and $163.30. Conversely, any signs of rejection from this resistance, coupled with a DXY pullback or negative shifts in equity markets, could lead to a downside move. Watch for price action around the $161.05 support level as a critical barometer; a break below this could signal a deeper correction. The Federal Reserve's upcoming commentary and any shifts in interest rate expectations will be paramount. Additionally, any unexpected policy adjustments from the Bank of Japan, though unlikely in the short term, would be a major catalyst to monitor.
| Indicator | Value | Signal | Interpretation |
|---|---|---|---|
| RSI (14) | 67.14 | Neutral | Approaching overbought on 4H, overbought on 1D. Bullish momentum, but caution advised. |
| MACD Histogram | +0.065 | Bullish | Positive momentum on 1H and 4H, suggesting upward pressure. |
| Stochastic | K=62.55, D=65.35 | Bearish Crossover Risk | Potential bearish crossover forming on 4H chart; overbought on 1H. |
| ADX | 38.18 | Strong Trend | Confirms a strong existing trend, likely bullish given other indicators. |
| Bollinger Bands | Middle Band | Above | Price trading above the middle band on 4H, indicating bullish bias. |
Frequently Asked Questions: USDJPY Analysis
What happens if USDJPY breaks above the $161.954 resistance level?
A sustained break above $161.954, confirmed by daily RSI moving above 70 and MACD maintaining positive momentum, would likely target the next resistance at $162.549. This would solidify the bullish trend, indicating further upside potential towards $163.296.
Should I consider buying USDJPY at current levels near $161.42 given the RSI at 67.14?
Buying at current levels carries a moderate risk due to the 4H RSI at 67.14 and 1H Stochastic in overbought territory. A more prudent approach might be to wait for a minor pullback towards $161.05 support or confirmation of a decisive break above $161.954. The probability of a short-term pullback is elevated.
Is the RSI at 67.14 on the 4H chart a definitive sell signal for USDJPY?
An RSI of 67.14 is not a definitive sell signal but rather indicates strong bullish momentum approaching overbought conditions. While it suggests caution and potential for consolidation or a pullback, the overall trend (ADX 38.18) remains strong. Confirmation from other indicators or a price action reversal would be needed for a sell signal.
How will the DXY's strength at 100.91 and upcoming Fed commentary affect USDJPY this week?
The DXY's strength at 100.91 provides a supportive backdrop for USDJPY. If upcoming Fed commentary reinforces a hawkish stance or delayed rate cuts, it could further boost the dollar and push USDJPY towards its resistance targets. Conversely, dovish remarks could trigger a dollar pullback and a USDJPY correction.
Track markets in real-time
AI-powered analysis, technical indicators and real-time price data.
Join Our Telegram Channel
Breaking market news, AI analysis and trading signals instantly.
Join Channel