EURUSD today analysis reveals a critical juncture as the pair approaches the significant resistance level at $1.15062. This pivotal moment comes as market sentiment shifts, driven by a strengthening US Dollar Index (DXY) and nuanced expectations surrounding the Federal Reserve's next moves. The interplay between these forces creates a complex picture for the Euro, demanding a close examination of both technical indicators and broader macroeconomic drivers.
- RSI at 47.65 on the 1H chart signals potential downward pressure, while the 1D RSI at 35.32 indicates a further bearish lean.
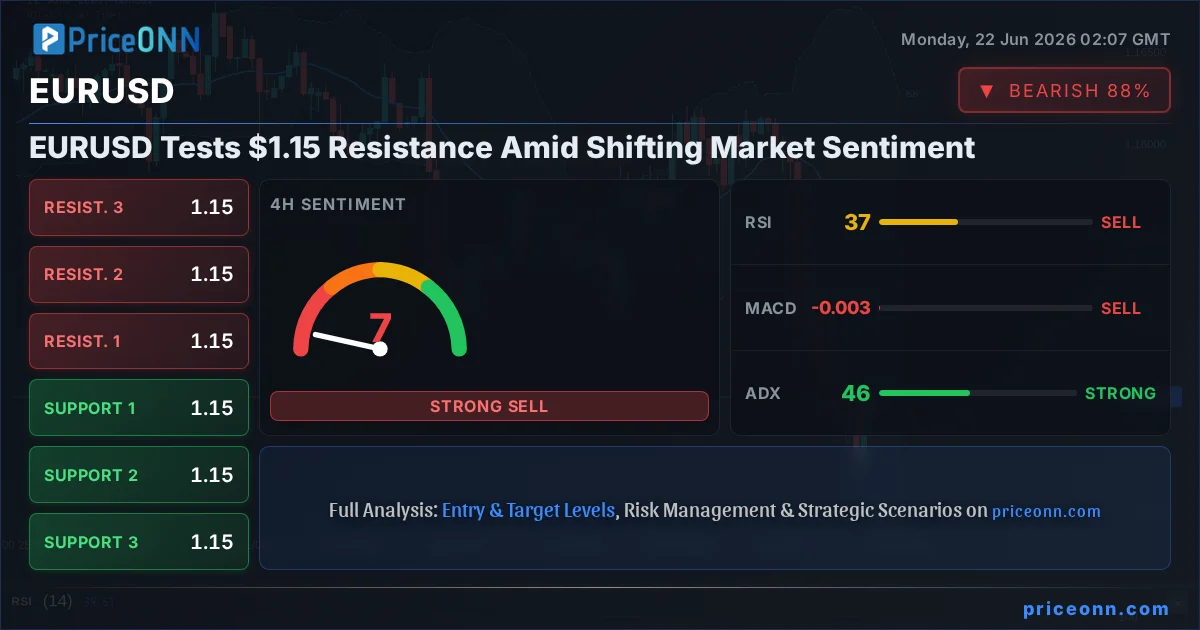
- The key resistance level to watch is $1.15062, with immediate support found at $1.14649 on the 4-hour chart.
- DXY's strength at 100.9 is a significant headwind for EURUSD, suggesting continued dollar dominance in the near term.
- The prevailing trend on the 4H and 1D charts is bearish, with strong ADX readings reinforcing this outlook.
Navigating the $1.15062 Confluence Point
The EURUSD currency pair is currently locked in a tense battleground around the $1.15 level, a price point that has historically acted as a significant magnet for market participants. As of the latest data feed, EURUSD is trading at $1.14639, with immediate resistance looming at $1.15062. This level is not just a psychological barrier; it represents a confluence of technical factors that could dictate the pair's short-to-medium term trajectory. The 1-hour chart shows resistance at $1.14688, $1.14718, and crucially $1.14778, while the 4-hour chart points to stronger resistance barriers at $1.14779, $1.14854, and $1.14909. The daily chart, however, highlights a more distant but significant resistance at $1.15062, $1.15554, and $1.15832. Understanding which of these levels holds will be paramount for traders looking to navigate this indecisive market.
The current price action suggests a market holding its breath. The 1-hour trend is neutral, but the RSI at 47.65 leans towards a bearish sentiment, indicating that sellers might be gaining a slight edge in intraday movements. MACD, while showing positive momentum, is positioned above the signal line, a sign that upward pressure might be present but is not yet dominant. However, the Stochastic Oscillator's %K line is below its %D line at 38.24 vs 43.55, flashing a bearish signal. The ADX at 20.36 points to a moderately trending market, but the overall signal leans towards selling (Al: 2, Sat: 6, Nötr: 0), suggesting caution for any immediate bullish plays.
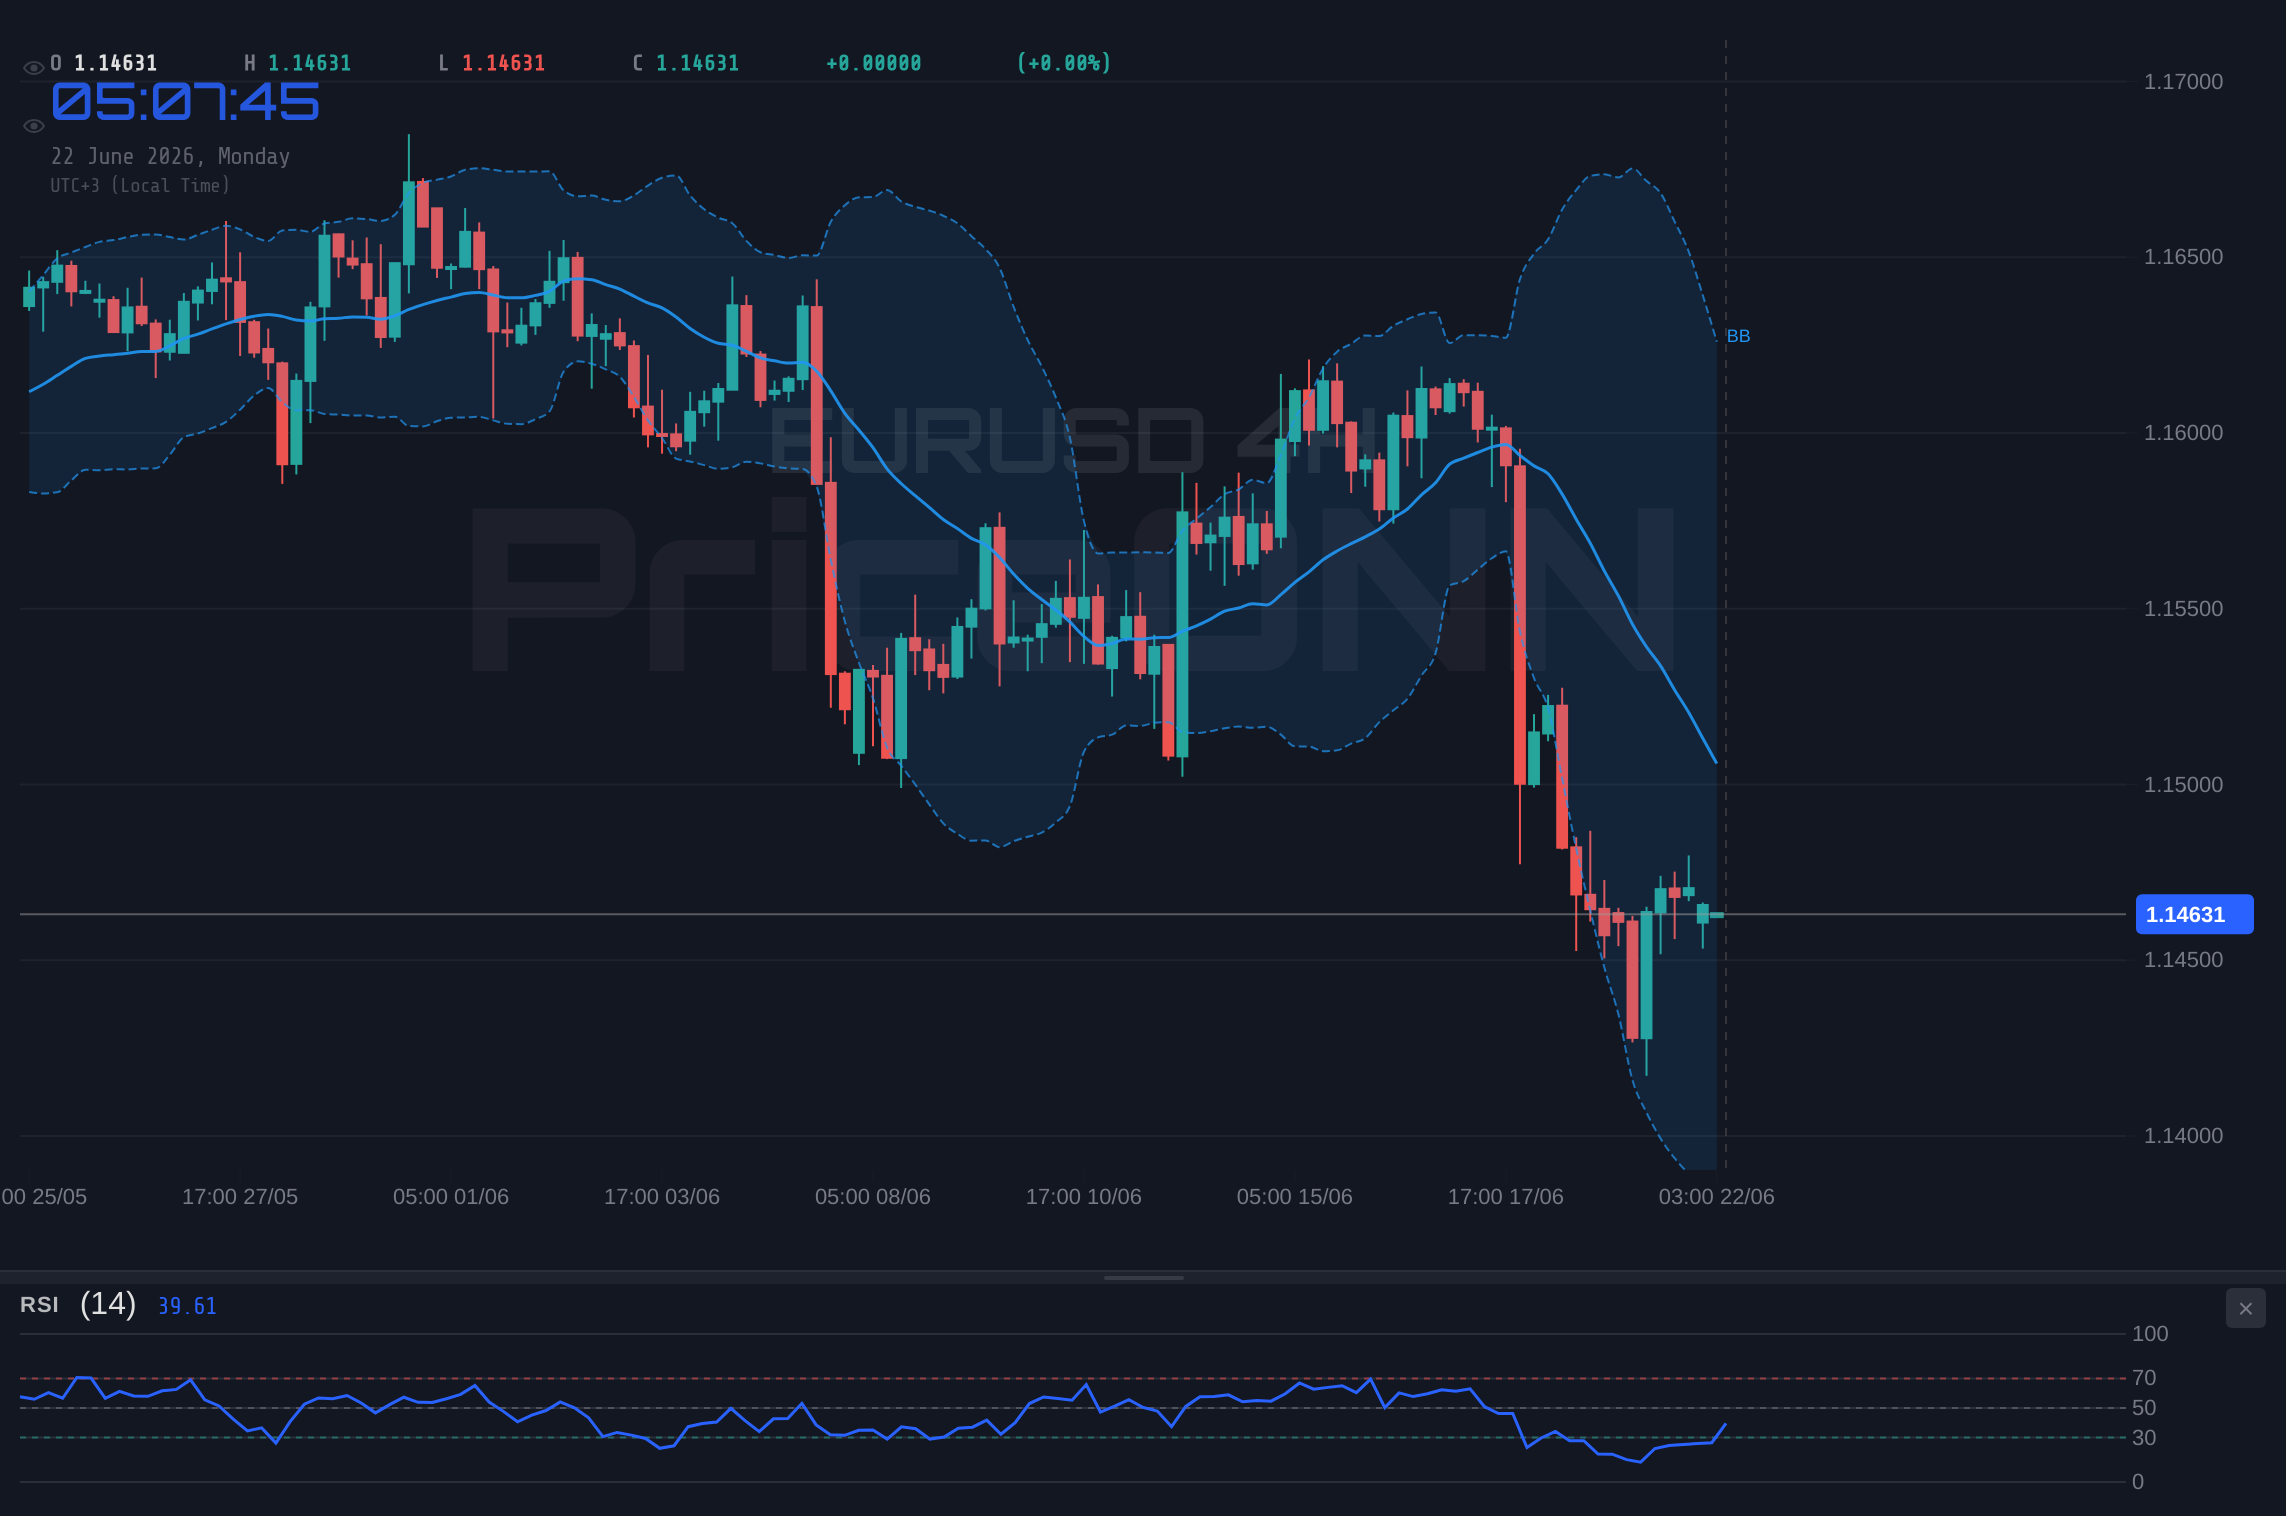
Digging deeper into the 4-hour timeframe, the picture becomes clearer. The trend remains neutral, but the indicators paint a more decisively bearish outlook. The RSI at 37.18 reinforces the downward pressure, well within the neutral-to-oversold territory. MACD is firmly in negative momentum territory, below its signal line, and the Bollinger Bands are showing the price hugging the lower band, indicating potential for further downside. The Stochastic K% at 64.15 and D% at 36.25 presents a conflicting bullish signal, but this is overshadowed by the ADX at 45.76, which signifies a strong, established downtrend. The overwhelming 'SAT' signal (Al: 1, Sat: 7, Nötr: 0) on this timeframe warrants significant attention.
Extending the analysis to the daily chart, the bearish sentiment intensifies. The trend is definitively classified as 'Düşüş' (Downtrend) with a strength of 83%. The RSI at 35.32 continues the theme of bearish momentum, sitting comfortably in the neutral zone but trending downwards. MACD remains negative, and the price is trading below the middle Bollinger Band, signaling a bearish inclination. The Stochastic K% at 14.61 and D% at 40.52 offers a strong bearish signal, confirming the downward bias. The ADX at 25.41 indicates a strong trend is in play. With a unanimous 'SAT' (Sell) signal across all indicators (Al: 0, Sat: 8, Nötr: 0), the daily outlook for EURUSD is undeniably bearish, suggesting that any rallies towards the $1.15062 resistance might be opportunities for sellers.
The Dollar's Dominance: DXY and its Shadow
The overarching narrative for EURUSD cannot be told without acknowledging the strength of the US Dollar Index (DXY). Currently trading at 100.9, the DXY is exhibiting a strong upward trend across all observed timeframes (1H, 4H, 1D), with ADX readings consistently above 30, signaling robust trending conditions. On the daily chart, the DXY RSI is at 71.64, firmly in overbought territory, which might suggest a near-term pullback. However, the overall momentum remains bullish, supported by positive MACD readings and price action above the middle Bollinger Band. This dollar strength acts as a significant headwind for EURUSD, as a stronger dollar typically implies weaker performance for the Euro, especially when the Eurozone faces its own economic headwinds.
The correlation between DXY and EURUSD is a critical aspect for traders to monitor. Historically, a rising DXY often pressures EURUSD downwards. The current DXY price at 100.9, coupled with its strong upward trend, provides a fundamental backdrop that supports the bearish technical signals seen in EURUSD. While the DXY's RSI is elevated, indicating potential for a short-term correction, the underlying trend strength, as indicated by the ADX at 32.38, suggests that any dollar weakness might be temporary. This dynamic implies that even if EURUSD manages a short-lived rally towards $1.15062, the persistent strength of the dollar could cap upside potential.
Broader Market Context: Equities and Oil
The sentiment in global equity markets also plays a crucial role in shaping the EURUSD outlook. The S&P 500, currently at 6572.87, shows a mixed picture: a strong 1-hour and 4-hour bullish trend signals (Al: 5, Al: 6 respectively), but the daily chart presents a bearish trend (Al: 2, Sat: 5). This indecision in the equity markets can translate into volatility for currency pairs. The Nasdaq 100, at 30288.63, exhibits a more consistent bullish trend on the 1H and 4H charts, but also shows a bearish signal on the daily timeframe. This divergence between intraday strength and daily weakness in major US indices suggests a cautious risk environment. In such conditions, safe-haven assets might see increased demand, potentially benefiting the US dollar further at the expense of the Euro.
Oil prices, particularly Brent crude at $78.87, are currently in a downtrend on the daily chart, with RSI deep in oversold territory (27.99). This downtrend in oil prices could signal cooling inflation expectations, which might influence central bank policy. If inflation fears subside, it could reduce the urgency for aggressive monetary tightening by central banks, potentially impacting currency valuations. For the Eurozone, lower energy prices could alleviate some inflationary pressures, but the overall economic picture remains complex, influenced heavily by geopolitical factors and the ECB's policy stance. The recent news regarding energy security, such as India rethinking its energy strategy due to Hormuz crisis and Equinor expanding its Troll field, highlights the ongoing global energy market dynamics that indirectly affect currency markets through inflation and geopolitical risk premiums.
Geopolitical Undercurrents and Policy Expectations
Geopolitical tensions, particularly those affecting energy supply routes like the Strait of Hormuz, continue to cast a shadow over global markets. While news suggests Iraq is maintaining its Syria oil route even if Hormuz reopens, the underlying vulnerability of energy supplies remains a constant risk factor. Such geopolitical instability can bolster demand for safe-haven assets, including the US dollar, thereby reinforcing the bearish pressure on EURUSD. The G7's coordinated effort to break China's grip on critical minerals also points to a more fragmented global economic landscape, which can lead to increased currency volatility.
On the policy front, the market is keenly watching the Federal Reserve. Recent news indicates that dollar rally faces a defining technical test as Fed repricing reshapes markets, suggesting that expectations around future Fed policy are a primary driver. While the Fed has maintained a hawkish stance, the market is constantly trying to price in the timing and magnitude of potential rate hikes or pauses. Conversely, the European Central Bank (ECB) faces its own set of challenges, balancing inflation concerns with growth prospects in the Eurozone. Any divergence in central bank policy directions between the Fed and the ECB will likely have a pronounced impact on EURUSD. Given the current DXY strength and the bearish technical signals on EURUSD, the market seems to be pricing in continued Fed hawkishness or at least a slower pivot compared to the ECB.
Scenario Analysis: Charting the Paths Forward
Given the current technical setup and market conditions, three primary scenarios emerge for EURUSD. The most probable path, supported by daily and 4-hour indicators, leans bearish. However, the intraday charts and the RSI's position offer glimpses of potential counter-trend moves or consolidation periods.
Bearish Scenario: The Dollar's Grip Tightens
65% ProbabilityNeutral Scenario: Range-Bound Consolidation
25% ProbabilityBullish Scenario: A Brief Reprieve?
10% ProbabilityThe most likely scenario, given the overwhelming bearish signals on the 4-hour and daily charts, is a continuation of the downtrend. The strong ADX values across these timeframes suggest that momentum is firmly behind the sellers. A trigger for this scenario would be a decisive break below the immediate 4-hour support at $1.14649. If this level gives way, the path towards the next daily support at $1.14292 opens up. The invalidation for this bearish thesis would be a sustained move above the more immediate 1-hour resistance at $1.14778, suggesting a temporary shift in intraday dynamics.
A neutral scenario, where EURUSD trades within a defined range, is also plausible, especially if upcoming economic data provides conflicting signals or if market participants await clearer direction from central banks. This would likely see price action confined between the intraday support at $1.14508 and resistance at $1.14778. This range-bound environment could persist until a significant catalyst forces a breakout. The probability assigned to this scenario reflects the current indecisiveness seen on the 1-hour chart, despite the stronger bearish bias on longer timeframes.
The bullish scenario, while having the lowest probability (10%), cannot be entirely dismissed. A strong catalyst, such as surprisingly dovish commentary from the Fed or a significant geopolitical event that spooks the dollar, could trigger a move higher. The trigger for this scenario would be a firm break and hold above the 4-hour resistance at $1.14909. If this occurs, the next targets would be the daily resistance levels at $1.15554 and potentially $1.15832. However, the current technical picture makes this the least likely outcome in the short term.
What I'm Watching: Key Triggers for EURUSD
The immediate future of EURUSD will likely be dictated by a few key levels and events. Firstly, the $1.14649 support on the 4-hour chart is crucial. A break below this level could accelerate the bearish trend towards $1.14292. Conversely, holding this support and pushing back towards the $1.14778-$1.14909 resistance zone will be the first test for any potential bullish reversal. Secondly, the strength of the DXY remains a primary driver. Any signs of significant weakness in the dollar index, perhaps due to unexpected Fed signals or a shift in global risk sentiment, could provide a reprieve for EURUSD.
Finally, upcoming economic data releases will be critical. While specific events were not detailed in the provided context, traders will be scrutinizing any news related to inflation, employment, and central bank policy from both the US and the Eurozone. For instance, if US inflation data comes in softer than expected, it could dampen Fed hawkishness and provide a window for EURUSD to recover. Conversely, stronger-than-expected Eurozone data might offer a boost, though the current technical headwinds suggest such a move would likely face immediate selling pressure.
Frequently Asked Questions: EURUSD Analysis
What happens if EURUSD breaks below the $1.14649 support level?
A break below $1.14649 on the 4-hour chart would likely trigger further selling pressure, confirming the bearish trend. The next key support level to target would be $1.14519, with a deeper move towards $1.14292 on the daily chart being probable.
Should I consider buying EURUSD at current levels around $1.14639 given the mixed intraday signals?
Buying at current levels carries significant risk due to the strong bearish signals on longer timeframes and the looming resistance at $1.14778-$1.14909. A more prudent approach would be to wait for confirmation of a bullish reversal, such as a sustained break above $1.14909, or for price to retest lower support levels with signs of buyer accumulation.
Is the RSI at 35.32 on the daily chart a sell signal for EURUSD?
An RSI of 35.32 on the daily chart indicates that EURUSD is in the neutral-to-bearish territory and trending downwards. While not yet oversold, it supports the prevailing bearish sentiment and suggests that any upward retracements are likely to face selling pressure, aligning with the overall bearish outlook.
How will the strong DXY at 100.9 affect EURUSD in the coming week?
The strong DXY at 100.9 is a significant headwind for EURUSD, reinforcing the bearish bias. Unless there is a clear shift in Fed policy expectations or a major geopolitical event driving safe-haven flows away from the dollar, the dollar's strength is likely to keep EURUSD under pressure, potentially capping rallies towards $1.15062.
The path forward for EURUSD appears challenging, with prevailing technical indicators and the strong dollar signaling downside risks. However, market dynamics are fluid, and shifts in central bank policy or geopolitical events could quickly alter the landscape. For now, patience and risk management remain paramount. Traders should closely monitor the key levels discussed, particularly the $1.14649 support and the $1.15062 resistance, for decisive signals.
Technical Outlook Summary
| Indicator | Value | Signal | Interpretation |
|---|---|---|---|
| RSI (14) | 47.65 | Neutral | Leans bearish on 1H, strongly bearish on 1D. |
| MACD Histogram | 0.00068 | Neutral | Mixed signals across timeframes, but overall momentum is weak. |
| Stochastic | 38.24 / 43.55 | Bearish | Bearish crossover on 1H, supports downside. |
| ADX | 20.36 | Moderate Trend | Indicates trend presence, stronger on longer timeframes. |
| Bollinger Bands | Middle Band | Bearish | Price below middle band on 4H/1D, suggesting downside. |
Key Levels
Track markets in real-time
AI-powered analysis, technical indicators and real-time price data.
Join Our Telegram Channel
Breaking market news, AI analysis and trading signals instantly.
Join Channel