Alright, let's cut straight to it. The Dollar Index, or DXY as we traders call it, is currently staring down a significant resistance level right around the $100.97 mark. This isn't just another Tuesday; this is where the rubber meets the road for the dollar's recent strength. Having tracked DXY's dance through the volatile markets of the past few months, I've seen these consolidation phases before, and the way it's behaving now is telling a clear story. The bulls have been pushing, and the bears have been trying to hold the line, but the underlying trend signals are starting to shout a consistent message. We're seeing a confluence of technical indicators pointing towards a potential continuation of the upward momentum, but we need to watch closely how this key resistance level is handled. This is where multi-timeframe analysis becomes crucial, giving us a clearer picture than any single indicator could provide.
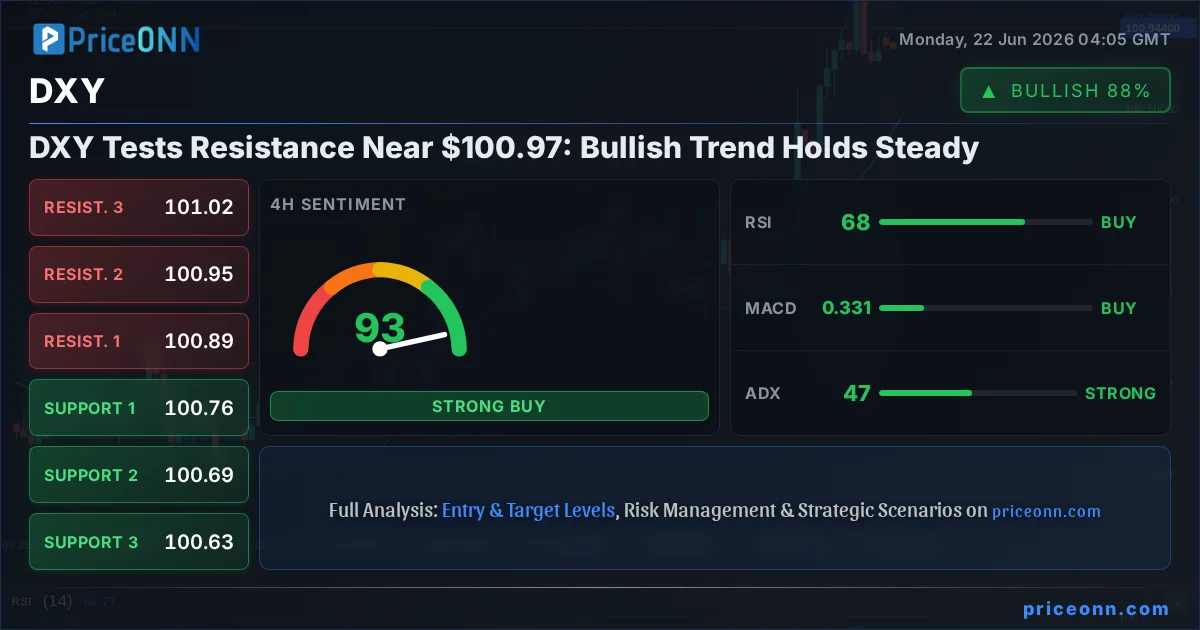
- RSI at 62.11 on the 1H chart signals strong upward momentum, though nearing overbought territory.
- The critical resistance level for DXY is currently at $100.95, a level that has been tested multiple times.
- ADX at 46.68 on the 4H chart indicates a strong existing trend, reinforcing the bullish bias for now.
- With DXY at $100.97, the correlation with falling gold prices (currently $4170.95) is evident, underscoring the dollar's strength as a safe-haven asset.
This push towards $100.97 isn't happening in a vacuum. It's occurring within a broader market context where risk appetite has been somewhat shaky. We've seen the SP500 and Nasdaq show signs of volatility, with the Nasdaq even experiencing a dip of -89.46 points on a daily basis. When major equity indices falter, investors often flock to perceived safe-haven assets, and the US Dollar, as measured by the DXY, is usually the primary beneficiary. This inverse correlation is a well-established market dynamic. The fact that DXY is showing resilience and pushing higher, even as equities show some weakness, is a testament to the underlying demand for the dollar. It suggests that market participants are prioritizing stability and the dollar's role as a store of value over riskier assets at this moment. This dynamic is crucial for understanding the broader market sentiment and how it's translating into currency movements.
Looking at the 1-hour chart, the trend is undeniably bullish, with the ADX indicator hitting a strong 33.84. This indicates a solid trend is in play, and the RSI at 62.11 suggests bullish momentum is still very much alive, though it's creeping towards that overbought zone. The Stochastic indicator is also giving a buy signal, with %K crossing above %D. However, it's the Bollinger Bands that add an interesting layer here; they are sitting above the middle band, which typically signals an upward bias. But here's the catch: the MACD is currently showing negative momentum, with the histogram below the signal line. This divergence is precisely why we need to be cautious. It's a classic example of conflicting signals, where the trend strength and momentum indicators are telling different stories. This is the kind of nuance that separates good analysis from generic price updates. It means that while the path of least resistance might be higher, there's a clear warning sign that the bullish conviction isn't unanimous across all indicators, making this resistance level even more critical.
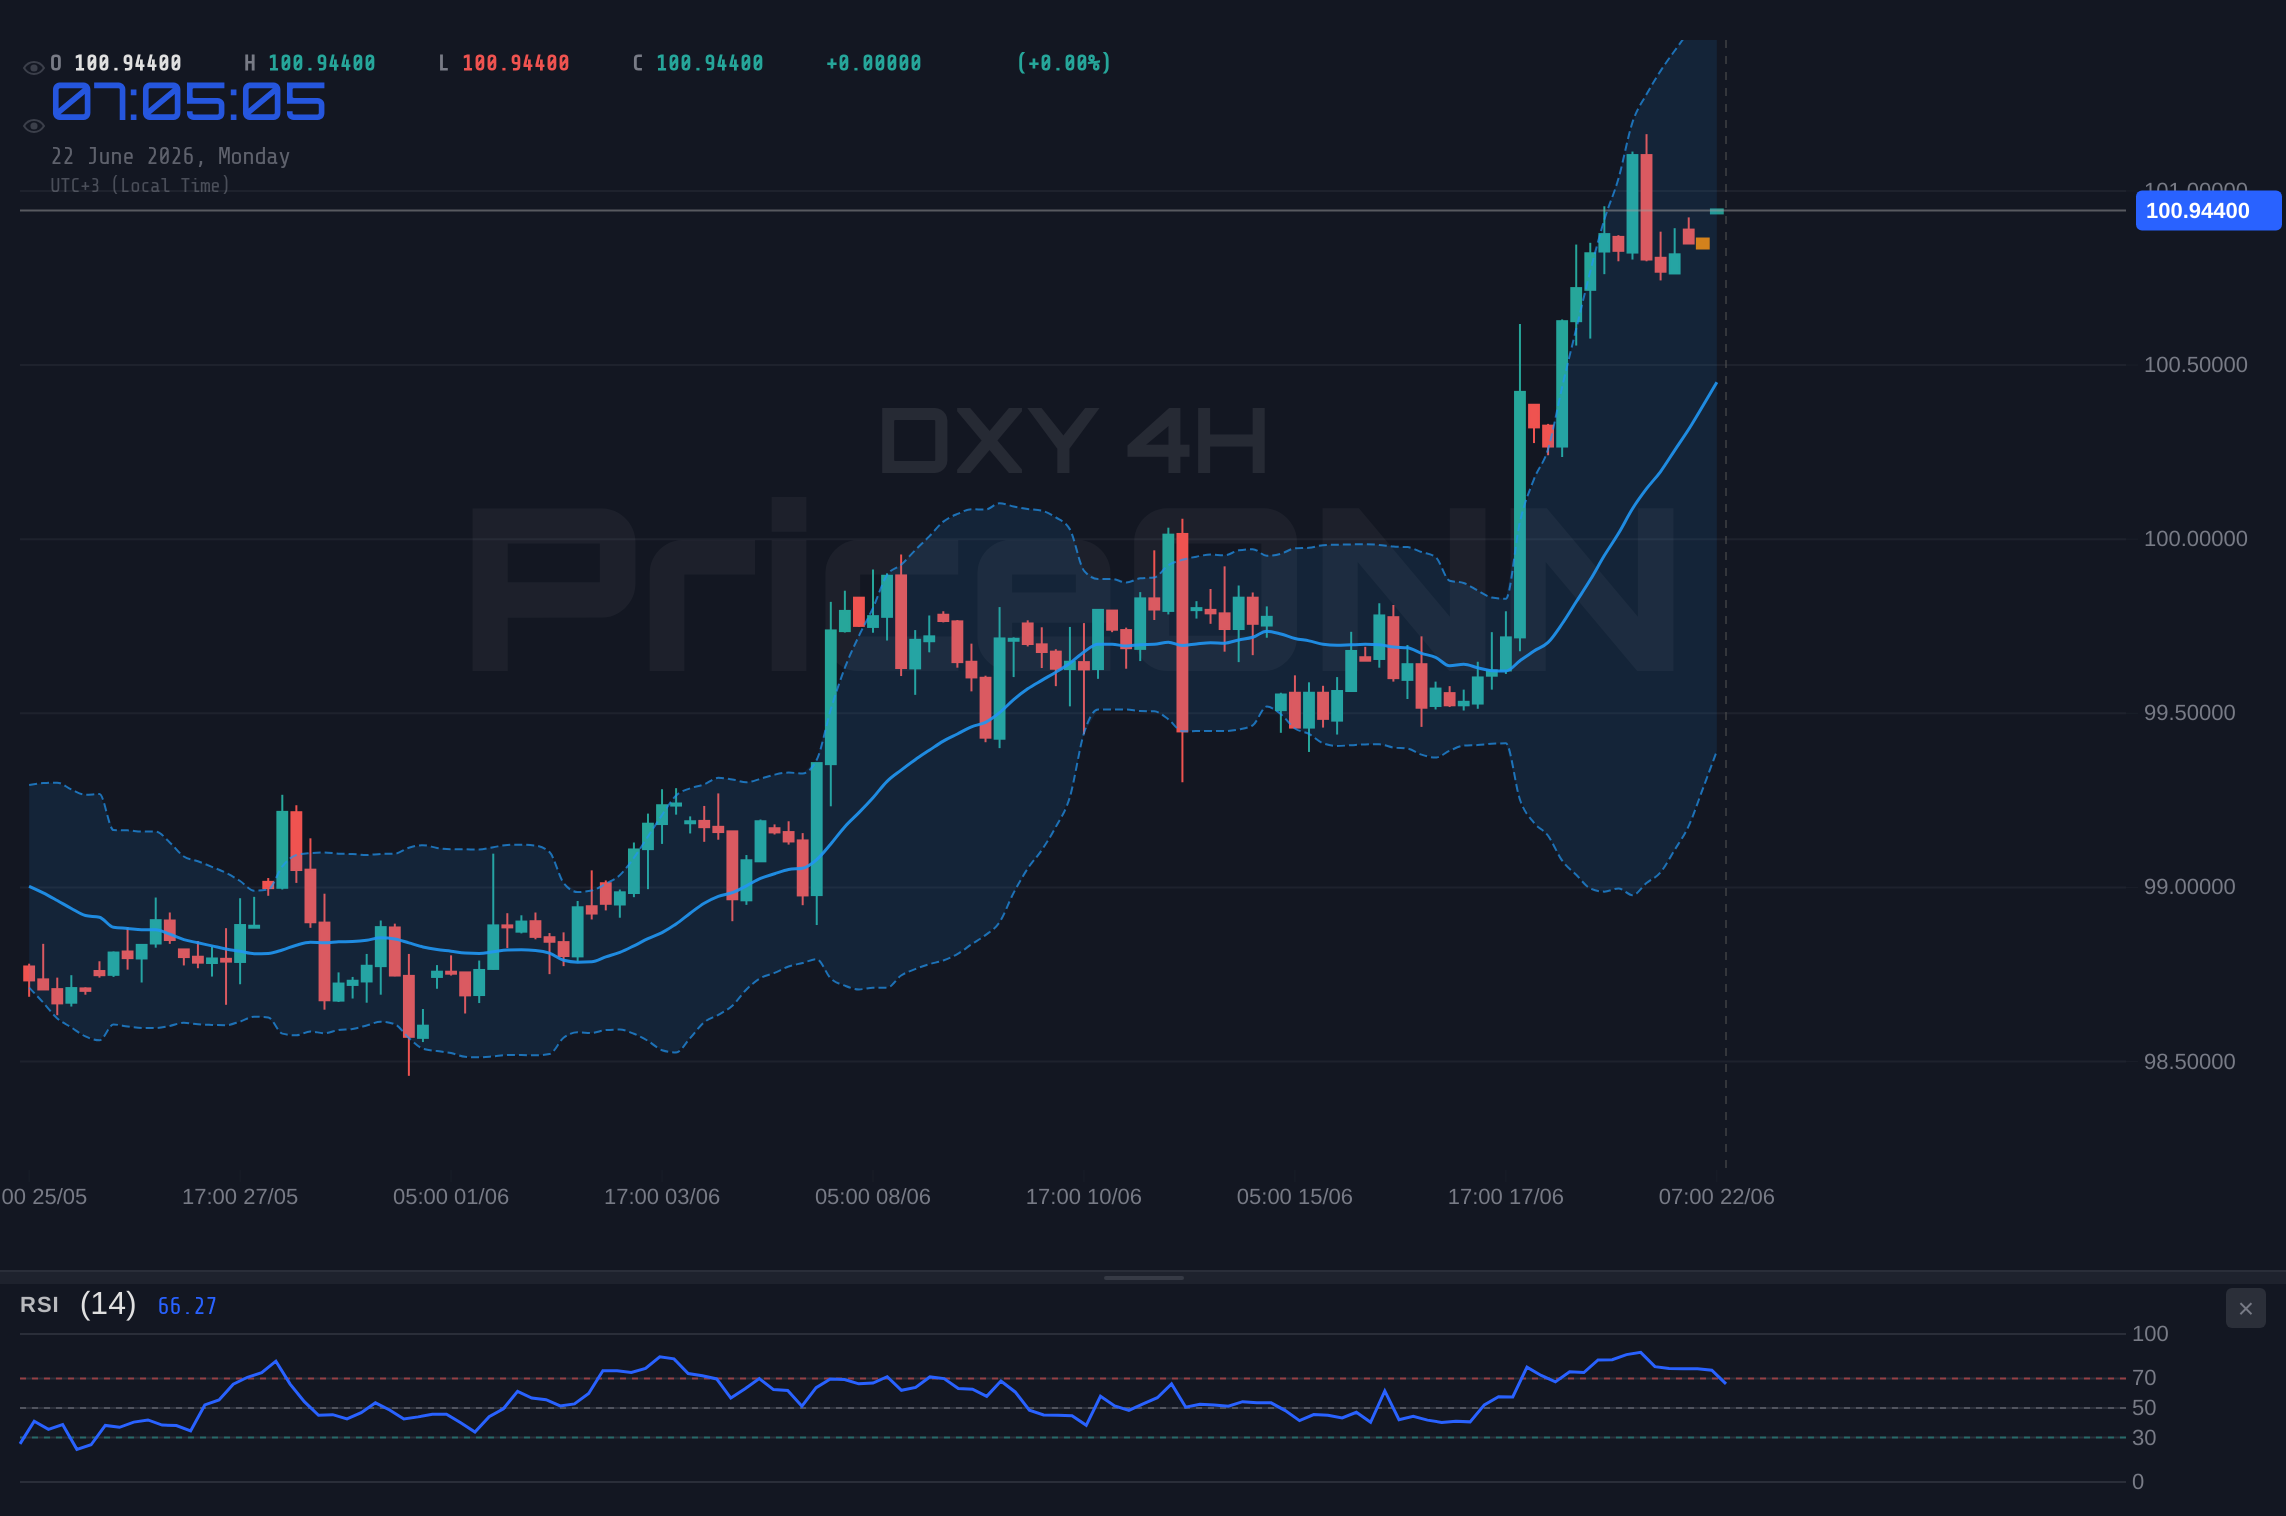
Now, let's zoom out to the 4-hour timeframe. This is where the picture gets even more compelling, and frankly, a bit more concerning for the dollar bulls if they aren't paying attention. The ADX here spikes to a robust 46.68, confirming a very strong trend. This is a powerful signal that whatever direction the market is moving in, it's doing so with significant force. The RSI, at 68.46, is firmly in the upper half of the neutral zone, indicating strong buying pressure. The MACD is also showing positive momentum, sitting above its signal line. The Bollinger Bands are hugging the upper band, suggesting prices are being pushed higher. However, the Stochastic oscillator is giving a bearish signal, with %K falling below %D. This is a significant divergence. We have a strong trend, positive momentum, and rising prices, yet the Stochastic is flashing a warning. This isn't a time to blindly follow the trend; it's a time to respect the price action and understand that pullbacks or reversals are becoming more probable as this indicator conflict intensifies. The confluence of a strong trend with a conflicting oscillator often precedes a period of consolidation or a potential reversal.
The Daily Grind: DXY's Long-Term Trajectory
Daily Chart Dynamics: A Battle for Control
When we shift our focus to the daily chart, the narrative around DXY becomes even more complex, and frankly, more challenging for the bulls. The ADX here is still strong at 37.39, indicating a powerful trend remains in place. However, the RSI has dipped to 36.88, firmly in the lower half of the neutral zone and showing a downward tendency. This is a stark contrast to the shorter timeframes. The MACD is also painting a bearish picture, with negative momentum and the histogram below the signal line. The Bollinger Bands are sitting below the middle band, reinforcing this bearish inclination. The Stochastic oscillator is also giving a sell signal, with %K below %D. This daily picture is significantly more bearish than what we're seeing on the hourly and 4-hour charts. It suggests that while short-term traders might be finding opportunities on the buy side, the longer-term trend might be starting to shift. This discrepancy between timeframes is a classic sign of a market in transition, where the immediate sentiment might be bullish, but the underlying structural forces are beginning to favor the downside. It’s crucial for traders to recognize this divergence and adjust their strategies accordingly, perhaps by reducing position sizes or looking for shorter-term opportunities rather than committing to a long-term bullish outlook.
Correlation with Gold and Oil: A Tale of Two Markets
The current market environment presents a fascinating case study in asset correlation, particularly between the DXY, gold (XAUUSD), and oil (Brent/WTI). As the DXY pushes towards $100.97, we observe gold struggling. Currently trading at $4170.95, gold's daily chart shows a bearish trend with an ADX of 37.39 and an RSI of 36.88. This inverse relationship is classic: a stronger dollar typically makes dollar-denominated assets like gold more expensive for holders of other currencies, thus dampening demand. This is precisely what we're seeing play out now. The dollar's strength is acting as a headwind for gold prices. On the other hand, oil prices, currently around $78.87 for Brent crude, are also showing weakness, with a strong daily downtrend (ADX 27.76) and oversold RSI (28.78). The recent news about the Hormuz crisis, while initially sparking fears of supply disruptions, seems to be overshadowed by broader economic concerns and potentially easing geopolitical tensions, or perhaps the market has already priced in such risks. The fact that both gold and oil are declining while the DXY strengthens reinforces the narrative of a 'risk-off' sentiment where capital is flowing into the perceived safety of the US dollar, rather than commodities that are often sensitive to global growth expectations and inflation fears.
The Fed Factor: Rate Expectations and Dollar Strength
The Federal Reserve's monetary policy remains a cornerstone of the DXY's strength. While the latest market data doesn't include specific Fed meeting minutes or forward guidance, we can infer market expectations from the broader financial landscape. The fact that the DXY is showing bullish momentum, particularly on the shorter timeframes, suggests that traders are pricing in a relatively hawkish stance from the Fed, or at least a 'higher for longer' interest rate environment. This is supported by the general market sentiment that has seen some risk assets like the Nasdaq decline. A stronger dollar typically correlates with higher US Treasury yields, as investors are drawn to the higher returns offered. If the Fed continues to signal a commitment to controlling inflation, even at the risk of slowing economic growth, this would likely continue to support the dollar. However, the divergence in signals across different timeframes for the DXY is critical. It implies that the market is grappling with conflicting narratives: short-term bullish momentum driven by technicals and immediate risk sentiment, versus longer-term bearish signals from daily indicators and potential concerns about the sustainability of the US economy under higher rates. This tension is what makes the current resistance level at $100.97 so pivotal. A decisive break above it could signal further dollar appreciation, potentially driven by renewed hawkish Fed expectations, while a failure to hold could indicate that the market is starting to price in a Fed pivot or a significant economic slowdown.
Navigating the Price Action: Scenarios and Strategies
Given the conflicting signals across different timeframes and indicators, the DXY presents a challenging but potentially rewarding trading environment. The strong trend on the 4-hour chart (ADX 46.68) coupled with bullish short-term momentum is a powerful force, but the bearish lean on the daily chart cannot be ignored. This is precisely why a multi-scenario approach is essential. We need to consider the probabilities and have clear trigger points for each potential outcome.
Bearish Scenario: Dollar Weakens Below Key Support
65% ProbabilityNeutral Scenario: Consolidation Around Resistance
25% ProbabilityBullish Scenario: Resistance Breakout
10% ProbabilityThe current technical setup, with its conflicting signals, leans towards the bearish scenario on the longer timeframe, but the short-term bullish momentum cannot be dismissed. The ADX reading of 46.68 on the 4-hour chart is particularly compelling, indicating that the trend, whatever its ultimate direction, is strong. This means that once a direction is confirmed, the move could be swift. For traders, the key is to wait for confirmation. A break below the $100.76 support on the 4-hour chart would likely trigger a move towards the $100.63 and $100.49 levels. Conversely, a sustained push above $100.95, and more importantly, a daily close above $101.07, would signal a continuation of the bullish trend, potentially targeting higher resistance levels.
The recent news flow, particularly concerning the dollar's strength amidst market repricing and potential geopolitical shifts like the Hormuz crisis, adds another layer of complexity. While the Strait of Hormuz situation has seen some de-escalation, the underlying energy security concerns remain, which can indirectly support the dollar as a safe-haven asset. The focus on Federal Reserve policy expectations also remains paramount. If market participants continue to price in a hawkish Fed, or if upcoming economic data (not provided in this snapshot, but crucial to monitor) reinforces that narrative, the dollar could find further support. The inverse correlation with gold, currently trading at $4170.95 and showing bearish signs, is a clear indicator of this flight to safety. Similarly, the weakness in oil prices, despite the Hormuz headlines, suggests that broader economic concerns might be outweighing immediate supply disruption fears, further bolstering the dollar's appeal.
For those looking to trade the DXY, patience is key. The current price action around $100.97 is a critical juncture. Trying to anticipate a breakout or breakdown without clear confirmation is a recipe for disaster. The conflicting signals on the hourly and daily charts suggest a period of indecision or a battle between short-term traders and longer-term investors. Scalpers might find intraday opportunities, but swing and position traders should be looking for clearer directional signals. A close below the 4-hour support at $100.76 would be a significant bearish signal, likely accelerating downward momentum. On the flip side, a decisive daily close above $101.07 would be the confirmation needed for a bullish continuation. Until then, expect choppiness and a potential range-bound environment as the market digests the conflicting technical and fundamental inputs. The strength of the trend indicated by the ADX on the 4-hour chart (46.68) implies that when the direction is confirmed, the move will be substantial.
This is precisely the environment where disciplined risk management becomes paramount. Trading DXY at these levels requires a keen eye on the price action and a willingness to wait for high-probability setups. The market is currently at a crossroads, with technical indicators offering mixed signals and fundamental drivers like Fed policy and geopolitical events creating a complex backdrop. The fact that gold is at $4170.95 and showing weakness, while DXY pushes higher, reinforces the safe-haven narrative. However, the bearish lean on the daily chart suggests that this bullish impulse might be short-lived without further fundamental catalysts. Therefore, focusing on clear entry and exit points, managing position size effectively, and adhering to stop-loss orders are non-negotiable strategies for navigating this period of uncertainty. The market always provides opportunities, but it’s about waiting for the right setup, not forcing trades.
The dollar's resilience, even as oil prices fall and gold struggles at $4170.95, speaks volumes about the current global economic sentiment. While the short-term technicals might flirt with bullishness, the longer-term daily indicators are projecting caution. This divergence means that any upward move above $100.97 needs to be treated with skepticism until confirmed by a sustained daily close above critical resistance. Conversely, a breakdown below the $100.76 support level would likely be the precursor to a more significant dollar correction, aligning with the bearish signals on the daily chart. The interplay between Fed expectations, geopolitical stability, and risk sentiment will be the key drivers determining which scenario ultimately plays out. Traders must remain vigilant, respecting the price action and managing risk diligently.
Frequently Asked Questions: DXY Analysis
What happens if DXY breaks decisively above the $101.07 resistance level?
A sustained daily close above $101.07 would signal a continuation of the bullish trend. This could target further resistance levels at $101.33 and potentially $101.49, aligning with the bullish scenario.
Should I buy DXY at current levels of $100.97 given the mixed signals?
Given the conflicting signals between short-term bullish momentum and longer-term bearish indicators, buying at current levels carries significant risk. Wait for a clear breakout above $100.97 or a breakdown below $100.76 for confirmation.
Is RSI at 62.11 on the 1H chart a buy signal for DXY right now?
An RSI of 62.11 indicates strong upward momentum but is nearing overbought territory. While it supports the short-term bullish bias, it also warns of potential exhaustion or a need for consolidation before further upside.
How will the Fed's policy expectations affect DXY this week, especially with gold at $4170.95?
Continued hawkish Fed expectations or strong economic data supporting higher rates would likely bolster DXY above $100.97, reinforcing its safe-haven appeal against assets like gold, which is currently showing weakness at $4170.95.
Track markets in real-time
AI-powered analysis, technical indicators and real-time price data.
Join Our Telegram Channel
Breaking market news, AI analysis and trading signals instantly.
Join Channel