The Australian dollar is finding itself at a critical juncture, teetering precariously around the $0.69998 mark against its US counterpart. This isn't just another round number; it's a psychological and technical battleground where the forces of a strengthening US dollar, shifting risk appetite, and diverging central bank outlooks are clashing. Having tracked AUDUSD through its recent price action, it's clear that the momentum is leaning bearish, but the real question is whether this is a prelude to a more significant downturn or just a pause before the next move. The current technical setup on multiple timeframes suggests caution, with several indicators flashing warning signs for the bulls.
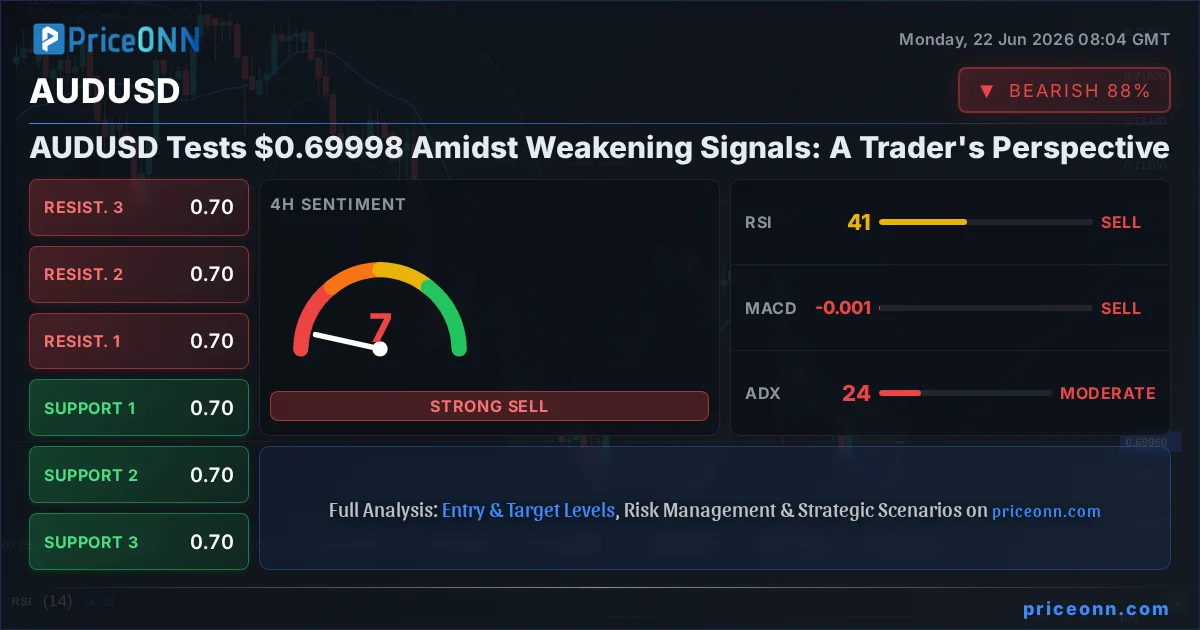
- AUDUSD is currently trading near the crucial $0.69998 level, showing signs of bearish pressure.
- The US Dollar Index (DXY) is strengthening, currently at 101.04, which typically puts pressure on pairs like AUDUSD.
- Technical indicators such as RSI at 40.04 (1H) and 38.7 (1D) suggest a bearish bias, indicating room for further downside.
- The ADX reading of 7.93 on the 1H chart indicates a weak trend, suggesting potential for consolidation or a lack of strong directional conviction, but the 1D ADX at 31.53 points to a stronger downtrend.
Navigating the Currents: The Dollar's Dominance
The relentless march of the US Dollar Index (DXY) is a primary narrative shaping the forex landscape, and AUDUSD is certainly feeling the heat. With the DXY currently trading at 101.04, showing a robust 0.22% daily gain, the greenback is demonstrating a clear upward trajectory. This strength is not occurring in a vacuum; it's often a signal of global risk aversion or a repricing of Federal Reserve policy expectations. When the dollar strengthens, it naturally exerts downward pressure on currency pairs where it is the quote currency, such as AUDUSD. The data shows a strong bullish trend for DXY across 1H and 4H timeframes, with the daily chart also indicating a solid upward trend. This persistent dollar strength makes it an uphill battle for the Australian dollar to find sustainable buying interest.
AUDUSD's Technical Tightrope Walk
Looking at AUDUSD's technicals, the picture is far from bullish. On the 1-hour chart, the RSI is sitting at 40.04, firmly in neutral territory but with a downward lean, suggesting that momentum is not behind the buyers. The MACD histogram is negative, and the MACD line is below its signal line, reinforcing the bearish sentiment. Bollinger Bands are showing the price trading below the middle band, indicating downward pressure. Stochastic oscillators, with K at 16.61 and D at 33.11, are screaming 'oversold' in the short term, but this can persist in a downtrend. The ADX at 7.93 on this timeframe is concerningly low, suggesting a lack of trend strength, which could lead to choppy price action or consolidation. However, the larger timeframe tells a different story.
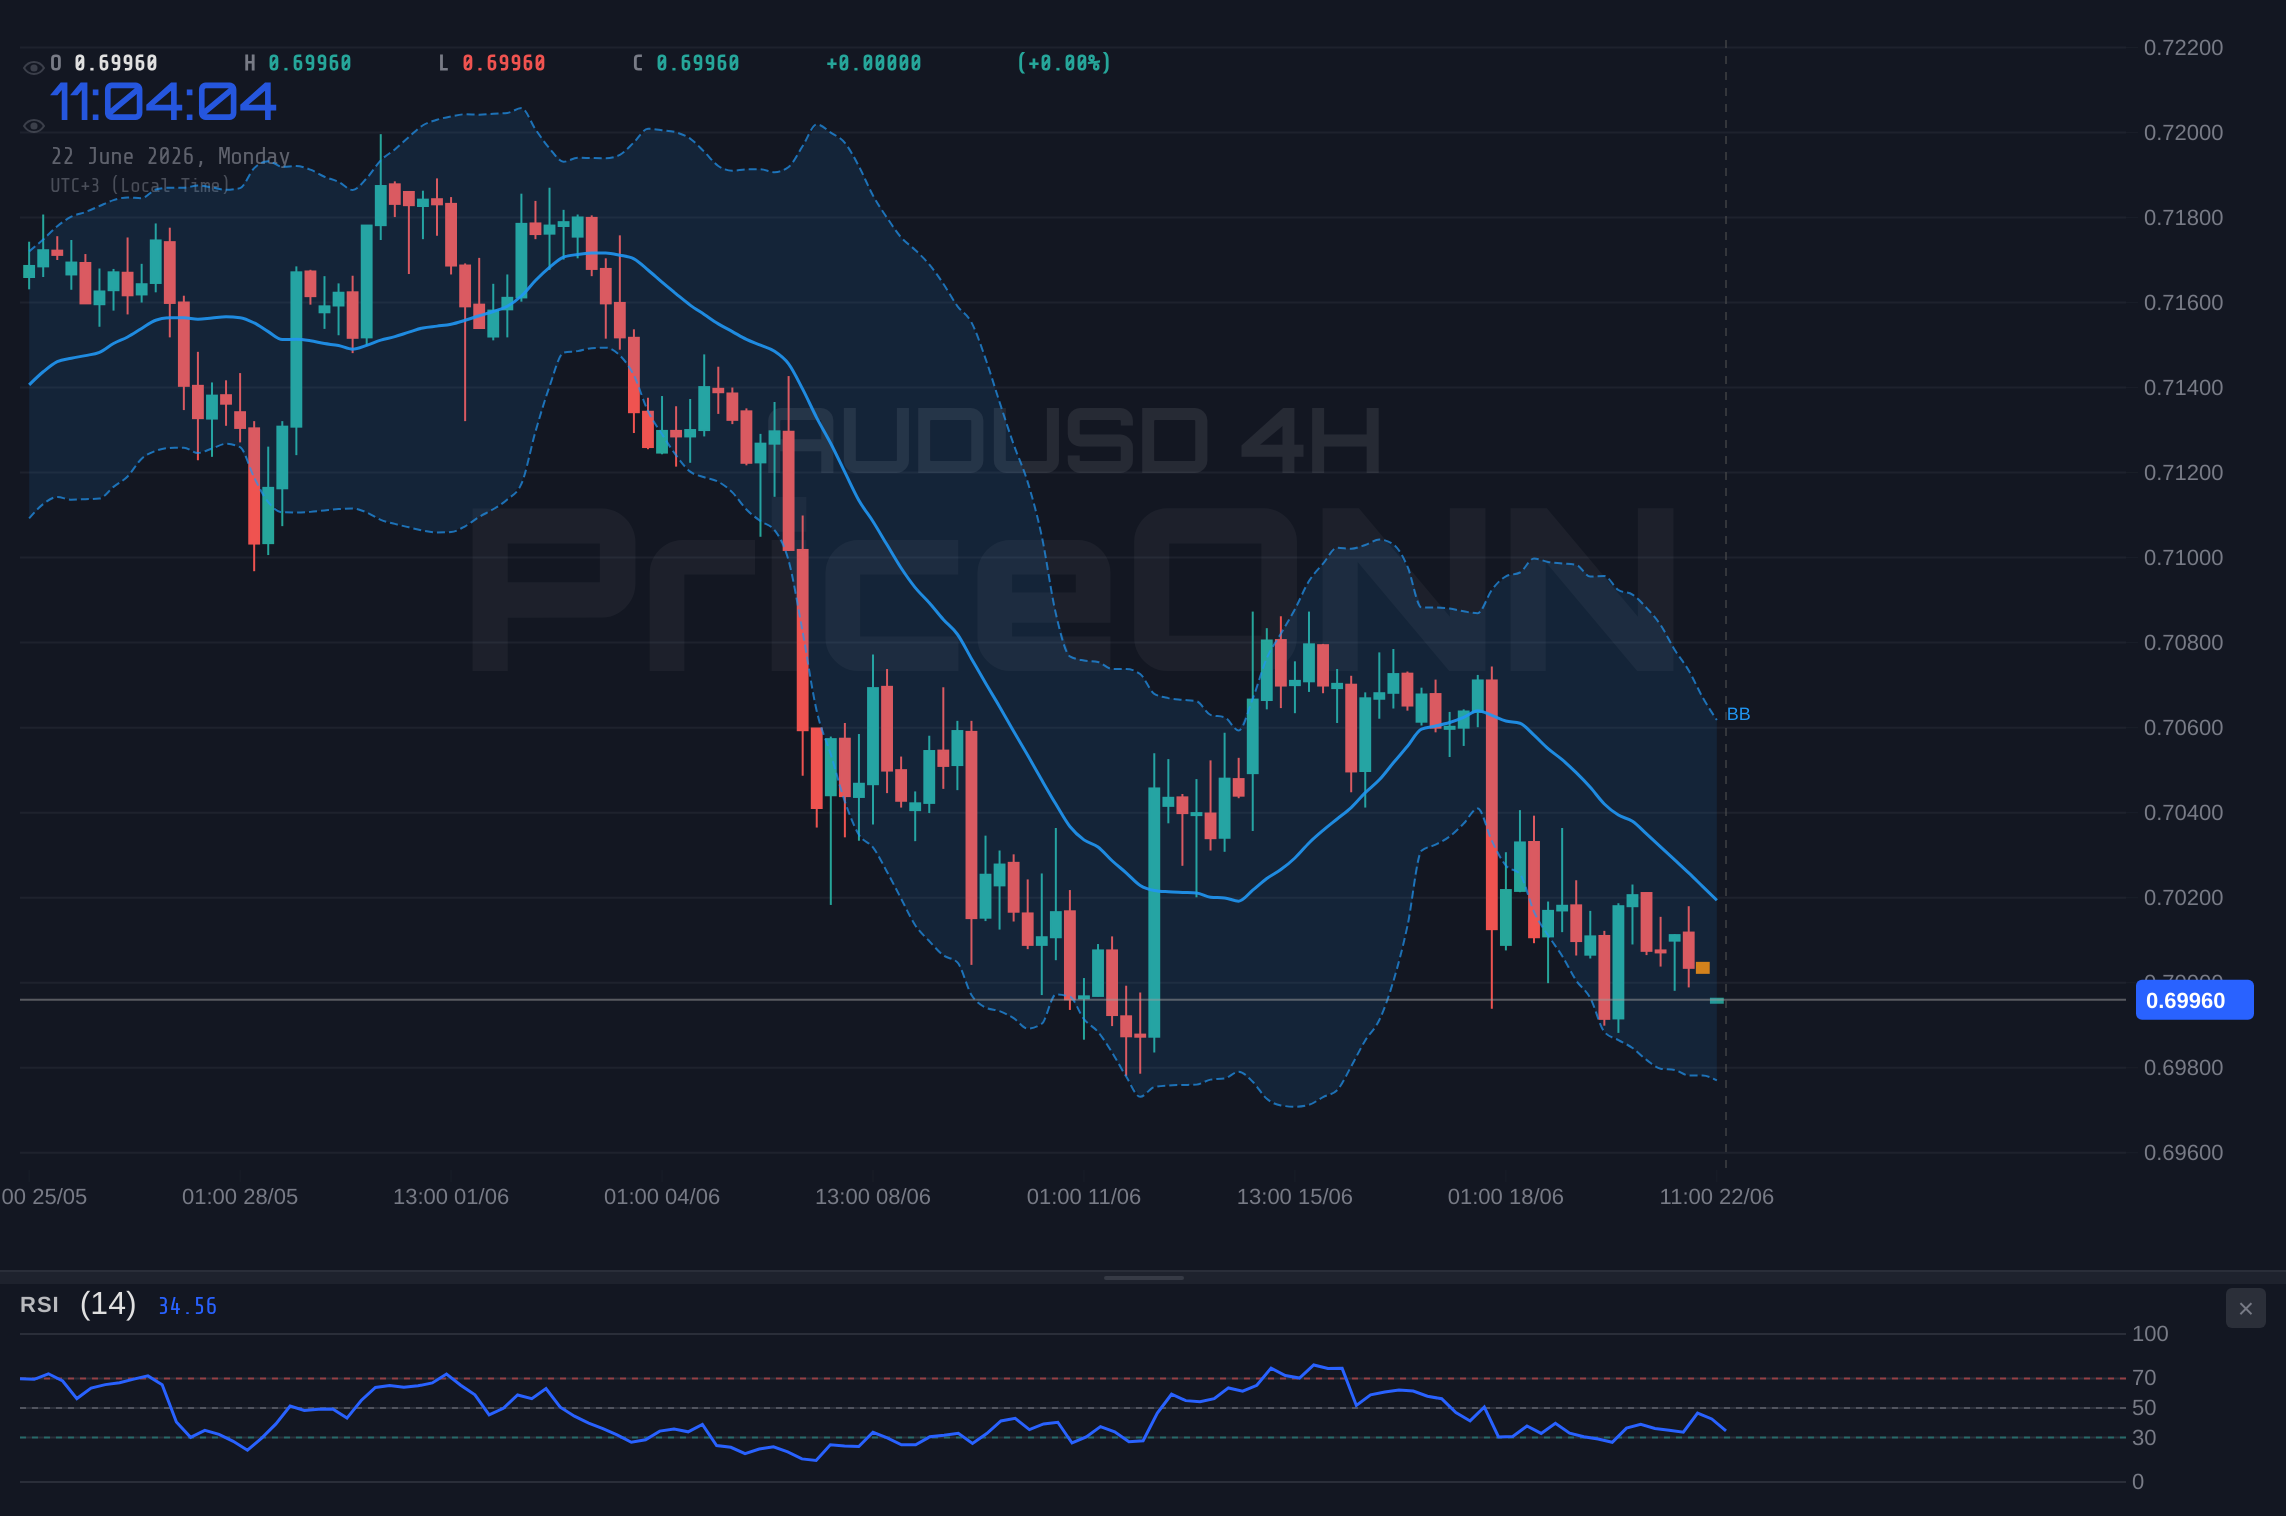
When we shift our gaze to the daily chart, the bearish narrative for AUDUSD becomes more pronounced. The RSI is at 38.7, still in neutral territory but clearly trending downwards, indicating that sellers have more control than buyers over the longer term. The MACD is negative, with the histogram extending below the signal line, confirming bearish momentum. Bollinger Bands are also showing the price hugging the lower band, a sign of bearish pressure. The Stochastic K line at 28.48 and D line at 34.35 suggest a bearish signal, with the K line below the D line, and importantly, not yet in oversold territory, implying further room to fall. The ADX on the daily chart, however, stands at 31.53, indicating a strong downtrend. This divergence between the weak trend on the 1-hour and the strong downtrend on the daily chart is critical; it means that while the short-term might be volatile, the larger picture is decidedly bearish.
Macroeconomic Crosscurrents: RBA vs. Fed and the Inflation Puzzle
The Reserve Bank of Australia (RBA) and the Federal Reserve are on diverging paths, and this is a significant driver for AUDUSD. Recent news suggests that the RBA might be nearing the end of its hiking cycle, or at least pausing, with markets debating whether one final move is still on the table for August. This potential dovish pivot, or at least a less hawkish stance compared to the Fed, can weigh on the Australian dollar. Conversely, the Federal Reserve continues to navigate a complex inflation and employment landscape. While the recent focus has been on potential Fed rate cuts, the persistent inflation data and strong employment figures could force a re-evaluation, keeping the door open for a more hawkish stance. This uncertainty surrounding Fed policy, coupled with the DXY's strength, creates a challenging environment for AUDUSD. The market is keenly watching for any hints from central bank communications that could shift these expectations.
Risk Sentiment: A Shifting Tide
Global risk sentiment plays a crucial role in the performance of currencies like the Australian dollar, which is often seen as a risk-sensitive asset. While there haven't been major global shocks dominating headlines in the last 48 hours, the broader market tone is one of cautiousness. The news about the Strait of Hormuz crisis, while seemingly localized, adds a layer of geopolitical tension that can dampen risk appetite. If tensions escalate, we could see a flight to safety, benefiting the US dollar and potentially hurting the AUD. The recent price action in global equities also provides context. While SP500 and Nasdaq show some daily gains, the underlying trend and the volatility suggest that market participants are not entirely comfortable. A significant downturn in global equities would likely amplify the bearish pressure on AUDUSD.
The Energy Connection: Oil Prices and Inflation Fears
Oil prices, particularly Brent crude, are a key indicator of inflation expectations and geopolitical stability. Brent is currently trading at $79.14, down 1.27% on the day, and WTI at $76.31, down 1.1%. This pullback in oil prices, despite ongoing geopolitical concerns like the Hormuz situation, might suggest a softening of inflation expectations or a temporary easing of supply fears. However, the underlying geopolitical tensions remain a wildcard. Any escalation in the Middle East could quickly send oil prices soaring, reigniting inflation concerns and potentially influencing central bank policy. For AUDUSD, lower oil prices can be a double-edged sword: it might reduce inflationary pressure globally, potentially allowing central banks to adopt a softer stance, but it also affects Australia's export revenues, indirectly impacting the AUD. The current daily trend for both Brent and WTI is clearly down, but the geopolitical backdrop means this could reverse rapidly.
Intermarket Dynamics: What DXY and Equities Tell Us
The correlation between AUDUSD and the DXY is a well-established phenomenon, and the current data reinforces this. As the DXY strengthens, AUDUSD tends to weaken. The bullish trend in DXY across multiple timeframes, currently at 101.04, is a significant headwind for the Aussie. Similarly, the performance of major US indices like the SP500 and Nasdaq provides clues about risk sentiment. While the SP500 is up 0.74% today to 6572.87 and Nasdaq is up 0.37% to 30440.26, the daily trend for SP500 is actually showing a bearish signal on the 1D chart, despite the intraday gains. This suggests that underlying weakness might persist, which, if it materializes into a broader risk-off move, would further support the US dollar and pressure AUDUSD.
Trading Scenarios for AUDUSD Around $0.69998
Given the confluence of bearish technical signals, a strengthening dollar, and mixed risk sentiment, the AUDUSD pair presents a complex trading environment. The key levels to watch are critical. Support is seen at $0.6998, followed by $0.69927 and $0.69887 on the 1-hour chart. Resistance looms at $0.70073, then $0.70113 and $0.70166. On the daily chart, support lies at $0.69894, $0.69713, and $0.69545, while resistance is found at $0.70243, $0.70411, and $0.70592. The $0.7000 psychological level acts as a pivot point.
Bearish Breakdown: AUDUSD Under Pressure
65% ProbabilityConsolidation Around the 0.70 Handle
25% ProbabilityBullish Reversal: A Glimmer of Hope?
10% ProbabilityWhat This Means for Traders Right Now
For traders, the current setup around $0.69998 for AUDUSD calls for a cautious, data-driven approach. The bearish signals on the daily chart are hard to ignore, suggesting that any rallies might be opportunities for short-sellers rather than genuine reversals. The weak ADX on the 1-hour chart implies that short-term trading might be choppy, with potential for quick reversals or range-bound trading. However, the strong ADX on the daily chart points to a more sustained downtrend if key support levels are breached. Patience is paramount here. Waiting for a clear break below the $0.69887 support, confirmed by momentum indicators and sustained dollar strength, could offer a higher-probability short trade. Conversely, a strong move above $0.70113, especially if accompanied by a shift in risk sentiment or a change in Fed expectations, might signal a short-covering rally, but this seems less likely given the current macro backdrop.
Frequently Asked Questions: AUDUSD Analysis
What happens if AUDUSD breaks decisively below the $0.69887 support level?
A break below $0.69887 on the daily chart, confirmed by negative momentum and sustained DXY strength, would likely trigger further selling pressure. This could target the $0.69713 support level, potentially extending towards $0.69545 if the bearish trend continues.
Should I consider shorting AUDUSD at current levels near $0.69998, given the bearish signals?
Entering a short position around $0.69998 requires careful risk management. A more prudent approach would be to wait for a confirmed break below the 1-hour support at $0.6998, or even the daily support at $0.69894. The probability of success increases significantly with confirmation rather than anticipating the move.
Is the RSI at 38.7 on the daily chart a strong sell signal for AUDUSD?
An RSI of 38.7 is not an extreme oversold condition, but it does indicate that the momentum is currently favoring sellers. In the context of a strong downtrend confirmed by ADX at 31.53, this RSI reading suggests there is still room for AUDUSD to decline further before potentially finding significant support.
How will the ongoing DXY strength impact AUDUSD's outlook in the coming week?
The DXY's current bullish trend at 101.04 is a significant headwind for AUDUSD. Unless there's a major shift in Federal Reserve policy expectations or a substantial increase in global risk aversion that benefits other safe havens more, the dollar's strength is likely to continue capping any upside attempts for AUDUSD.
| Indicator | Value | Signal | Interpretation |
|---|---|---|---|
| RSI (14) | 40.04 | Bearish | Neutral territory, downward lean. |
| MACD Histogram | -0.00034 | Bearish | Negative momentum. |
| Stochastic %K | 16.61 | Bearish | Oversold short-term, but not in downtrend. |
| ADX | 7.93 | Neutral | Weak trend on 1H, potential consolidation. |
| Trend (1D) | Downtrend | Bearish | Strong downtrend confirmed by ADX 31.53. |
Track markets in real-time
AI-powered analysis, technical indicators and real-time price data.
Join Our Telegram Channel
Breaking market news, AI analysis and trading signals instantly.
Join Channel