The tug-of-war in the oil markets is palpable as WTI crude oil finds itself testing critical resistance levels around the $78.40 mark. This pivotal juncture isn't just a technical battleground; it's a reflection of the complex interplay between geopolitical undercurrents, shifting central bank policies, and the ever-present fundamental drivers of supply and demand. The question on every trader's mind is whether the current upward momentum can overcome the bearish signals flashing on the indicators, or if this resistance will prove to be the ceiling that sends prices tumbling back down.
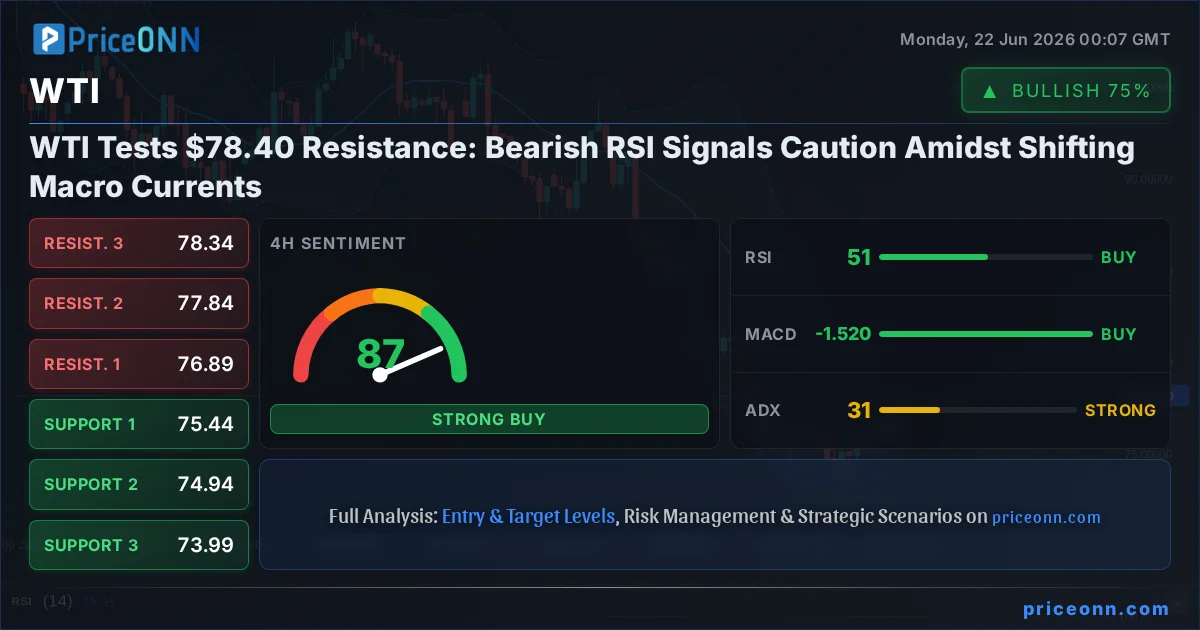
- WTI crude oil is currently trading at $78.40, facing resistance at the upper Bollinger Band on the 1H chart.
- A bearish RSI reading of 67.01 on the 1H timeframe suggests that the upward momentum is losing steam, despite the overall bullish trend signals on the 4H and intraday charts.
- The key support level to watch is $77.69, with further consolidation expected around the $78.45 resistance.
- Geopolitical risks, particularly concerning the Strait of Hormuz and Iraq's energy strategy, remain a significant factor supporting oil prices, even as demand-side concerns linger.
- The Dollar Index (DXY) trading at 100.91, shows a strong upward trend, which typically puts pressure on oil prices.
The energy sector, particularly crude oil, is a barometer for global economic health and geopolitical stability. WTI's current position at $78.40 is more than just a number; it represents a critical inflection point where bulls and bears are locked in a fierce contest. While the intraday charts show a bullish bias, the daily and hourly indicators are beginning to flash warning signs, suggesting that the rally might be running out of steam. Understanding the forces at play - from the delicate balance of OPEC+ production decisions to the broader macroeconomic landscape shaped by central bank policies - is crucial for navigating these choppy waters.
The recent surge in WTI, pushing it towards the $78.40 resistance, has been fueled by a confluence of factors. Geopolitical tensions, particularly in the Middle East, continue to cast a long shadow over supply security. Reports indicate that Iraq is maintaining its oil export routes via Syria, aiming to reduce reliance on the Strait of Hormuz. This strategic diversification, highlighted by recent energy news, underscores the ongoing efforts to ensure stable supply chains in a volatile region. Furthermore, Equinor's expansion of the giant Troll field in the North Sea signifies a broader European hunt for gas and, by extension, a continued focus on energy security, which can indirectly support crude oil prices by signaling robust demand for hydrocarbons amidst the energy transition.
The Bull Case: Momentum and Supply Concerns
On the bullish side of the ledger, the immediate technical picture on the intraday charts for WTI shows strength. The 1H chart indicates a bullish trend with a power score of 95%, supported by a positive MACD momentum and Stochastic %K above %D, signalling potential for further upside. The ADX at 20.75, while not indicating an explosive trend, suggests a developing upward move that could gather pace. The RSI at 70.01, though teetering on the edge of overbought territory, reflects the current buying pressure. This suggests that traders are looking for reasons to push prices higher, perhaps anticipating a breakout above the $78.45 resistance.
The fundamental backdrop also offers some support for the bulls. Despite concerns about global economic growth, the persistent focus on energy security, as evidenced by Equinor's investments and Iraq's strategic oil route planning, suggests that demand for oil products will remain robust in the medium term. The ongoing efforts by G7 nations to counter China's dominance in critical minerals also highlight a global strategic realignment that could have ripple effects on energy markets. While clean energy initiatives are gaining traction, the reality is that fossil fuels remain the backbone of the global economy for the foreseeable future, and any perceived threat to supply, however minor, can trigger a price reaction.
Moreover, the correlation with the Dollar Index (DXY) is worth noting. With the DXY currently at 100.91 and showing a strong upward trend on the 4H and 1D charts, one might expect downward pressure on oil. However, the relationship isn't always inverse, especially when geopolitical risk premiums are driving oil prices higher. The market might be pricing in a scenario where the Fed's hawkish stance, which supports the dollar, also signals economic resilience or inflation concerns that ultimately bolster oil demand or supply risk premiums.
The Bear Case: Technical Warnings and Macro Headwinds
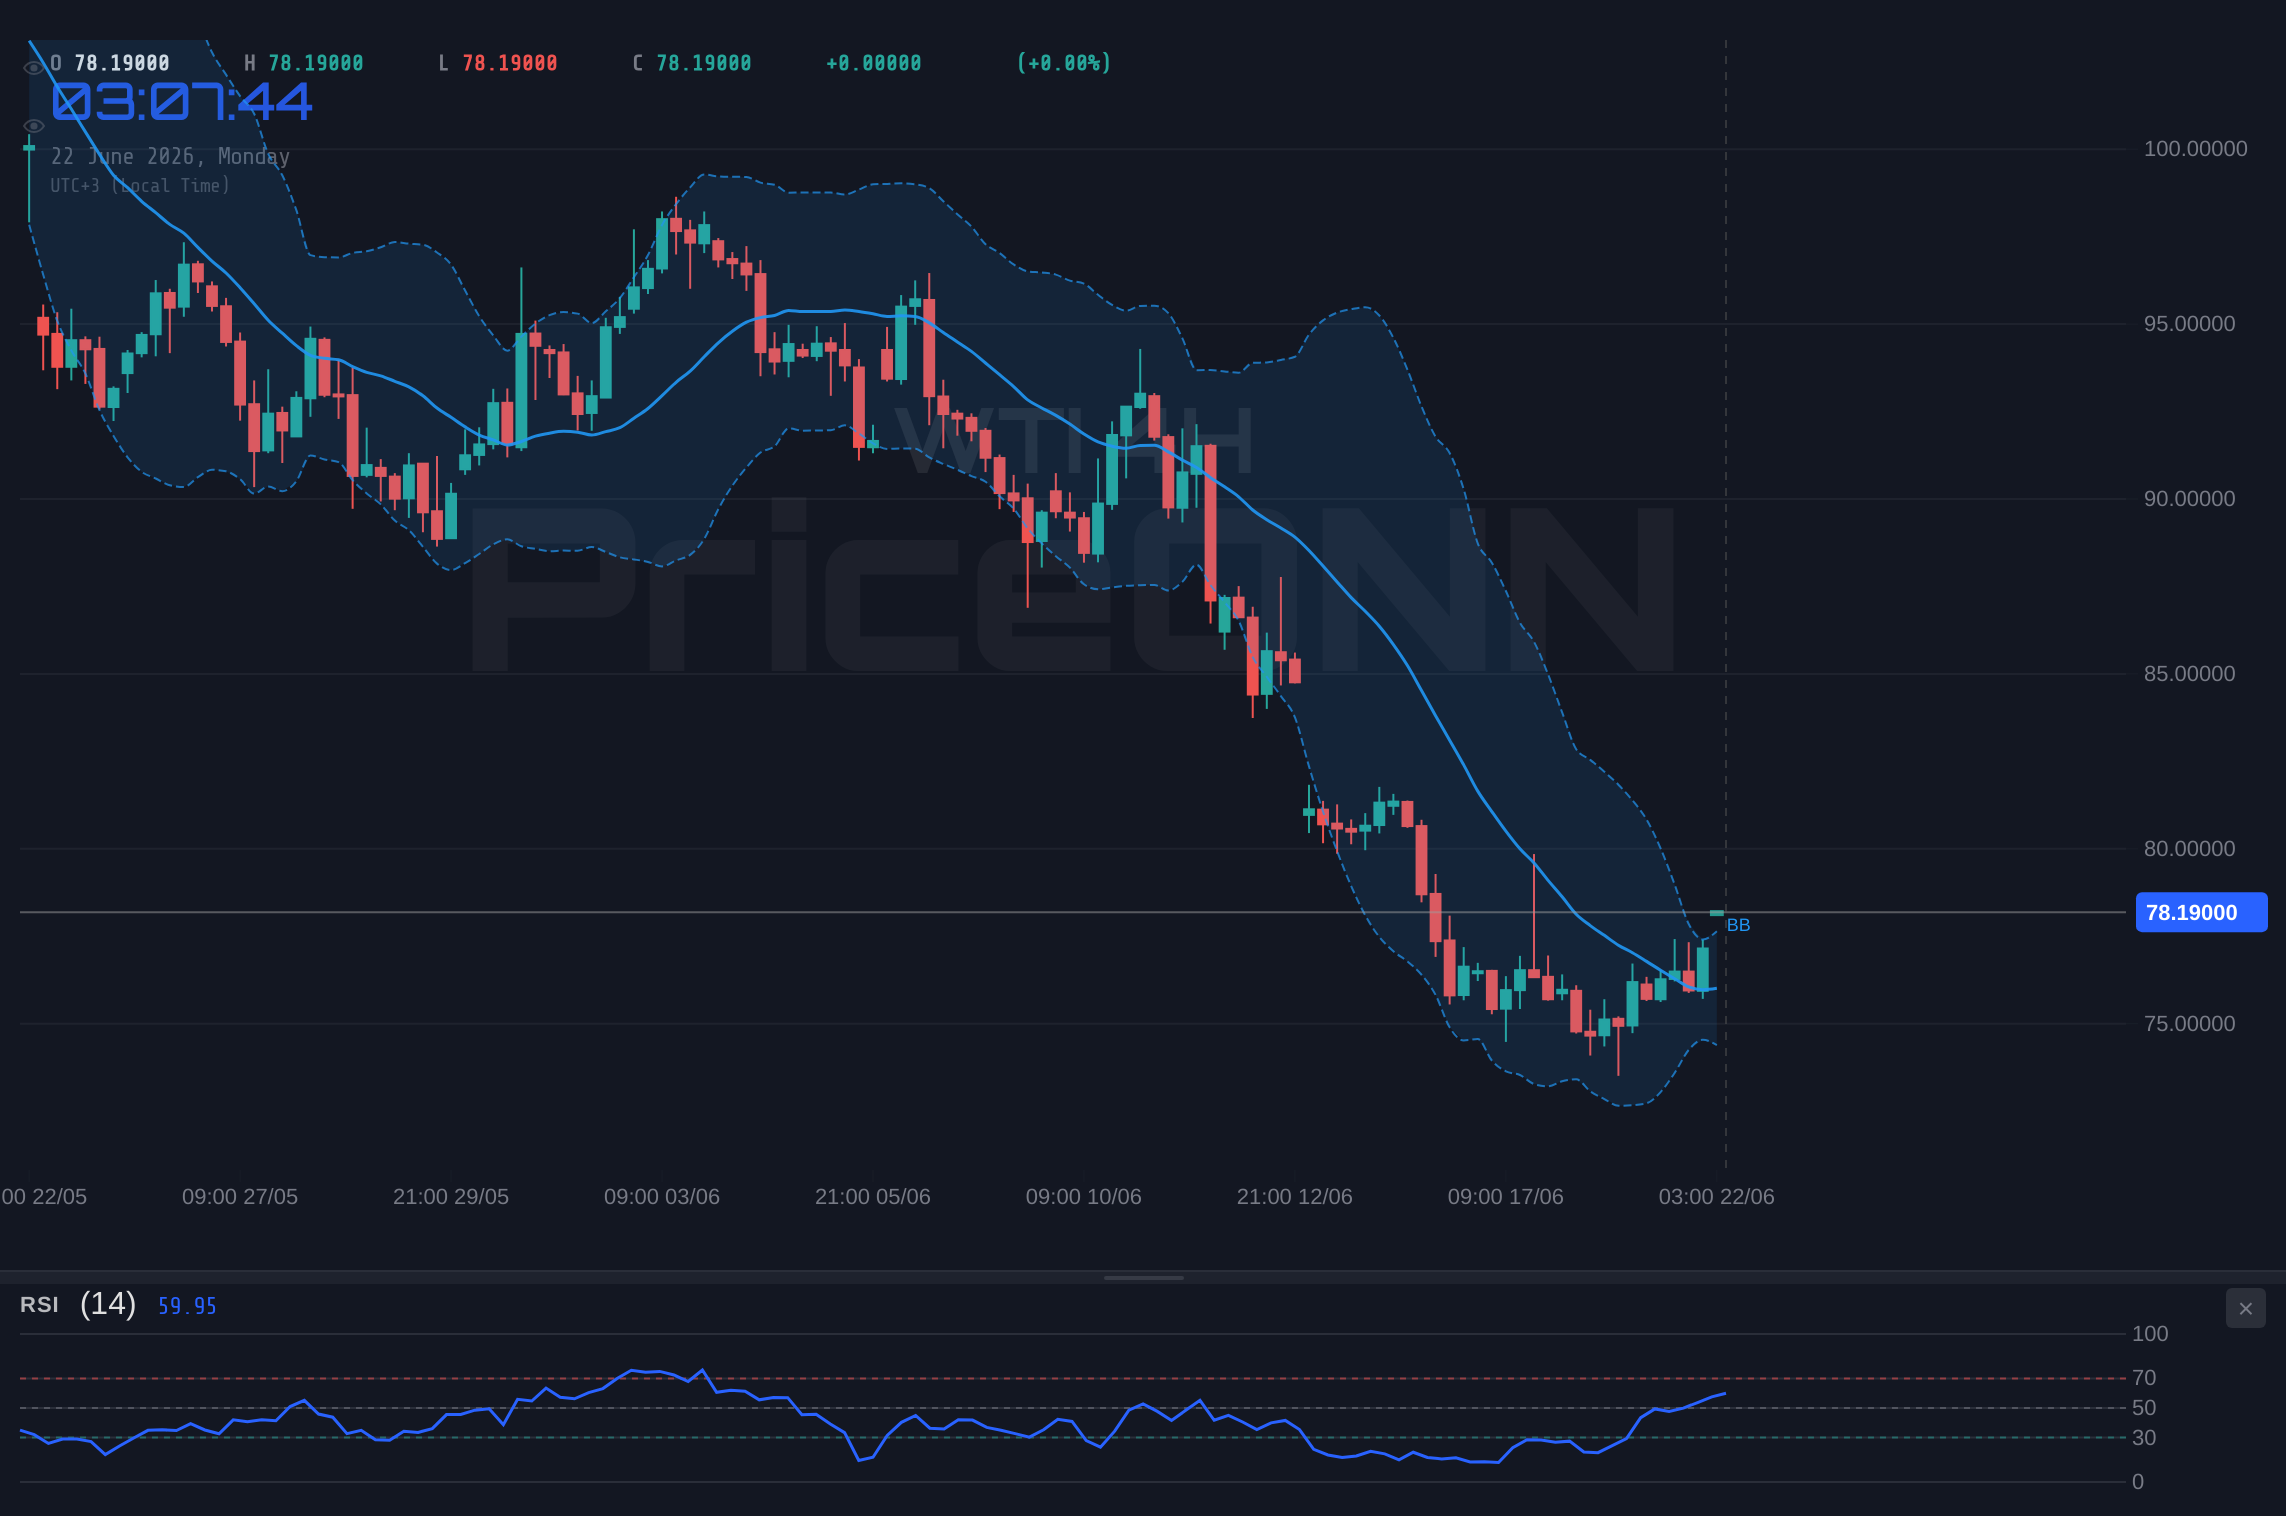
However, the bullish narrative faces significant headwinds, primarily from the technical indicators and broader macroeconomic concerns. While the 1H chart shows strength, the daily timeframe presents a more cautionary outlook. The ADX at 36.72 on the 1D chart indicates a strong downtrend, and the RSI at 34.48 is firmly in neutral territory, leaning towards oversold conditions that could precede further declines if momentum shifts. The MACD is also below its signal line on the daily chart, reinforcing the bearish sentiment. The price is trading below the middle Bollinger Band, a common sign of downward pressure.
The most significant technical warning comes from the RSI on the 1H chart, which is hovering at 67.01. While not yet in extreme overbought territory, this level, combined with the fact that the price is testing resistance, suggests that the upward momentum is weakening. Traders often use such readings as a cue to take profits or enter short positions, anticipating a reversal. The Stochastic indicator on the 1H (K=30.54, D=41.93) also shows a bearish signal, with %K below %D, further reinforcing the idea that the current rally might be losing steam. On the 4H chart, the ADX at 32.07 still points to a strong downtrend, despite some mixed signals from other indicators.
From a fundamental perspective, concerns about global economic growth and potential interest rate hikes by central banks could dampen oil demand. The Federal Reserve's hawkish stance, as hinted at by recent market repricing and the strengthening DXY, could signal tighter financial conditions that eventually curb economic activity. While the US dollar's strength typically puts downward pressure on dollar-denominated commodities like oil, the current environment might see this correlation tested, with geopolitical risk premiums potentially overriding macro headwinds in the short term. However, if demand fears intensify, the current resistance at $78.40 could become a significant stumbling block.
The recent news highlighting the G7's aim to break China's grip on critical minerals, while a long-term strategic move, doesn't immediately translate into a short-term bullish catalyst for oil. Instead, it points to a complex global economic landscape where supply chains and resource access are becoming increasingly politicized. This backdrop, coupled with the possibility of renewed inflation pressures if oil prices spike, could prompt further monetary tightening, thereby increasing the odds of an economic slowdown and reduced oil consumption.
The Battle at $78.40: What the Indicators Say
Looking closely at the confluence of indicators around the $78.40 price point provides a clearer picture of the immediate battle. On the 1H chart, WTI is struggling to hold above the middle Bollinger Band, which is currently acting as a resistance. The RSI at 67.01 suggests that while buyers have been active, they are not in overwhelming control, and a move above this level would require significant conviction. The Stochastic is also showing a bearish crossover, hinting at a potential pullback.
However, the 4H chart offers a slightly more optimistic view for the bulls, with the price above the middle Bollinger Band and a generally bullish trend signal, albeit with a neutral power score. The ADX at 32.07 still indicates a strong downtrend, which is somewhat contradictory to the intraday bullish signals. This divergence between timeframes is typical during periods of consolidation or before a significant move. The daily chart, as mentioned, leans bearish, with a strong ADX of 36.72 and RSI below 50, suggesting that any intraday strength might be temporary unless broader market conditions and fundamental drivers shift significantly.
The interplay between the DXY's upward trend (currently at 100.91) and WTI's price action is critical. Historically, a rising DXY tends to weigh on oil prices. However, the current geopolitical risk premium might be creating a temporary decoupling. If the DXY continues its ascent, driven by hawkish Fed expectations, it could eventually exert more downward pressure on WTI, especially if economic growth concerns escalate. The $78.40 level is where these competing forces are meeting head-on.
The Verdict: Caution Prevails at Resistance
Considering the mixed technical signals and the prevailing macroeconomic environment, the immediate outlook for WTI at $78.40 leans towards caution rather than aggressive bullish conviction. While the intraday momentum has been positive, the daily and hourly charts present compelling evidence of resistance and potential for a pullback. The bearish RSI at 67.01 on the 1H chart, coupled with the price struggling at the upper Bollinger Band and the ADX indicating a strong downtrend on the daily, suggests that the path of least resistance might be downwards from this immediate resistance level.
The fundamental backdrop, while offering some support through geopolitical risk premiums and energy security concerns, is also shadowed by potential demand destruction from higher interest rates and a strengthening dollar. The news regarding Iraq's strategic energy routes and Equinor's field expansion are important supply-side narratives, but they don't negate the demand-side risks if global economic headwinds intensify. The G7's focus on critical minerals also points to a complex global trade environment that could impact commodity prices in unpredictable ways.
Therefore, while a decisive breakout above $78.40 could lead to further gains, the higher probability scenario in the short term involves consolidation or a mild pullback. Traders should pay close attention to the $77.69 support level on the 1H chart. A clear break below this level, especially if accompanied by a decline in the DXY or a shift in risk sentiment, could signal a more significant downward move. Until then, the market is likely to remain sensitive to both supply-side geopolitical developments and demand-side macroeconomic data, with the $78.40 resistance acting as a crucial immediate hurdle.
WTI Price Forecast: Navigating the $78.40 Resistance
The current technical setup for WTI at $78.40 presents a classic resistance test scenario. The 1H chart shows a bullish trend with a power score of 95%, but this is tempered by the daily timeframe's strong downtrend signal (ADX 36.72) and a daily RSI of 34.48. This dichotomy suggests that the intraday strength might be a retracement within a larger downtrend or consolidation phase. The immediate resistance at $78.45, with the price currently at $78.40, is a critical level. A failure to break decisively above this point, especially with the RSI at 67.01 indicating waning momentum on the hourly, could lead to a reversal.
The bullish case hinges on sustained buying pressure, potentially driven by escalating geopolitical tensions that add a significant risk premium to oil prices. If supply disruptions were to materialize more concretely, or if risk appetite were to surge despite macro concerns, WTI could push higher. In such a scenario, the next resistance levels at $80.55 and $80.74 on the 1H chart would become targets. However, this would require overcoming the bearish signals from the daily timeframe and the potentially restrictive impact of a strengthening DXY, currently at 100.91.
Conversely, the bearish case is supported by the weaker daily technicals and the potential for demand destruction. If WTI fails to break above $78.40 and subsequently closes below the 1H support at $77.69, it could trigger a move towards the next support at $77.35 on the daily chart. This would align with the stronger downtrend indicated by the daily ADX and RSI. The overarching macroeconomic environment, including interest rate expectations and global growth prospects, will play a crucial role in determining which scenario unfolds. The market's reaction to upcoming economic data releases, particularly concerning inflation and employment, will be key in shaping the demand outlook.
The news surrounding Iraq's efforts to secure its oil export routes, even as the Strait of Hormuz situation evolves, highlights a strategic shift in energy supply management. This move aims to mitigate risks associated with chokepoints, providing a degree of supply stability that might counter some of the price spikes driven by immediate geopolitical flare-ups. Similarly, Equinor's investment in the Troll field underscores a long-term commitment to energy production, suggesting that while short-term supply concerns can drive prices, the underlying production capacity is being actively managed and expanded in key regions.
Bearish Scenario: Resistance Holds Firm
65% ProbabilityNeutral Scenario: Consolidation Around Resistance
25% ProbabilityBullish Scenario: Breakout Above Resistance
10% ProbabilityFrequently Asked Questions: WTI Analysis
What happens if WTI fails to break above $78.45 resistance?
If WTI fails to sustain a move above $78.45, a pullback is likely. The 1H chart's bearish RSI at 67.01 and Stochastic crossover suggest a move towards the $77.69 support level could occur, especially if the DXY continues to strengthen.
Should traders consider buying WTI at current levels around $78.40 given the bullish intraday signals?
Buying at current levels carries risk due to the strong resistance and bearish signals on higher timeframes. A more prudent approach would be to wait for a confirmed breakout above $78.45 with strong volume or a pullback to a key support level like $77.69, especially if accompanied by positive divergence.
Is the RSI at 67.01 on the 1H chart a definitive sell signal for WTI?
An RSI of 67.01 on the 1H chart is approaching overbought territory but not definitively a sell signal on its own. It indicates that upward momentum is slowing. Confirmation from other indicators, like a bearish Stochastic crossover and price action failing to break resistance, strengthens the case for caution or a potential short-term reversal.
How might upcoming economic data impact WTI prices around the $78.40 resistance level?
Upcoming economic data, particularly inflation and employment figures, will be crucial. Stronger-than-expected data could fuel Fed tightening expectations, boosting the DXY and potentially pressuring WTI lower by increasing demand destruction fears. Conversely, weaker data might ease tightening concerns, potentially supporting oil prices if geopolitical risks remain elevated.
Track markets in real-time
AI-powered analysis, technical indicators and real-time price data.
Join Our Telegram Channel
Breaking market news, AI analysis and trading signals instantly.
Join Channel