Gold, or XAUUSD, is currently hovering around the $4,193.53 mark, presenting a pivotal moment for traders and investors. The precious metal has seen a notable upward push, with its daily change standing at a significant +0.92%, adding $38.16 to its value. This move has pushed the price into a crucial resistance zone, making the $4,205.17 level a key point of interest. Understanding the interplay of various technical indicators across different timeframes is paramount to navigating this volatile environment. The current price action suggests a battle is brewing between buyers and sellers, with the outcome likely dictated by a confluence of technical signals and broader market sentiment.
- RSI at 53.29 on the 1H chart signals neutral momentum with a slight upward bias, while the 1D RSI at 38.6 indicates a bearish trend.
- Critical support for XAUUSD sits at $4,174.14 (1H) and $4,113.61 (1D), tested multiple times this week.
- The ADX reading of 37.39 on the daily chart confirms a strong downward trend, despite the intraday bullish price action.
- Correlation with the DXY, currently at 100.98 and showing a strong upward trend, suggests potential headwinds for gold if the dollar continues to strengthen.
The 1-hour chart presents a somewhat mixed picture, typical of intraday trading where short-term fluctuations can obscure the larger trend. The trend is currently marked as neutral with a 50% strength, indicating indecision in the immediate market. However, the RSI(14) at 53.29 suggests a slight upward inclination, keeping bulls cautiously optimistic. The MACD is showing positive momentum, with its signal line above the histogram, and Bollinger Bands are trading above the middle band, hinting at a near-term bullish bias. Yet, the Stochastic indicator presents a conflicting signal with %K (54.57) below %D (57.3), suggesting a potential pullback. The ADX at 24.81 indicates a moderately strong uptrend on this timeframe, but the overall signal leans towards 'BUY' with 5 buy signals against 3 sell signals, reflecting this intraday chop.
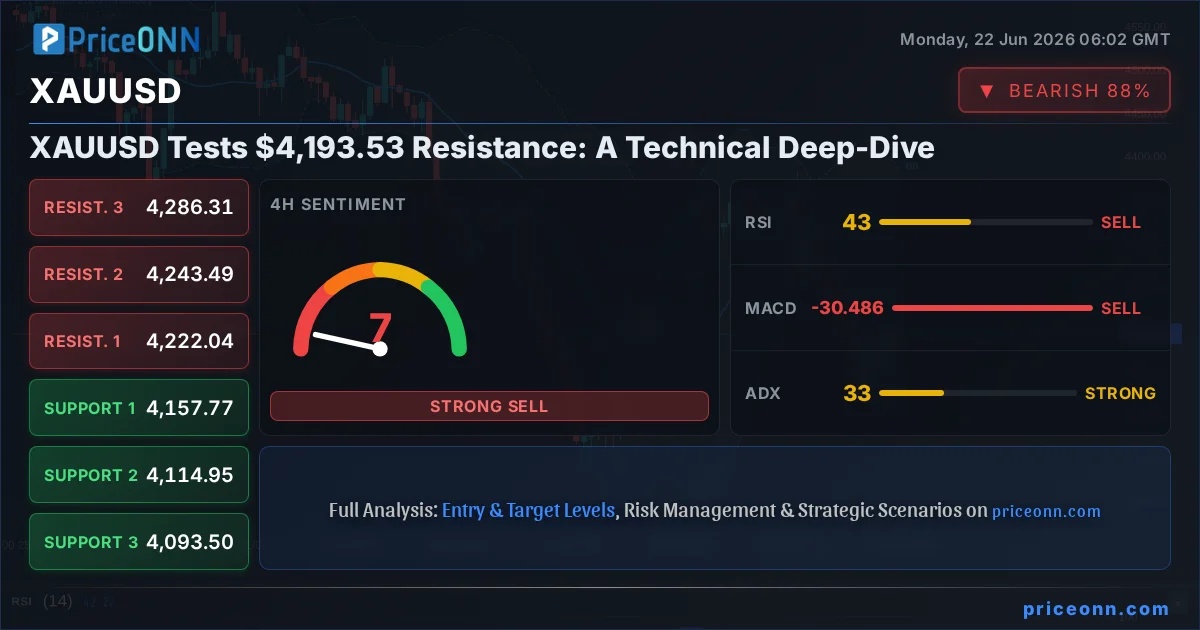
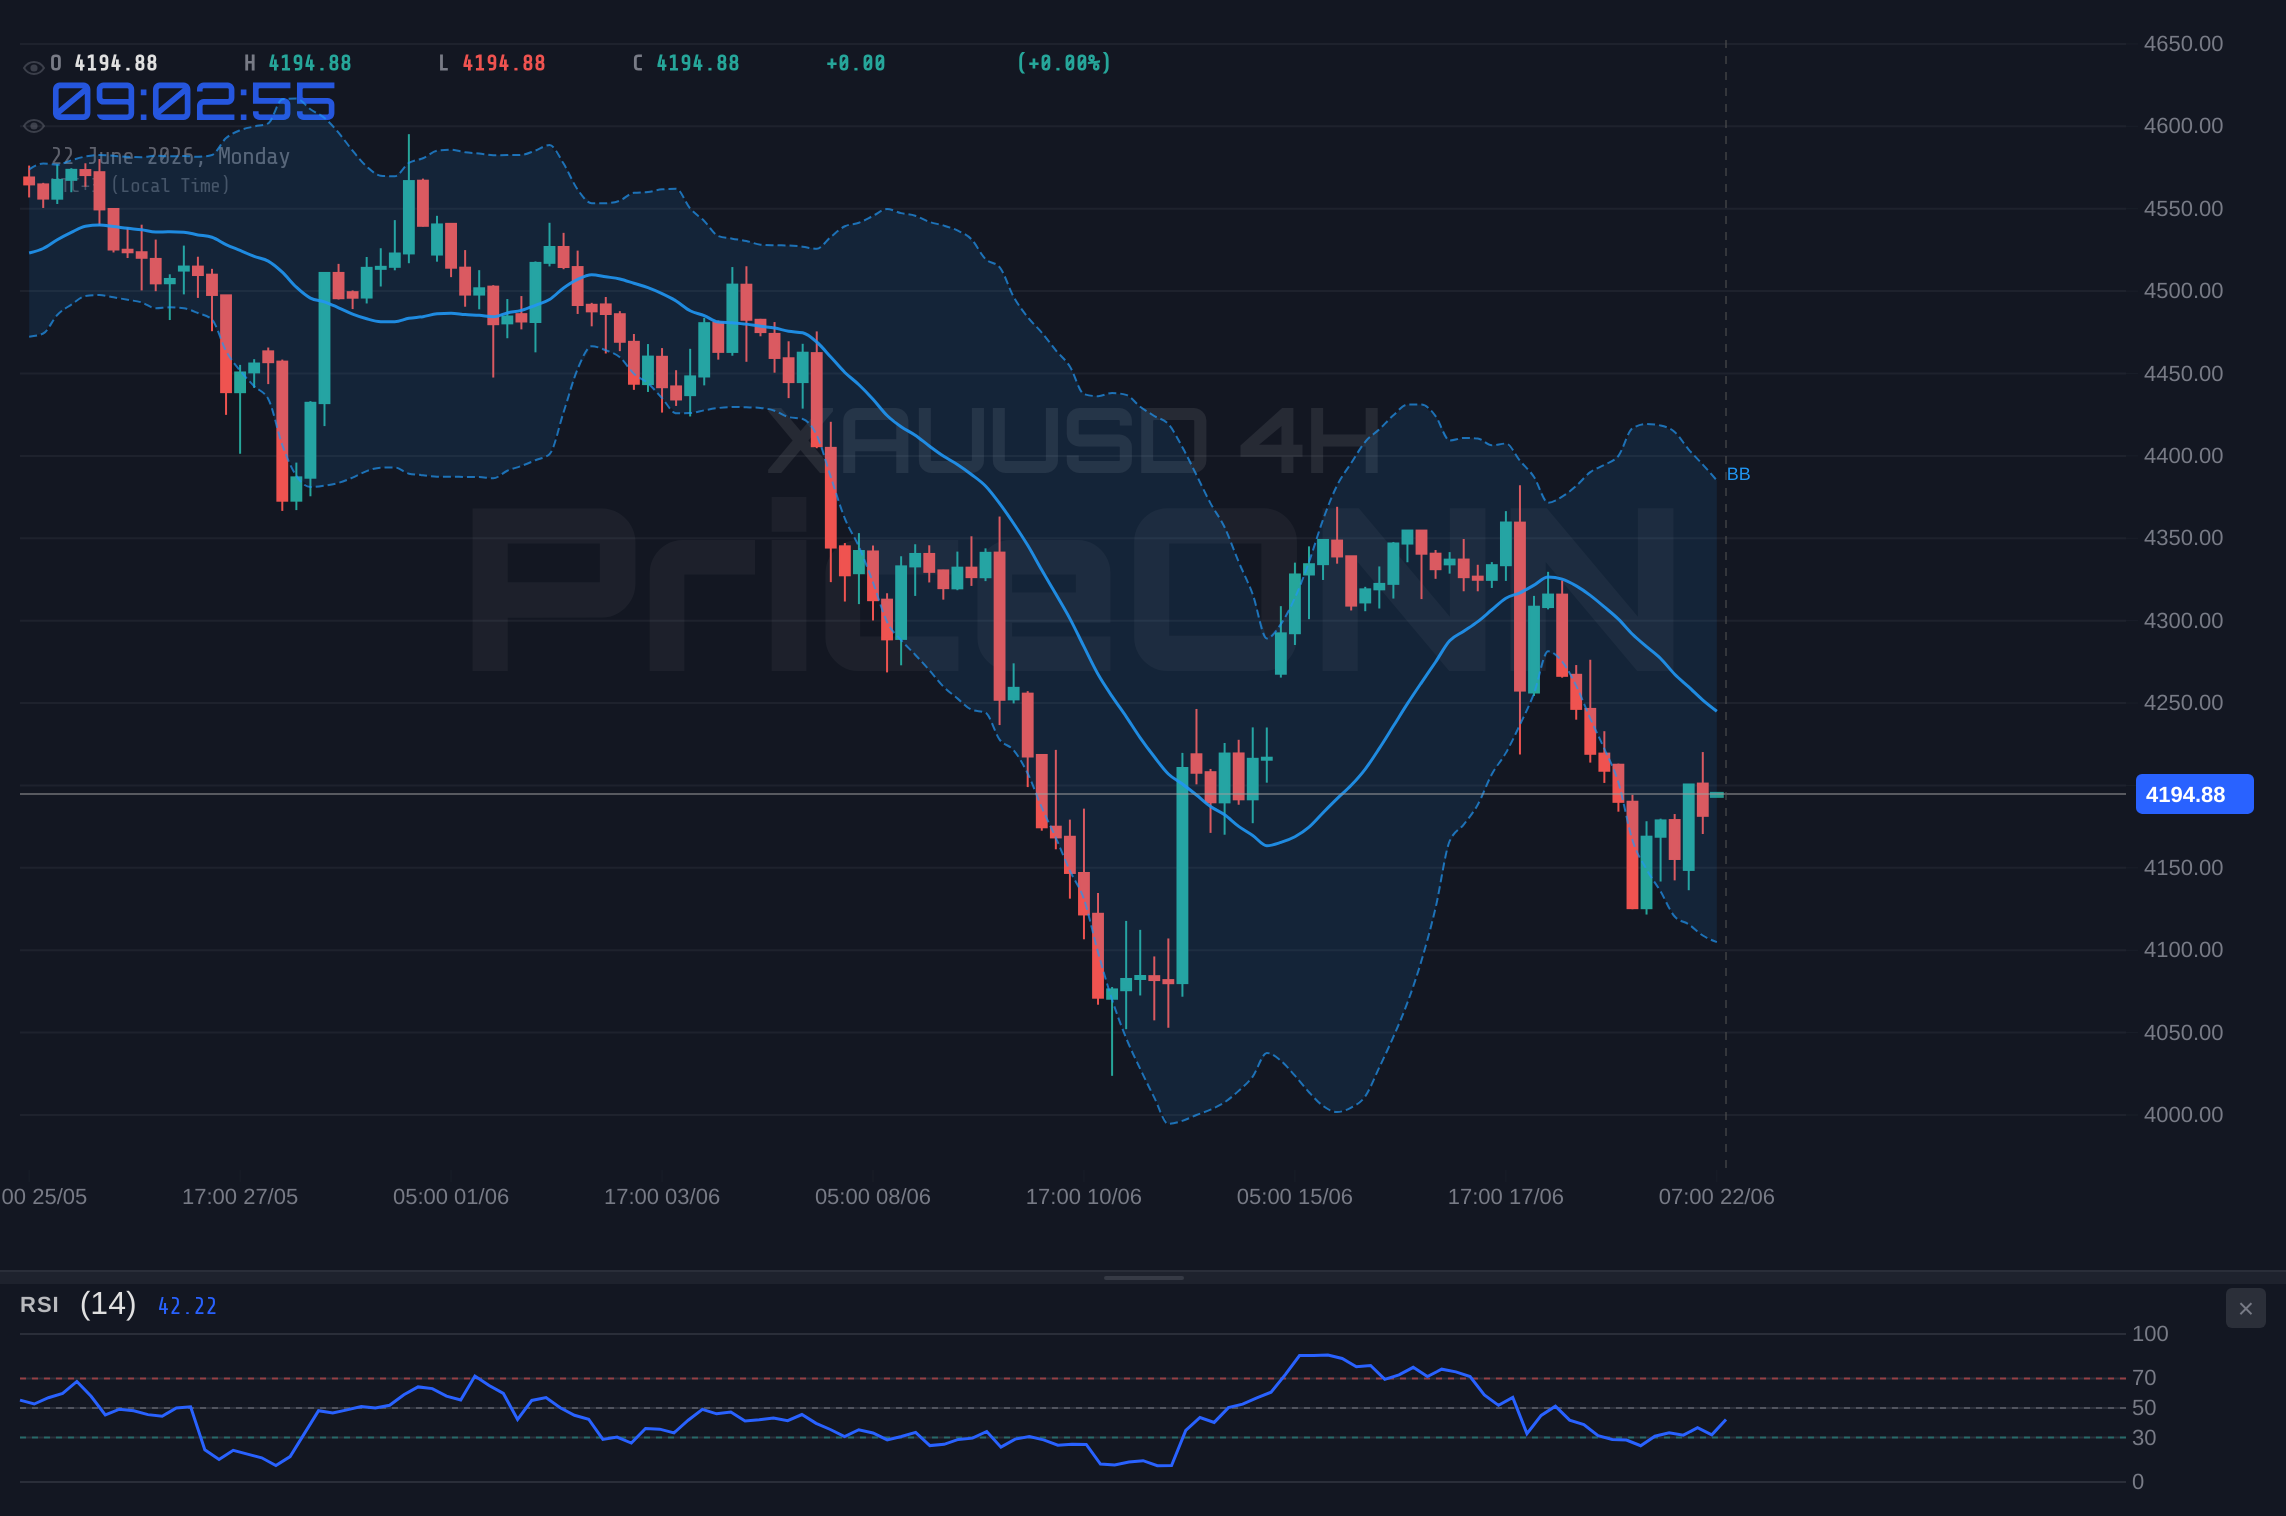
Diving deeper into the 4-hour timeframe, the narrative shifts towards a more bearish outlook. Here, the trend is also neutral, but the strength is equally divided at 50%. The RSI(14) drops to 43.34, showing a clear downward eğilim, and the MACD is firmly in negative territory, with its histogram below the signal line, indicating weakening momentum. Bollinger Bands are also trading below the middle band, reinforcing the bearish sentiment on this timeframe. Interestingly, the Stochastic indicator here shows a bullish signal with %K (38.05) above %D (19.99), a divergence from the RSI and MACD. The ADX at 32.54 signifies a strong downtrend, and the overall signal for the 4-hour chart is a clear 'SELL', with a significant majority of indicators pointing downwards. This divergence between short-term momentum and longer-term trend strength is a classic sign of market indecision, but the heavier weighting on the sell side here cannot be ignored.
The daily chart paints the most concerning picture for the bulls, strongly suggesting a prevailing downtrend. The trend is classified as 'Düşüş' (Downtrend) with a very high power at 94%. The RSI(14) is sitting at 38.6, firmly in the neutral zone but with a clear downward trajectory, indicating that sellers are gaining ground. The MACD continues its negative momentum, staying below the signal line, and the Bollinger Bands are also below the middle band, confirming the bearish pressure. The Stochastic indicator shows a bearish signal, with %K (45.25) below %D (50.08). Crucially, the ADX at 37.39 indicates a strong downtrend, reinforcing the daily outlook. The overwhelming signal across the daily indicators is 'SELL', with zero buy signals and eight sell signals. This strong daily bearish signal needs to be respected, even as we observe intraday price action attempting to push higher.
Now, let's consider the broader market context and correlations, which are vital for understanding gold's potential trajectory. The DXY, or Dollar Index, is currently trading at 100.98 and exhibits a strong upward trend across all timeframes, particularly on the 4-hour (ADX 48.17) and daily (ADX 37.39) charts. A strengthening dollar typically exerts downward pressure on gold, as they often move inversely. The current DXY level suggests that the dollar is showing resilience, which could act as a significant headwind for gold prices, especially if this trend persists. Furthermore, US equity indices like the S&P 500 (currently at 6572.87, showing a daily rise of 0.74%) and Nasdaq (30326.27, relatively flat) are also in play. While a strong equity market can sometimes correlate with risk-on sentiment that favors gold, the underlying trend on the S&P 500's daily chart is bearish (ADX 47.51), which might indirectly support safe-haven assets like gold, although the current price action is mixed.
The $4,205.17 Battleground: Key Levels and Price Action
The immediate price action for XAUUSD centers around the $4,193.53 mark. On the 1-hour chart, the first key resistance level stands at $4,185.46, followed by $4,189.37 and then the crucial $4,196.78. A break above this immediate cluster could pave the way for testing the more significant daily resistance at $4,205.17. This level is particularly important because it represents a significant psychological and technical barrier. Historically, such levels often act as strong magnets for price before a decisive move. If gold can decisively break and hold above $4,205.17, it would signal a potential shift in short-term momentum and could invalidate some of the bearish signals observed on longer timeframes. Conversely, failure to overcome this resistance could see prices retreating to test immediate support levels.
Looking at the support side, the 1-hour chart offers levels at $4,174.14, $4,166.73, and $4,162.82. These are the immediate floors that could cushion any downside price action. However, the more critical support lies on the daily chart, starting with $4,113.61, then $4,071.86, and further down at $4,022.05. The proximity of the 4-hour support at $4,157.77 also adds weight to the lower end of the price spectrum. A decisive break below the $4,113.61 daily support would likely confirm the bearish trend indicated by the daily ADX and RSI, potentially triggering further selling pressure towards the lower support zones. The interplay between these resistance and support levels will be the primary driver of price action in the short to medium term.
The divergence across timeframes is the most compelling narrative right now. The 1-hour chart shows signs of life, with positive momentum and a 'BUY' signal from its aggregated indicators. This is likely driven by short-term trading activity, perhaps anticipating a bounce or a test of higher intraday levels. However, the 4-hour and especially the daily charts scream caution. The strong bearish trend indicated by the daily ADX (37.39) and the sustained negative MACD momentum suggest that the underlying pressure is still downwards. This creates a classic scenario where intraday gains might be temporary, and the larger trend could reassert itself. Traders need to be particularly wary of potential 'bull traps' - moves that lure buyers in before reversing sharply.
The Trade Stance: Navigating the Gold Conundrum
Given the current technical landscape, a cautious approach is warranted. The prevailing 1-day trend is strongly bearish, supported by a high ADX reading and negative MACD momentum. While the 1-hour chart shows some bullish signs, these appear to be battling against the stronger, longer-term bearish signals. The DXY's strength at 100.98 adds another layer of complexity, typically acting as a drag on gold prices. Therefore, any bullish outlook must be contingent on significant technical breaks and a clear invalidation of the daily downtrend. The $4,205.17 resistance level emerges as the immediate battleground; a decisive close above this on a daily basis would be required to even consider a more substantial bullish reversal.
Conversely, the bearish case is supported by the daily trend data and the dollar's strength. A breakdown below the 1-hour support at $4,174.14 could initiate a move towards the daily support at $4,113.61. The ADX at 37.39 on the daily chart suggests that if a trend is to take hold, it has the power to be sustained. This means that a break of support could lead to a swift move lower, rather than a period of consolidation. The current readings suggest that while there might be opportunities for short-term bullish trades on the 1-hour chart, the overall risk profile favors the downside in the medium term, assuming the daily trend continues to dictate price action.
The geopolitical backdrop, particularly the Hormuz crisis mentioned in recent news, adds a layer of uncertainty that often benefits gold as a safe-haven asset. However, the immediate market reaction seems to be focused more on the dollar's strength and Fed policy expectations, as highlighted by recent financial news. While a potential escalation in the Middle East could provide a sudden boost to gold, the current technicals do not yet reflect this as a primary driver. The energy market, with Brent Crude falling 1.92% to $78.61, also suggests a potential easing of inflation fears, which could reduce some of the safe-haven demand for gold. It’s a complex web of factors, but currently, the technical indicators are leaning more towards a bearish outlook on longer timeframes.
Scenario Analysis: Mapping the Path Forward for Gold
Bearish Scenario: Sellers Take Control
65% ProbabilityNeutral Scenario: Range-Bound Consolidation
25% ProbabilityBullish Scenario: Resistance Breakout
10% ProbabilityFrequently Asked Questions: XAUUSD Analysis
What happens if XAUUSD breaks above the $4,196.78 resistance level?
A decisive break above $4,196.78 on the 1-hour chart could signal short-term strength, potentially pushing XAUUSD towards the key daily resistance at $4,205.17. However, the stronger bearish trend on the daily chart means this move might face significant selling pressure near $4,205.17.
Is the RSI at 53.29 a buy signal for XAUUSD right now?
The 1-hour RSI at 53.29 indicates neutral momentum with a slight upward tendency, not a strong buy signal in itself. While it suggests some buying interest, it needs to be considered alongside other indicators, especially the daily RSI at 38.6 which points to a bearish trend.
How will the DXY's strength at 100.98 affect XAUUSD's price?
The DXY is at 100.98 and showing a strong upward trend, which typically puts downward pressure on gold prices. If the dollar continues to strengthen, it could limit upside potential for XAUUSD and increase the likelihood of testing lower support levels.
Should I consider buying XAUUSD if it falls to the $4,113.61 support level?
The $4,113.61 level represents significant daily support. While a bounce is possible, the strong daily downtrend (ADX 37.39) suggests caution. A confirmed break below this level would invalidate any bullish hopes and likely lead to further declines, so a clear bullish reversal signal would be needed before considering a buy.
Track markets in real-time
AI-powered analysis, technical indicators and real-time price data.
Join Our Telegram Channel
Breaking market news, AI analysis and trading signals instantly.
Join Channel